
Nike & Lululemon: Where They Stand and When to Buy
Stories earn attention. Fundamentals and structure earn capital.

The last two weeks delivered a sharp reminder of how quickly expectations can reset.
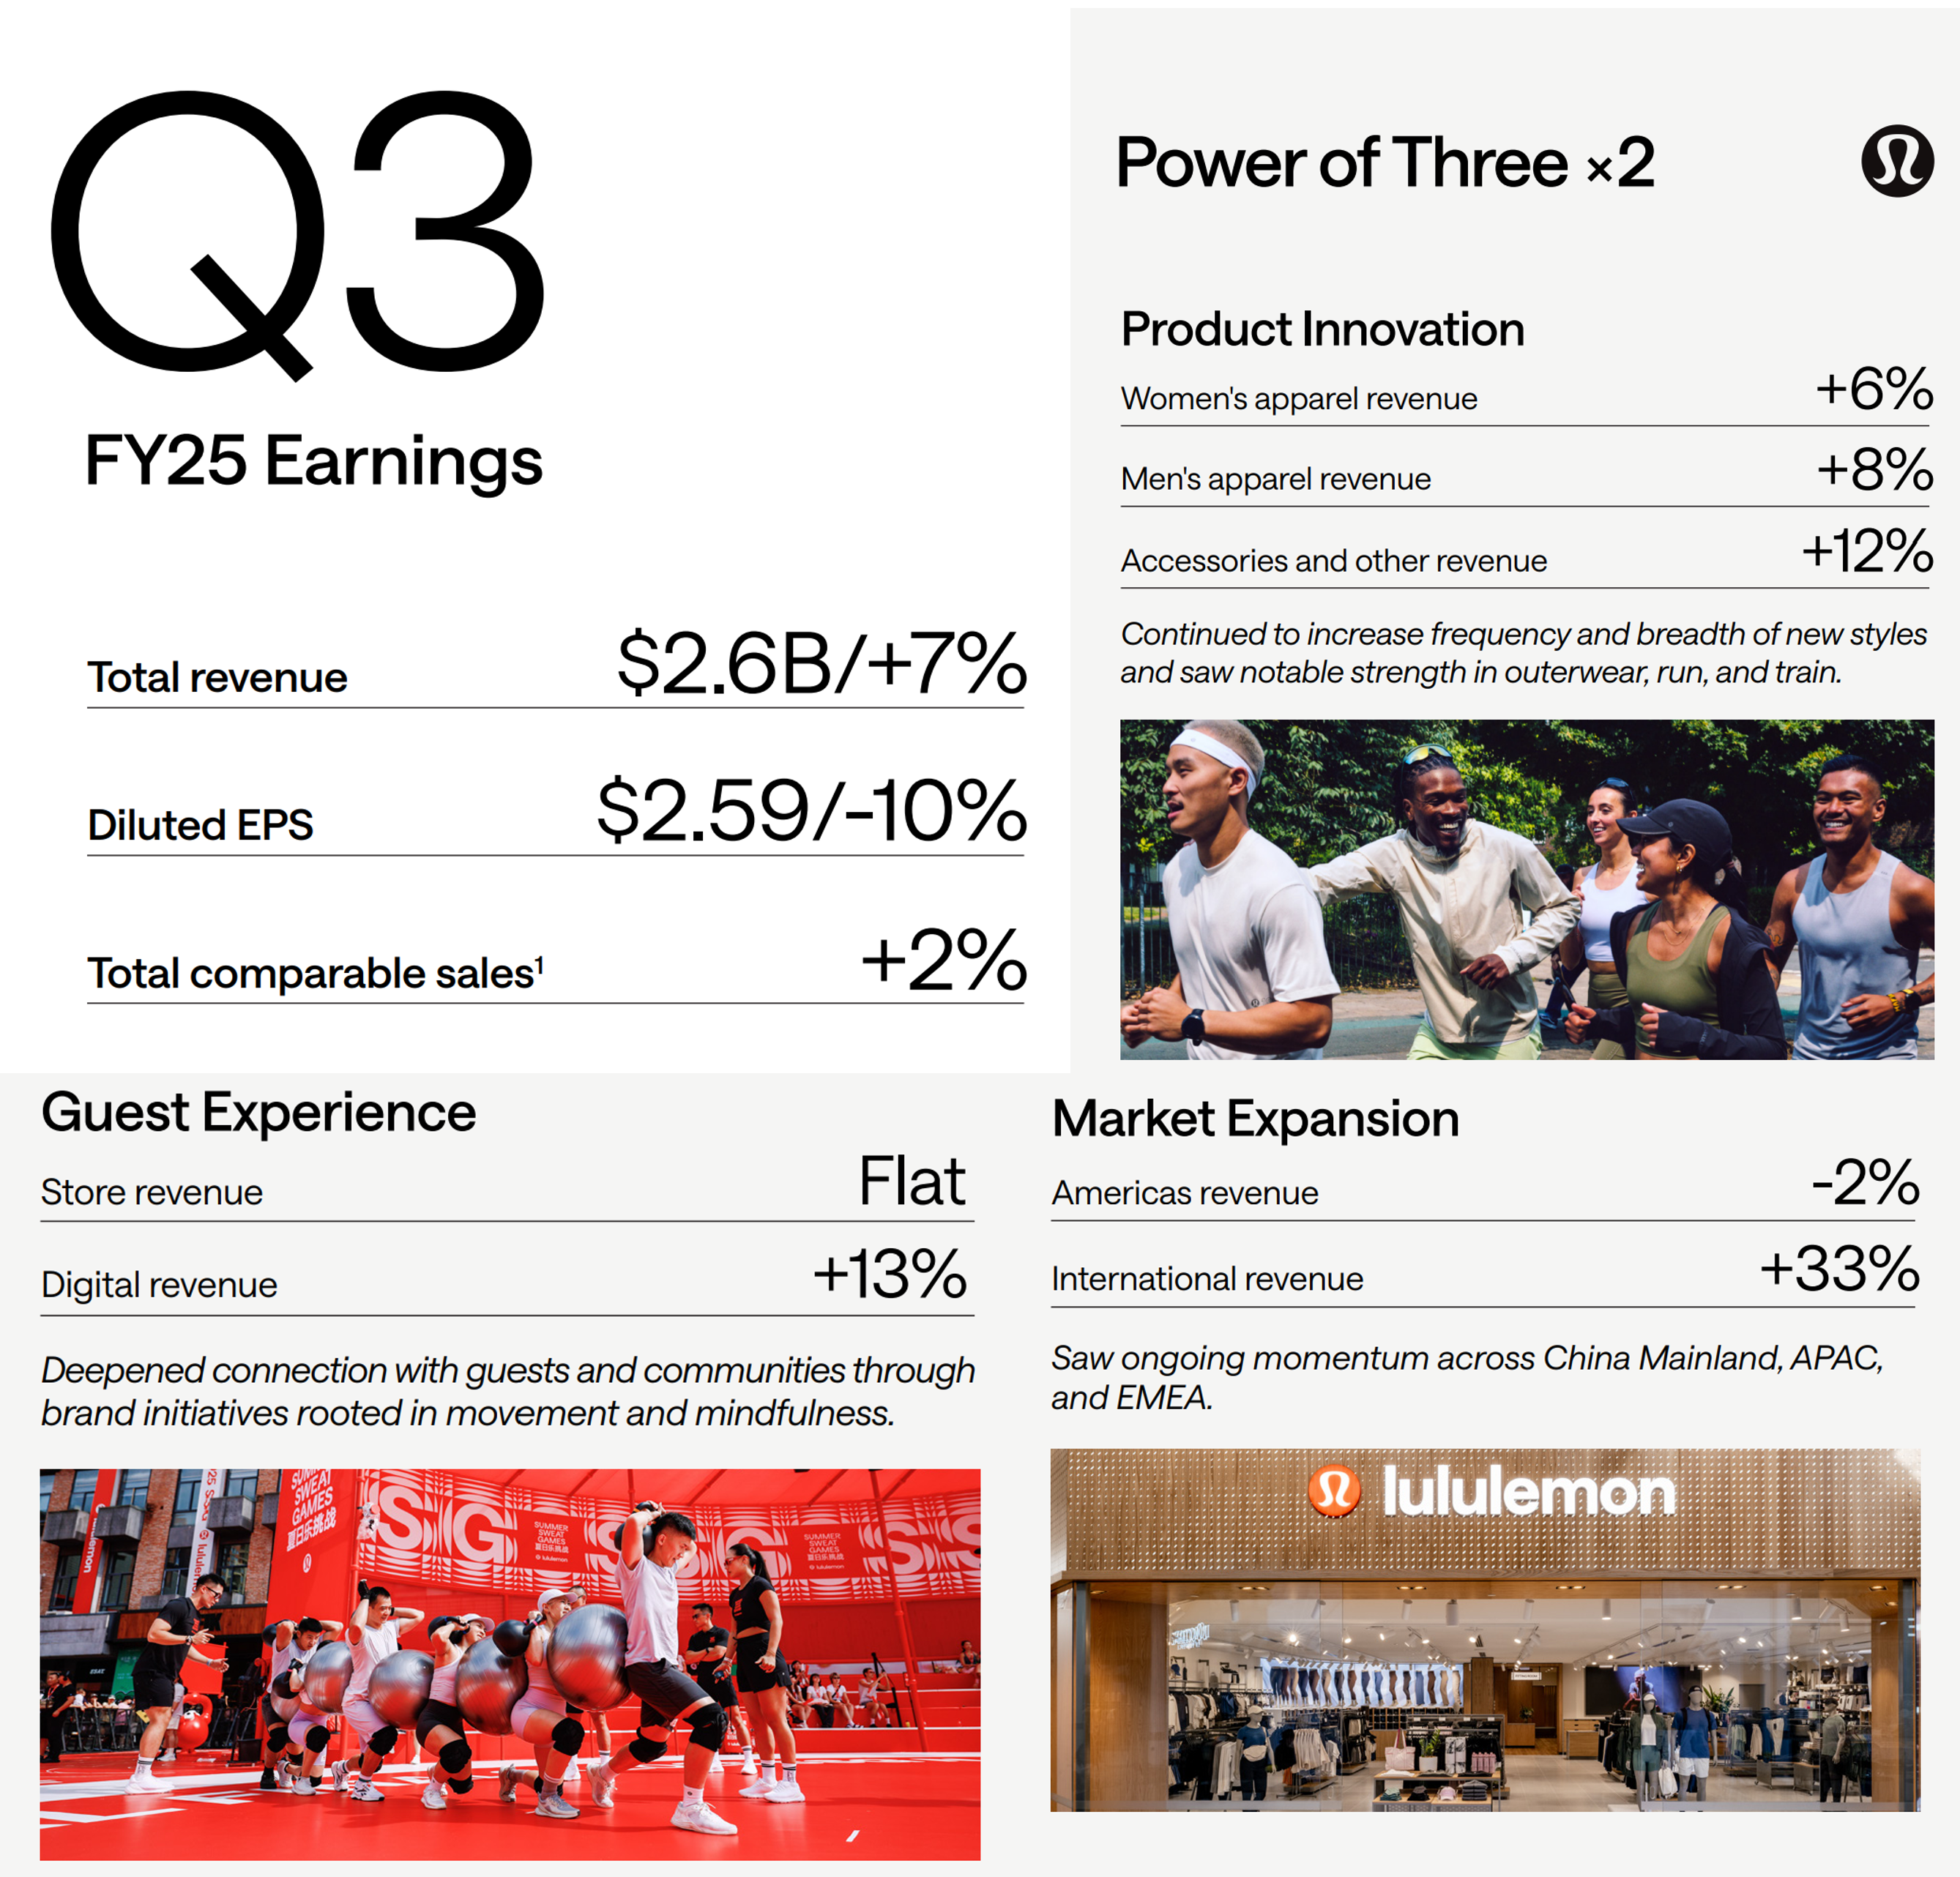
Nike NKE 0.00%↑ and Lululemon LULU 0.00%↑ both reported earnings. The outcomes could not have been more different. Nike’s results triggered a double-digit selloff, as guidance confirmed that earnings pressure and margin normalization will take longer than the market had hoped. Lululemon, by contrast, rallied nearly 10% after its report, as the numbers reinforced the view that its slowdown is already being absorbed and its margin structure remains intact.
Those reactions matter. Not because they define the long-term quality of either brand, but because they tell us where the market is now drawing the line between patience and proof.
This post looks at Nike and Lululemon side by side, through the lens that actually governs outcomes after earnings: how fundamentals are evolving, how price is responding, and where execution and levels define opportunity.

Key Takeaways
Nike sold off sharply after earnings, signaling the market is resetting expectations for a slower, longer earnings recovery.
Lululemon rallied on earnings, confirming confidence in its margin durability and recovery path.
Nike’s earnings pressure is driven by volume and operating leverage, not a collapse in pricing power, but the reset is not finished.
Lululemon retains premium economics with high margins, strong cash flow, and balance sheet flexibility despite slower growth.
Nike remains in a repair phase below key resistance; rallies are counter-trend until structure improves.
Lululemon is in an early uptrend; pullbacks are constructive while higher lows hold.
Nike needs time and proof. Lululemon offers cleaner risk-reward on pullbacks.
Nike (NKE)
When structure breaks, patience becomes a strategy.
Nike is not simply “down.” It is down in a very specific way: it failed to hold the levels that were supposed to act like a floor, then sold through them with force. That’s the difference between a pullback and a regime shift.
Business & catalysts
Nike’s setup is being defined by a multi quarter reset and a market that wants evidence before it pays up again. The key “catalyst” from a price perspective is not a headline. It is whether price can rebuild above broken supply and hold higher lows long enough for institutions to re risk.
Fundamental picture
Here’s the core tension that explains why the chart looks like it does.
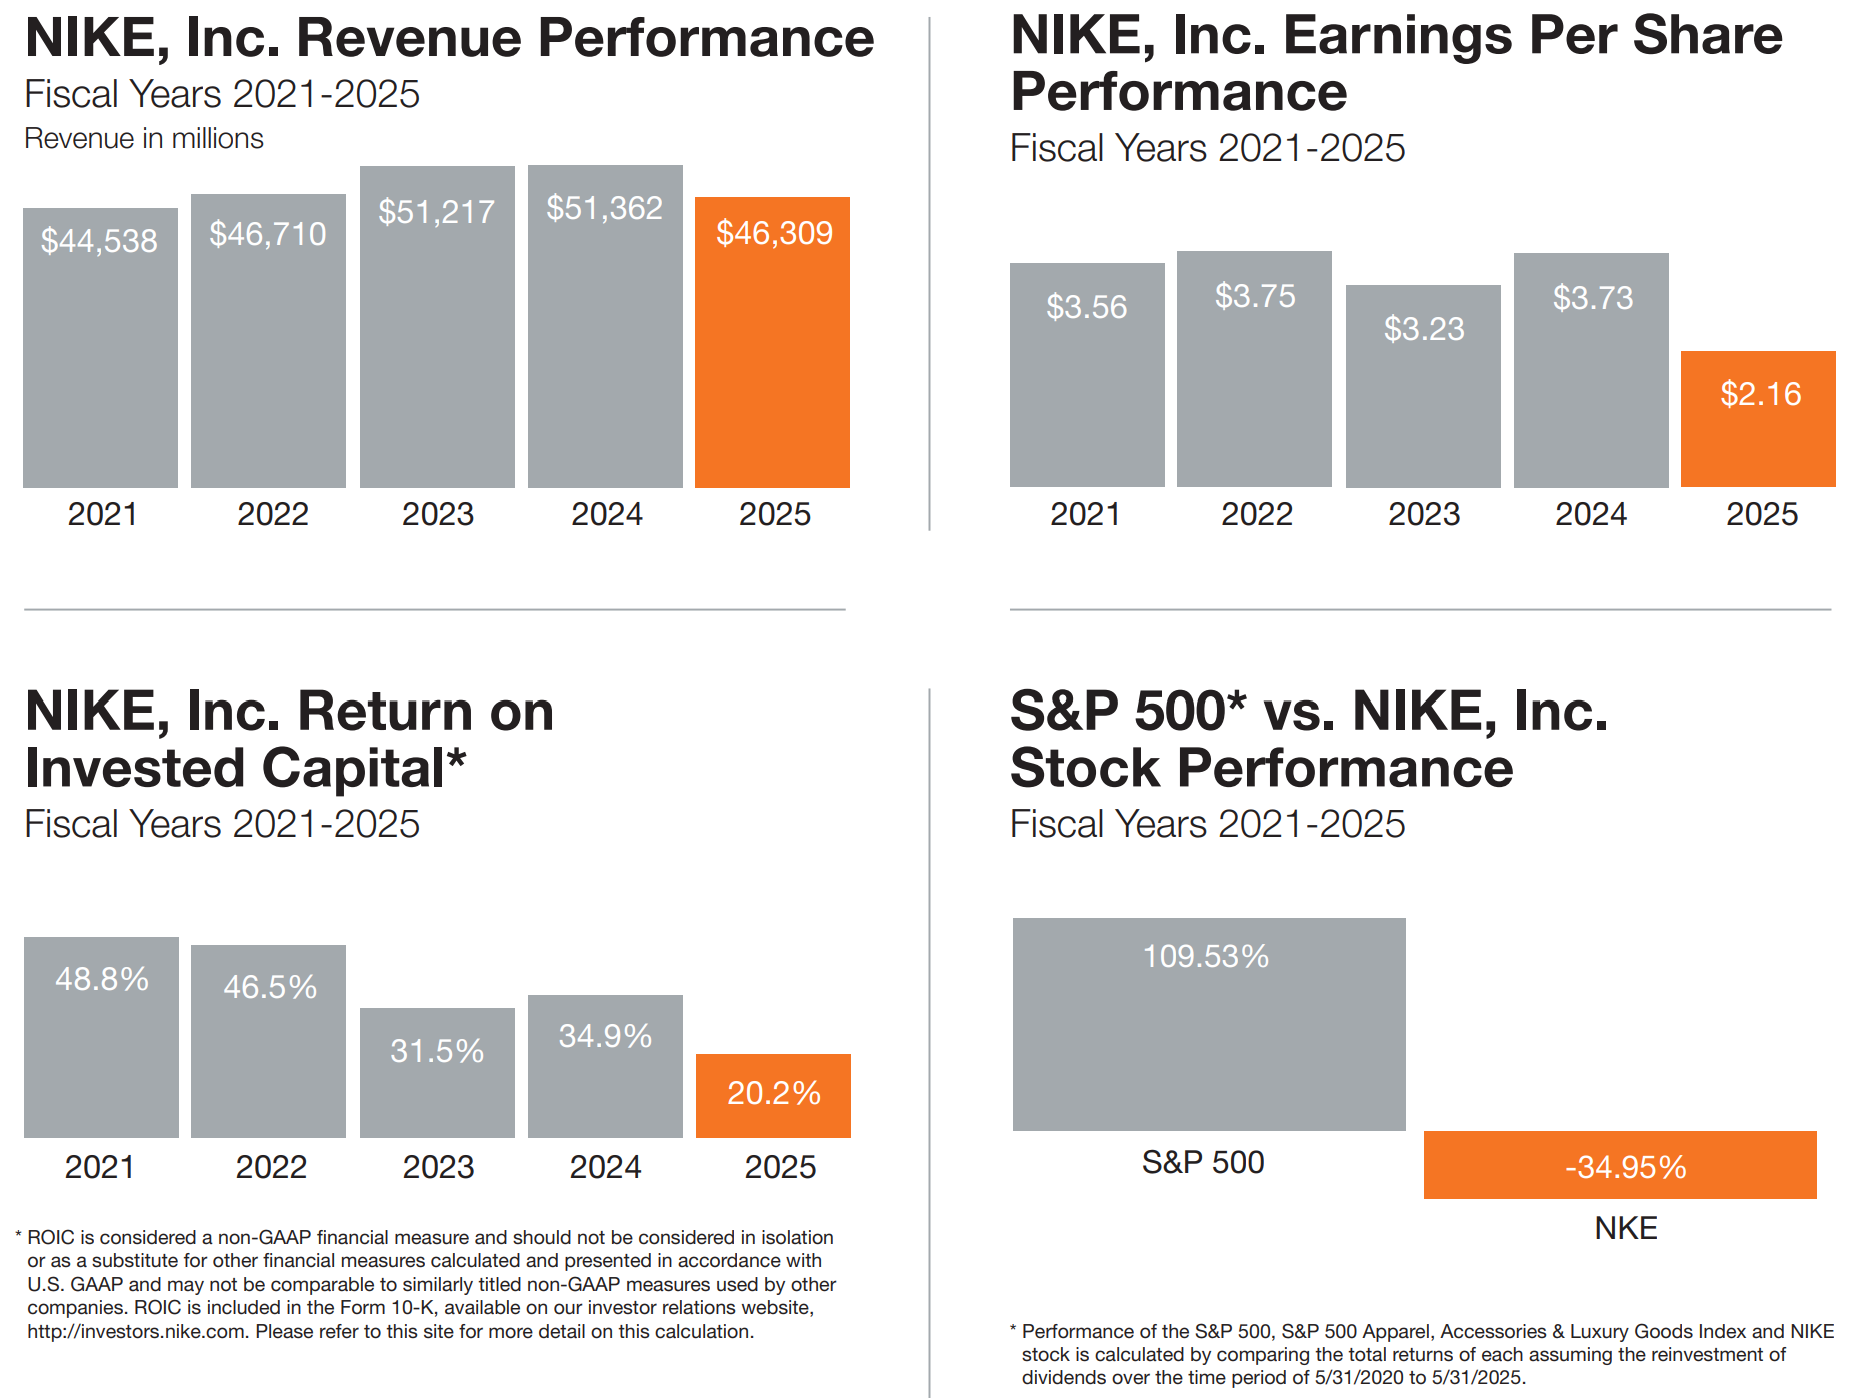
EPS is expected to drop about 45% year over year. That is not a minor wobble. That is an earnings downcycle.
Gross margin is expected to contract only slightly, roughly 44% to 42%. This is important. It says the problem is not primarily “margin collapse.” It is volume and operating leverage.


Valuation is still not cheap on near term earnings, around 28 times forward. The market often refuses to pay that multiple while earnings are still falling.
Longer term, it looks more reasonable, around 17 times based on 2028 EPS. That is why Nike can become a “patient accumulation” story again, but only after the tape stops bleeding.
The business is not broken, but the earnings cycle is still pressuring confidence. That usually means the chart needs time, not hero entries.
Technical analysis
Nike is trading around 58.7 and that single number is doing a lot of work.
Higher timeframe structure
The weekly chart has a major reference at 59.91. Price is now below it. That turns 59.9 to 61.3 into overhead supply. If price cannot reclaim that zone, rallies tend to fail.
The next downside magnets on the weekly mapping are:
54.65 which is the next measured support area on the weekly structure.
51.90 as the next shelf below that.
47.96 as the deeper “if this turns into a real unwind” level.
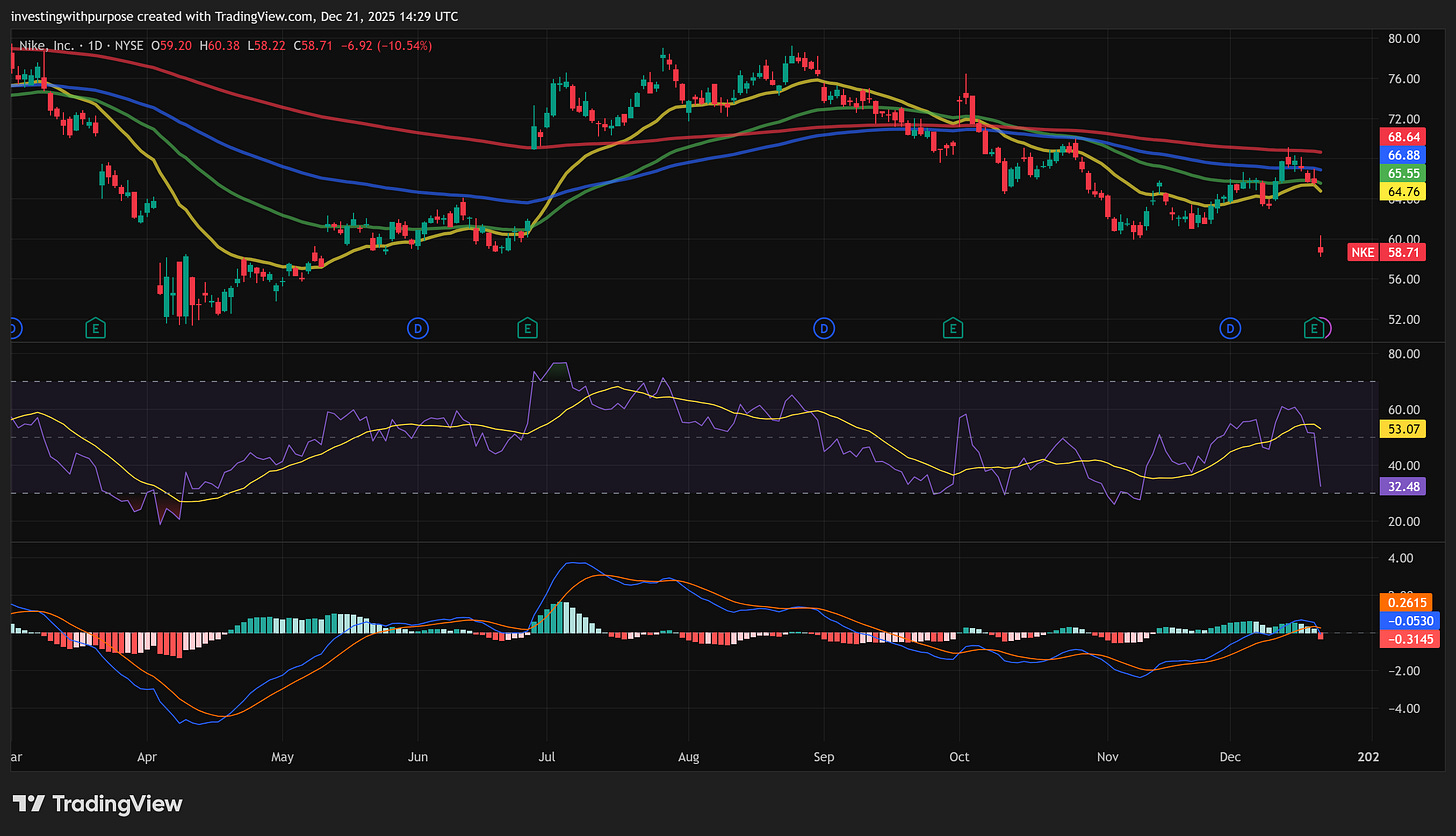
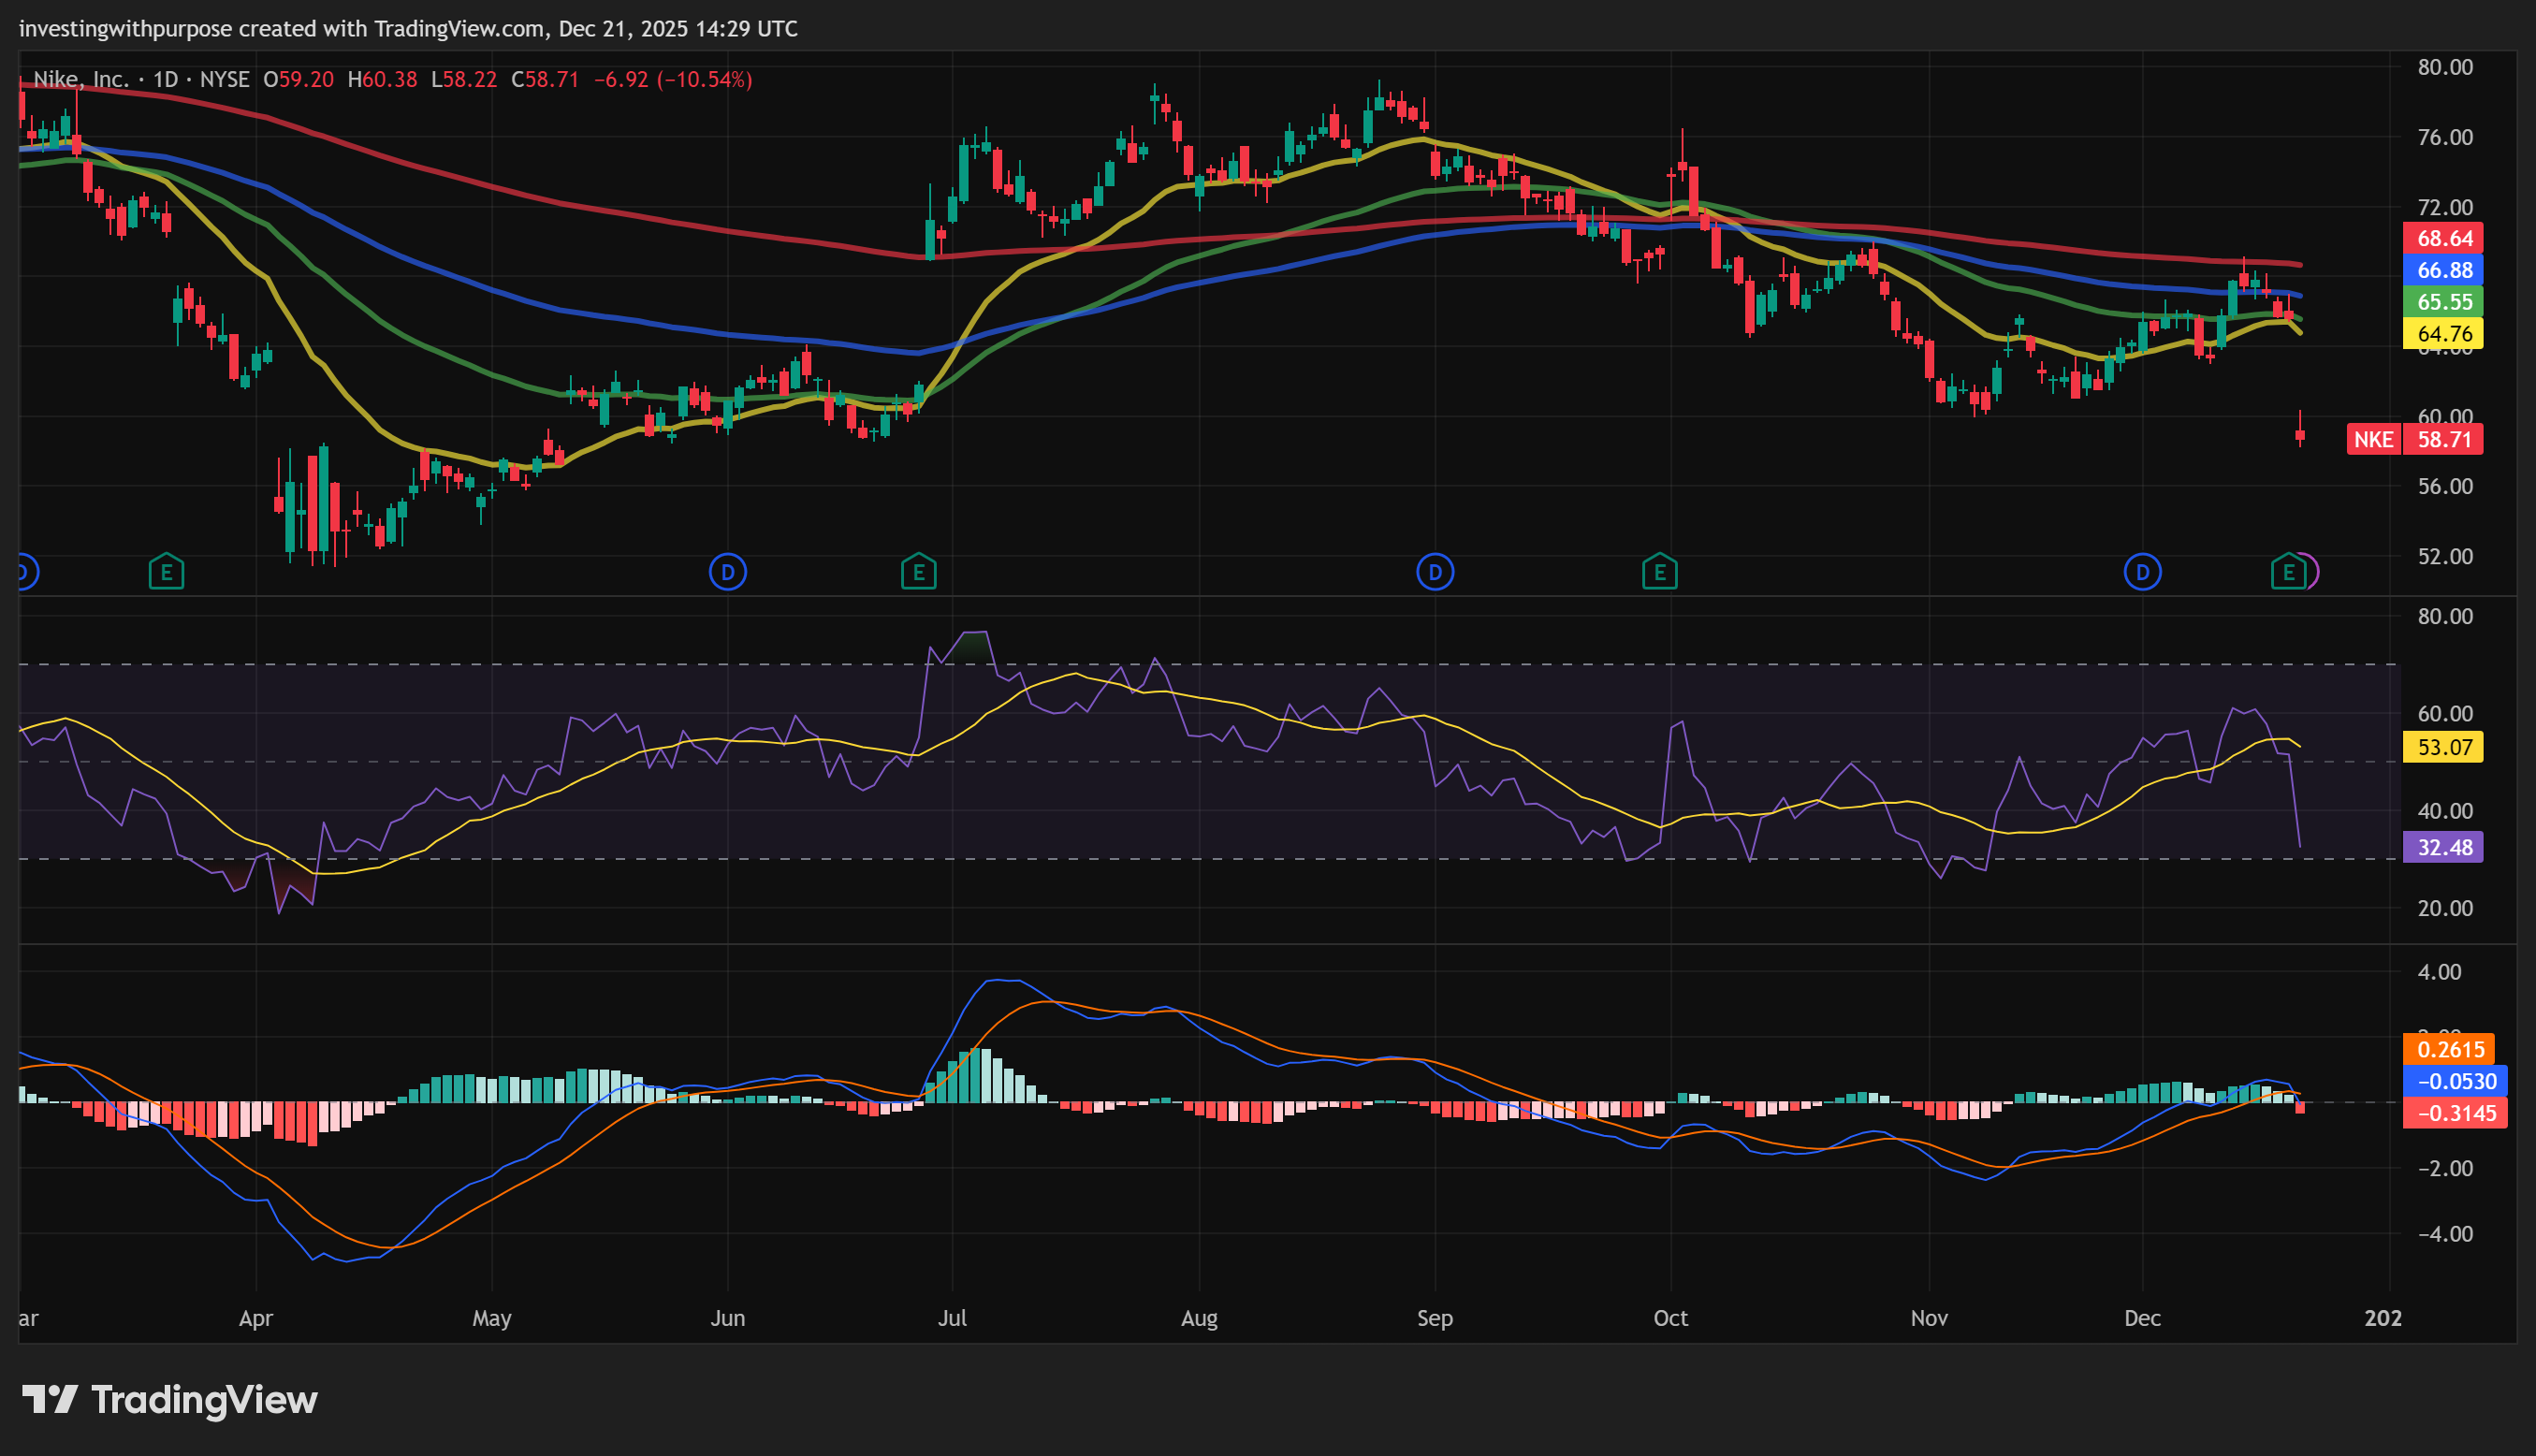
Medium timeframe mapping: The prior rebound zone in the mid 60s has now flipped to resistance. The key cluster is:
64.30 to 68.60 which includes multiple retracement references: 64.30, 65.12, 66.45, 67.39, 68.59. This zone matters because it is the area that bulls would need to reclaim to prove the breakdown was a trap. Until then, it acts like a ceiling.
Cycle read: Nike looks like late stage correction turning into a new leg down. The character changed when it lost the weekly pivot. That is the moment “buy the dip” stops working and “sell the bounce” starts working.
Right now, Nike is a broken structure trying to find demand. The burden of proof is on bulls, and the first proof is a reclaim of 59.9 to 61.3 followed by stability.
Lululemon (LULU)
Quality trends don’t need drama. They need levels.
Lululemon reported on Dec 11, 2025 and the stock jumped about 9.25%. That created a classic post earnings problem: momentum got hot fast, then price had to digest. The current question is not whether the brand is strong. It’s whether the next pullback holds a higher low and keeps the rebuild intact.
Pipeline, business, and catalysts
From a market standpoint, Lululemon is being valued like a premium operator that can keep growing without sacrificing profitability. The “pipeline” is simple: keep expanding revenue while protecting margin structure, and let buybacks do the compounding work when the tape is choppy.
What matters most is not a single quarter. It’s the consistency in unit economics and cash conversion.
Fundamental picture
This is where Lululemon separates itself.
Growth and profitability
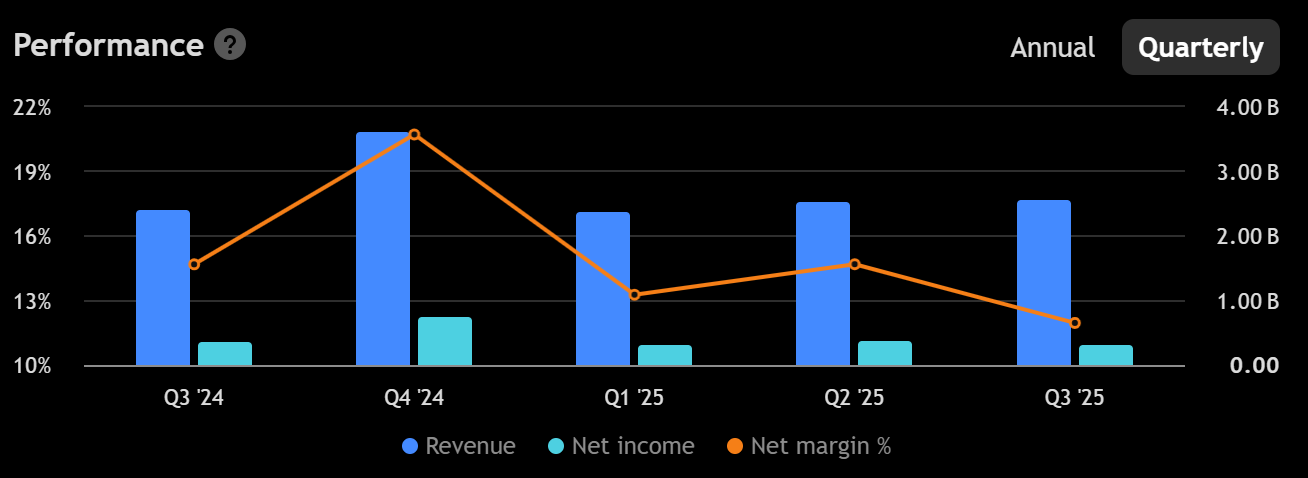
Latest quarter revenue is about $2.566B, up roughly 7.1% year over year.
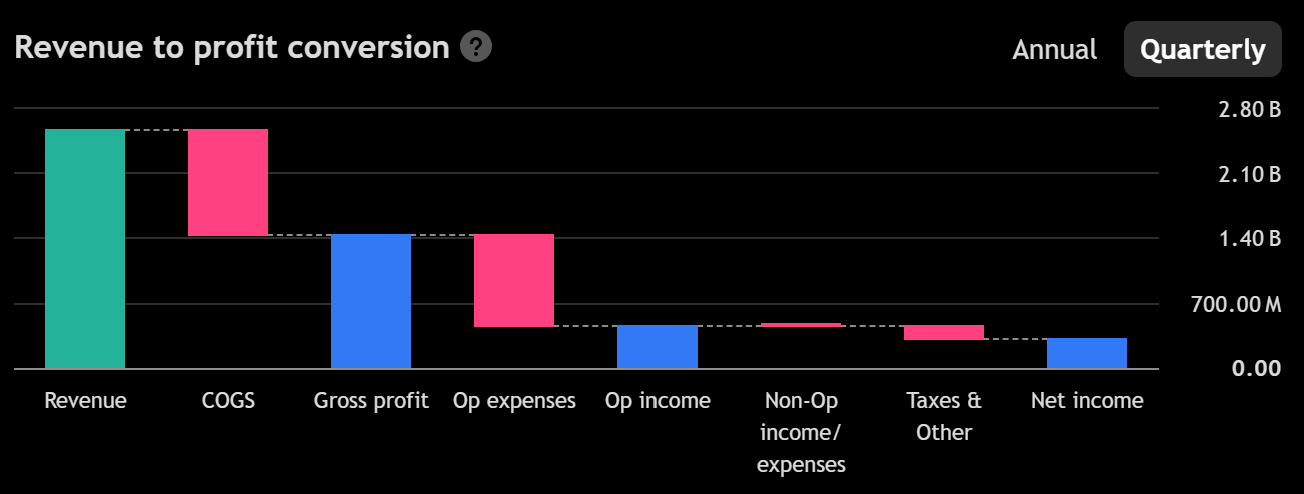
That’s not hypergrowth, but it is resilient growth in a premium discretionary category.Gross margin is about 55.6%.
That’s elite. It means pricing power and a business model that can fund growth without living on promotions.

Operating margin in the latest quarter is roughly 17.2%.
Still strong, even as the company invests.Diluted EPS from continuing ops is about $2.23 in the latest quarter, down about 9.8% year over year.
That divergence matters: revenue up, EPS down usually signals higher costs, mix shifts, or investment timing. It does not automatically signal demand weakness.
Cash flow and balance sheet
Trailing 12 month cash from operations is about $1.86B.
That is the engine.Trailing 12 month free cash flow is about $1.13B after capex.
That is real financial flexibility.Trailing 12 month buybacks are about $1.27B.
That is meaningful and it changes the math of per share compounding when done through cycles.Cash is about $1.04B and total debt about $1.76B.
Net debt is modest for this cash generation profile, and equity sits around $4.50B.
Lululemon looks like a high margin compounder that is still throwing off enough cash to defend the equity story, even when earnings growth is not perfectly linear.
Technical analysis
Trend and regime
Price is around 209.4 after a sharp post earnings spike and pullback.
Daily moving averages are stacked in a constructive way for a rebuild:
EMA 20 near 192.8
EMA 50 near 184.7
EMA 200 near 223.3
This says the short and medium trend is improving, but the long term trend is still overhead. That’s typical early in a larger recovery.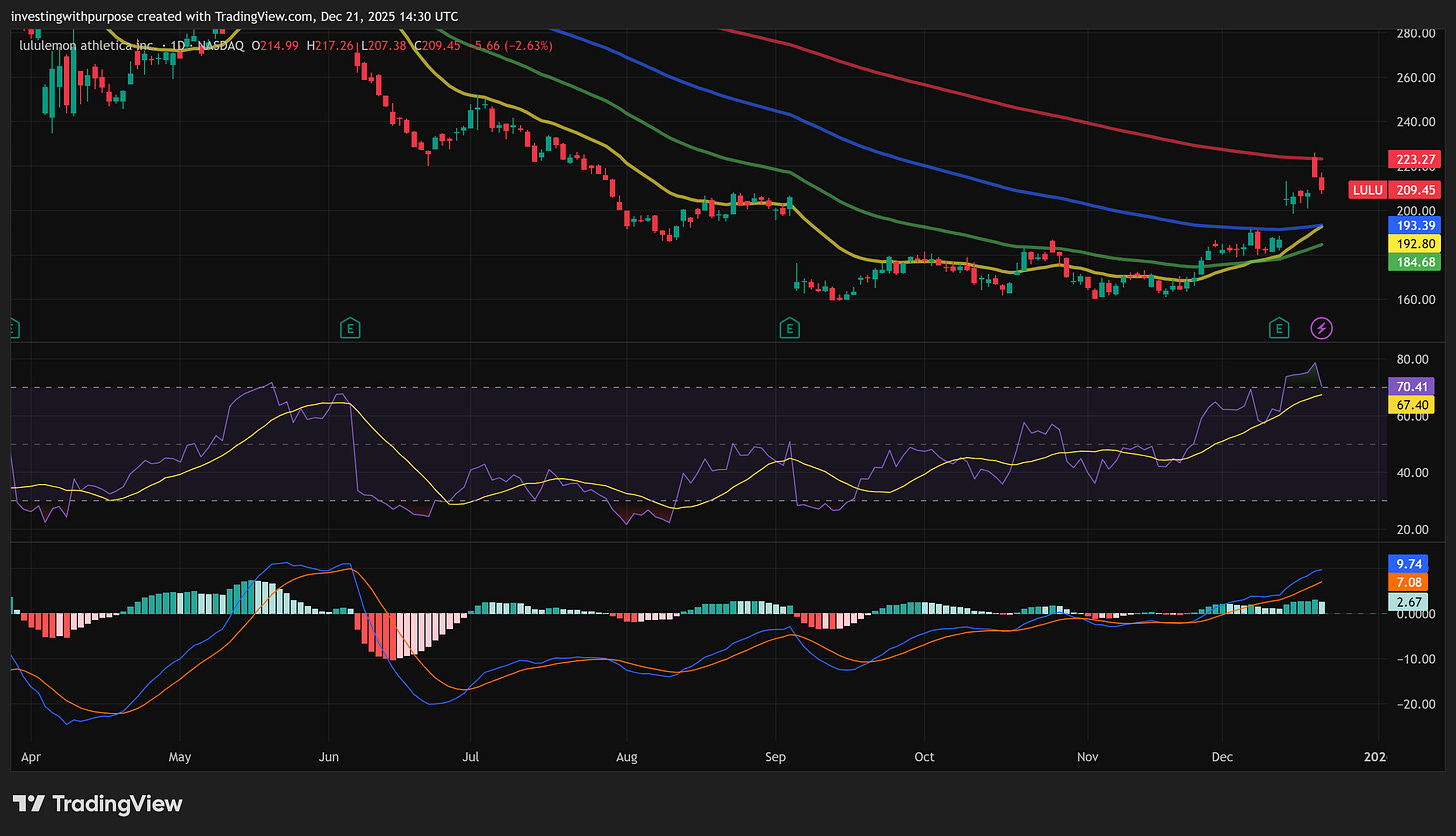
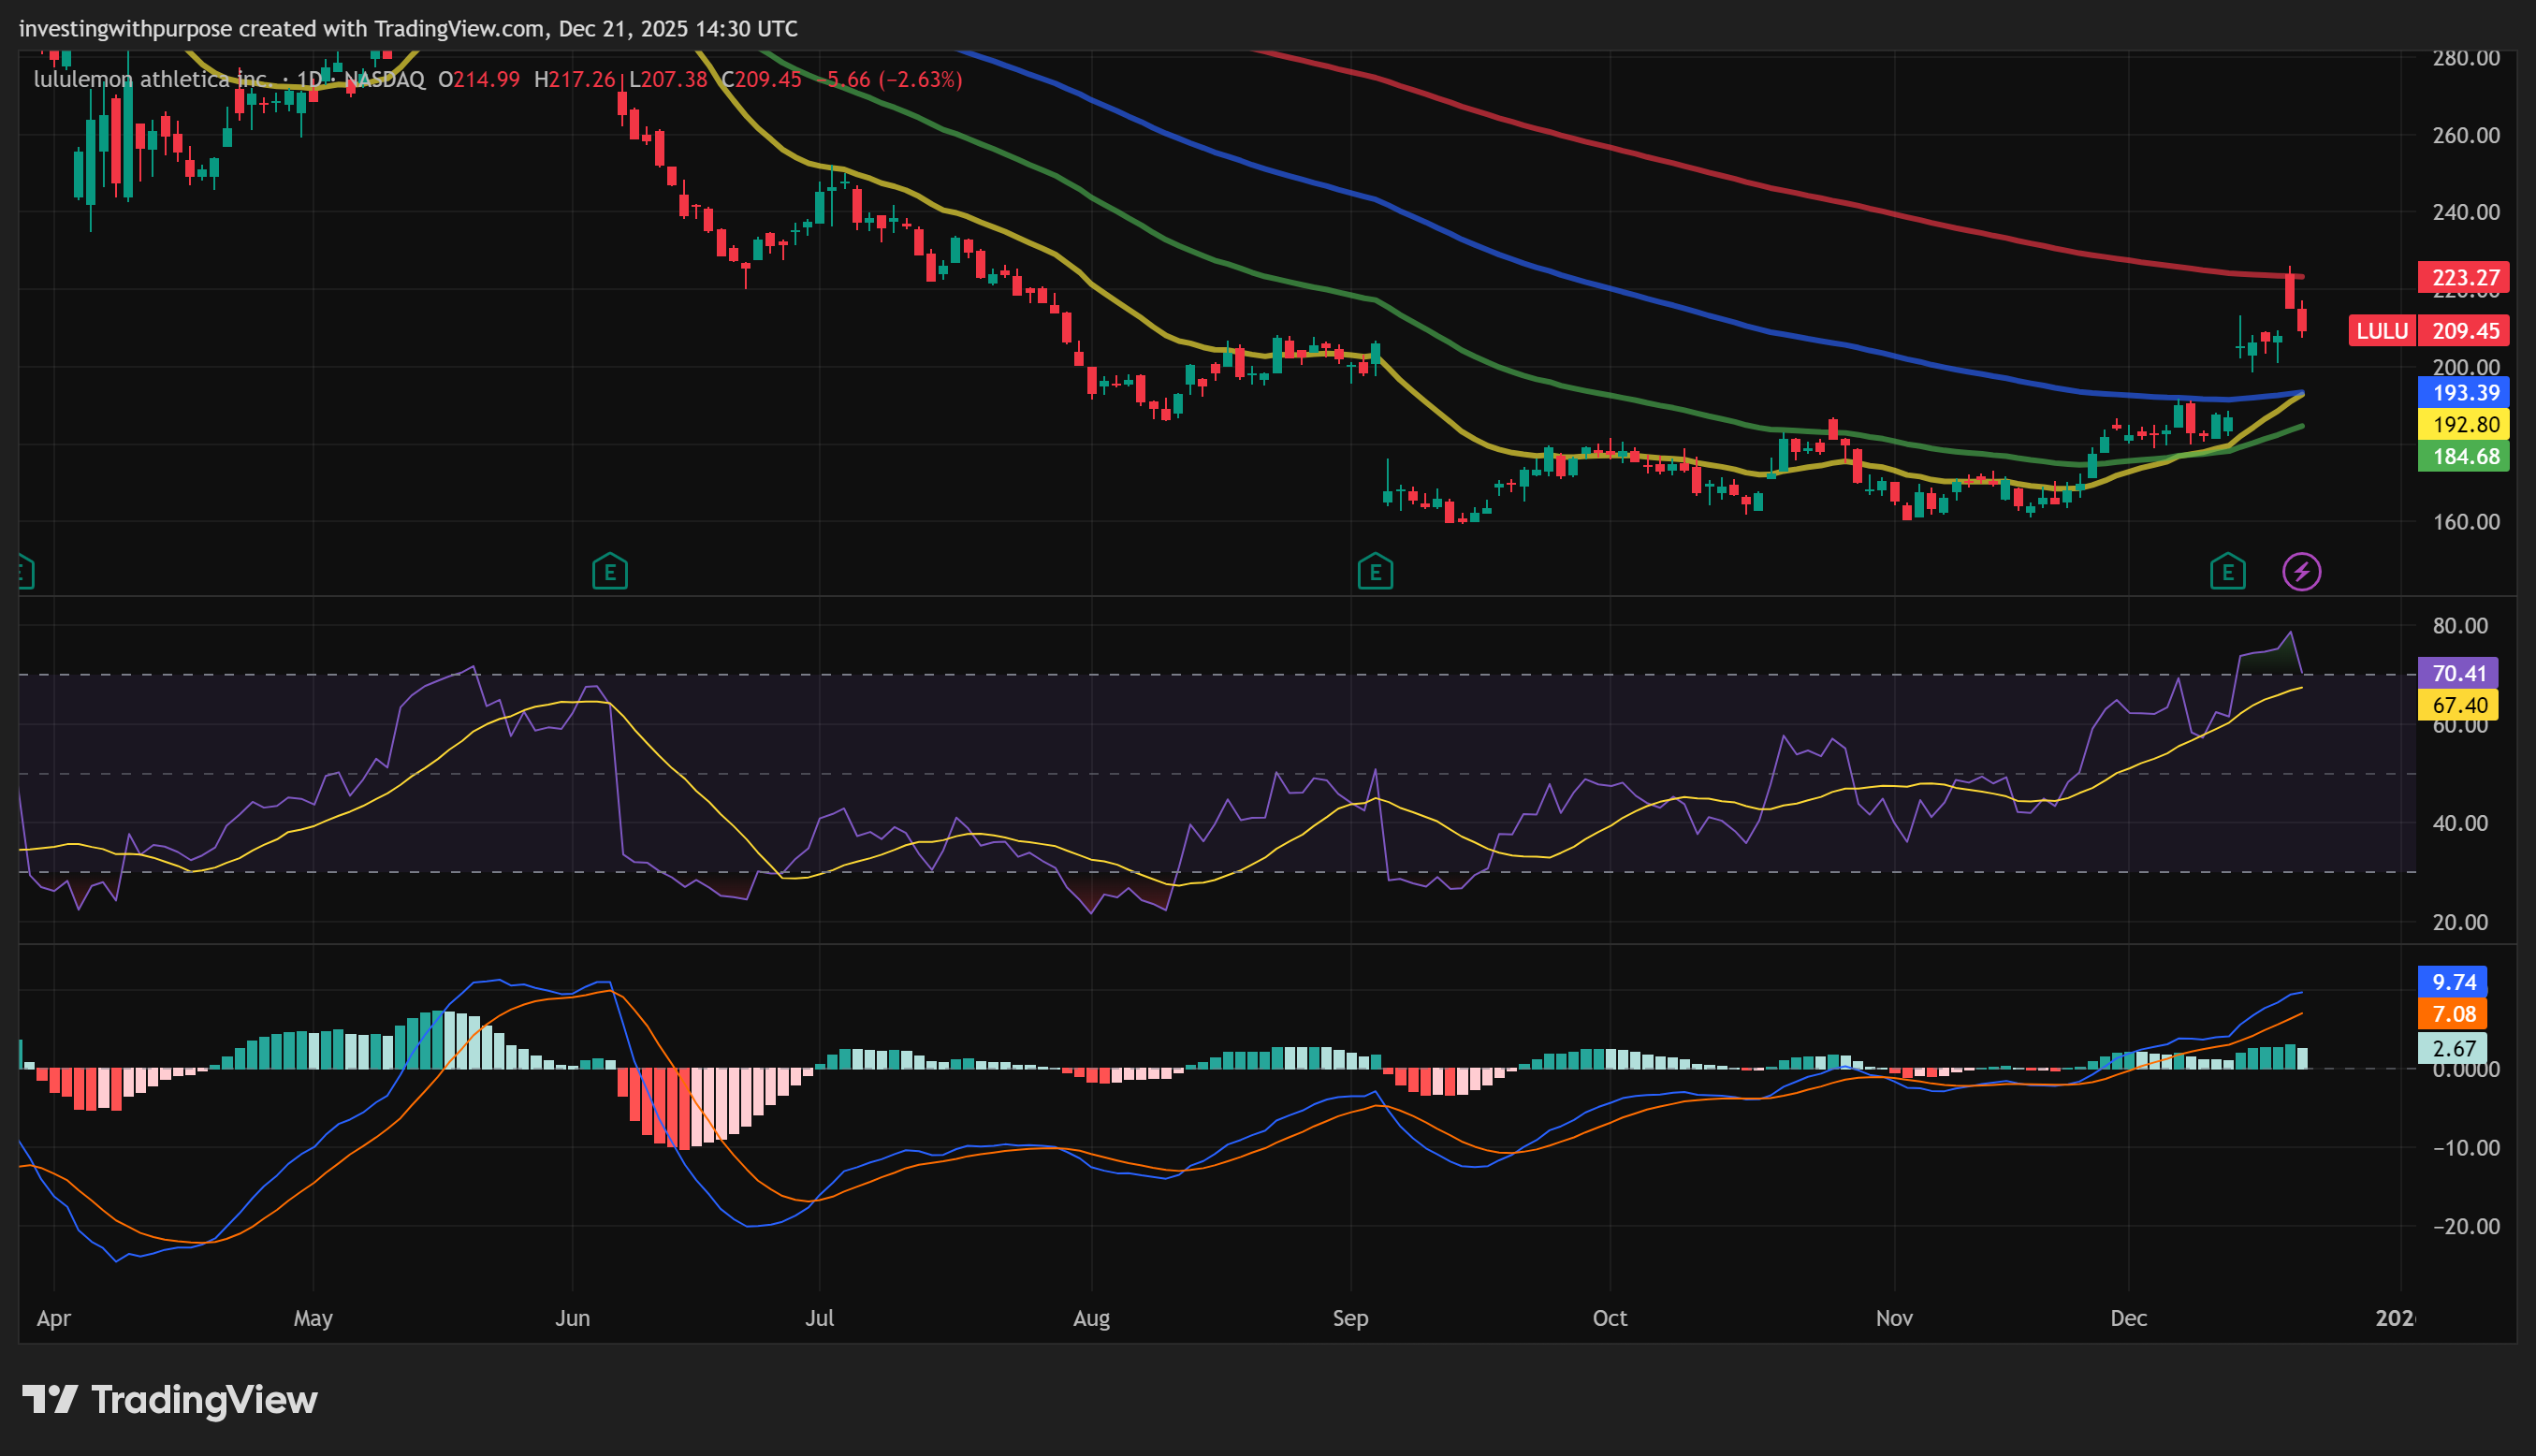
Momentum and trend strength
On the 4 hour view, RSI pushed into the 70 area and is now cooling. That is healthy if price holds above support because it resets momentum without breaking structure.
MACD is positive and elevated, which fits a trend phase but also warns that pullbacks can be fast when the market decides to take profits.
ADX is in the high 20s to low 30s on some views, suggesting trend strength is real, not just noise.
Key decision levels
The cleanest map is the fib ladder off the recent swing:
213.1 is the recent swing high reference. It is the first level bulls need to reclaim if they want another push up.
200.8 is the 0.236 retracement zone. This is a first line of defense for a shallow pullback.
193.2 to 193.5 is a deeper support cluster and lines up closely with the daily EMA 20 area and prior structure.
180.9 is the 0.618 zone, and this is where “healthy pullback” starts turning into “trend risk.”
Bigger picture ceiling
The weekly retracement map highlights why the stock may hesitate as it rises:
223.8 is a major weekly level. It is a natural medium term target and also a likely supply zone.
268.3 and 295.8 are higher weekly levels, but those are longer runway objectives that require a full trend maturation.
Cycle read
Lululemon looks like an early to mid stage trend rebuild, not a late cycle blow off. The post earnings spike was the ignition. The pullback is the test. If it holds above the 193 to 201 zone, it keeps the higher low sequence alive.
Trend is rebuilding. The highest quality entry is likely not chasing 209. It is letting price come into support and then prove demand is still there.
Simple trade plan
Lululemon
