Nike Inc. (NKE) - The Sportswear Giant
Oversold, misunderstood, and sitting on support. Nike’s moment of truth.

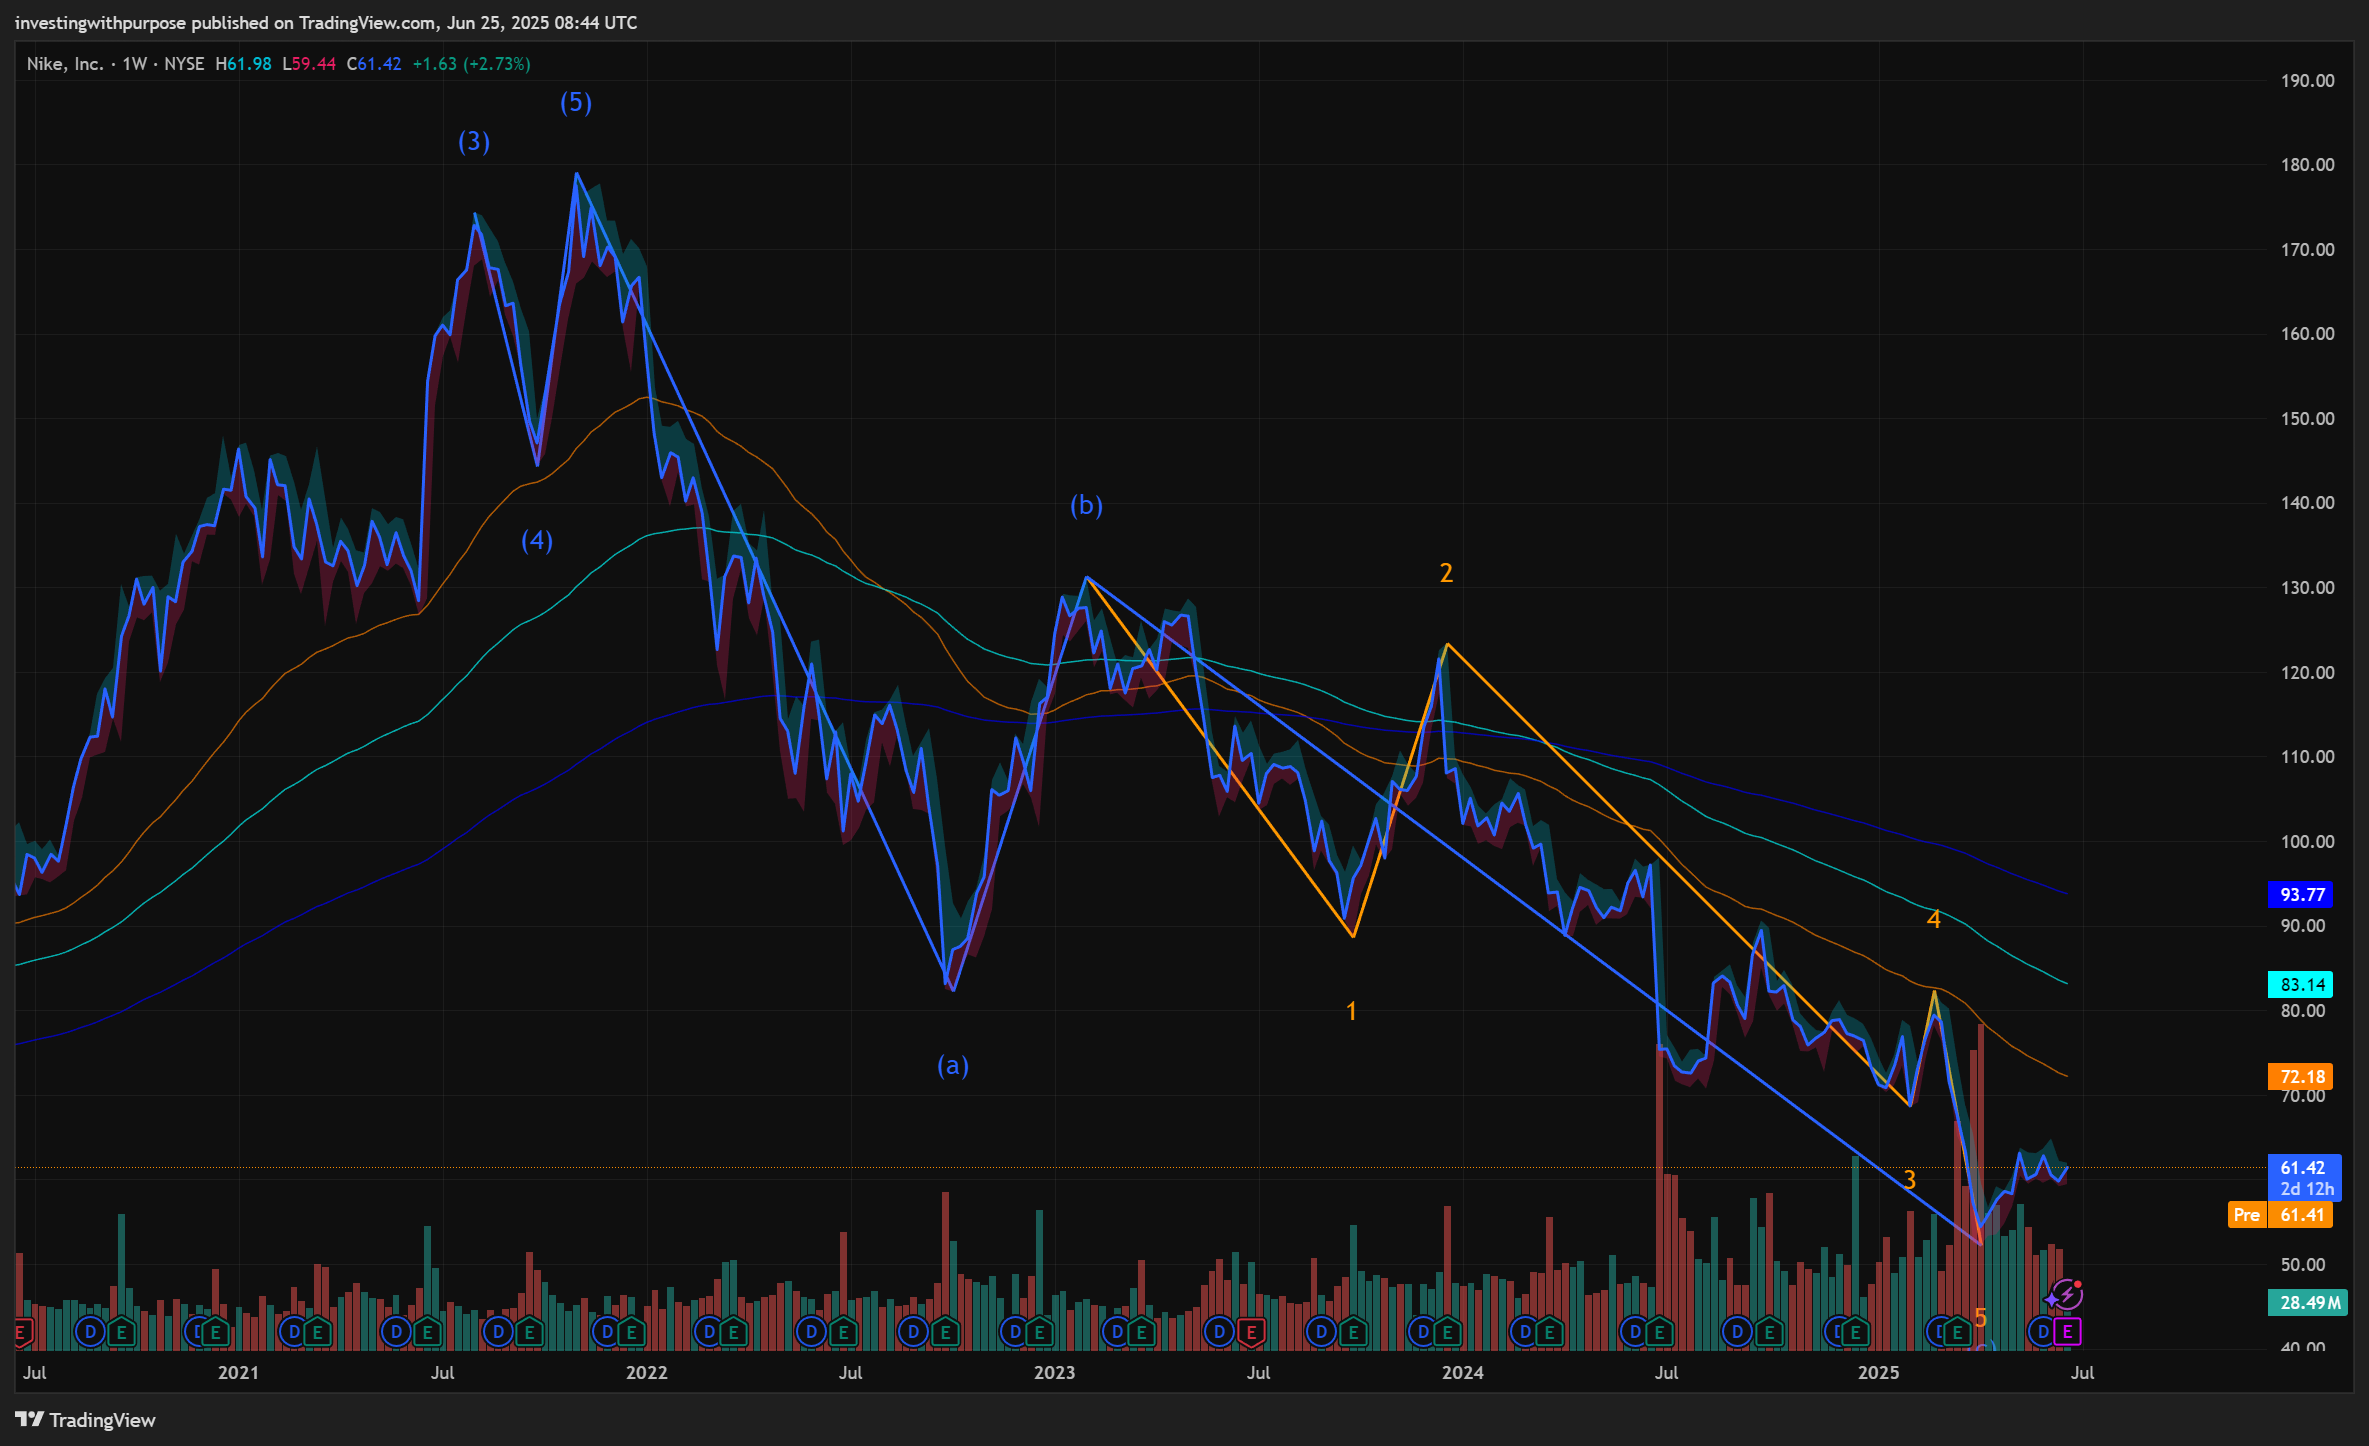
NKE 0.00%↑ reports this week. Bounced off 59.19 with a clean MACD cross and rising RSI. But this still looks like a wave (b) relief move inside a larger corrective structure. Big move coming. Earnings will choose the direction.
China sales are falling. Tariffs are back in play. Guidance could disappoint. But sentiment is wrecked and valuation is dirt cheap. Low bar + small beat = explosive move.
If NKE reclaims 64.01 post-earnings, it’s a long. Add above 66.93. Trim at 68.35, ride to 74.01 on strength. Stop under 59.19. No breakout, no trade. Let price lead. Here's how to look at this..
TL;DR
Current Setup: Price bottomed at $59.19 - a textbook fib + Elliott Wave (C) low. Bounce underway, but confirmation still needed.
Key Bull Thesis:
Technicals: Weekly MACD histogram just flipped positive. Daily RSI rising. Price consolidating under major resistance at $64.85.
Fundamentals: EPS down ~45% YoY, but margins remain resilient. Long-term P/E (~17× on 2028 EPS) suggests deep mispricing. Sentiment is washed out.
Catalysts: Earnings (June 27), tariff clarity, macro tailwinds (Fed pause/cuts), potential margin upside from DTC mix.
1. Fundamentals: Bad Optics, Strong Core
EPS & Valuation Reset
FY’25 EPS expected to fall ~45% YoY
But stock is already down ~36% from peak - most, and possibly all, of the pain is priced
Current forward P/E ~28× - expensive optically
But on 2028 EPS, $NKE trades at ~17× - historically cheap for a brand of this scale
Conclusion: Short-term optics are noisy. Long-term multiple suggests deep value.
Margins Holding Firm
Gross margin expected to fall from 44% → 42%
Decline is driven by volume, not pricing pressure
DTC strength and pricing power still intact
Conclusion: This isn’t a margin collapse - just a sales cycle compression.
Macro Headwinds Are Known
China sales are declining and expected to stay weak
Tariffs may weigh on investor sentiment, but impact is manageable
FX risk is real - but Nike has hedging and pricing levers
Conclusion: Headwinds are real, but already reflected in sentiment and price.
2. Technical Analysis: Multi-Frame Bottoming Structure
Weekly Chart: Base Formation
$59.19 marked the 1.0 fib extension of the wave (A)–(B) correction - classic wave (C) behavior
RSI (14) bounced from ~30 with bullish divergence
MACD histogram flipped green - early signal of reversal
Weekly EMA ribbon is flattening - first sign of longer-term stabilization
Implication: Weekly structure supports durable base-building and risk-defined entries.
Daily Chart: Trend Inflection Zone
Price stalled at $63.64 - near the 0.786 retracement of the prior downtrend
Still trading below $64.85 - critical breakdown level from early May
Daily MACD is rising toward zero, RSI climbing past 45
A clean close above $64.85 sets up a run toward $68.35, then $74.01
Implication: This is where the trend flips - but only on confirmation.
Intraday (2-Hour): Breakout Coiling
Price currently hovering below $64.01 Ichimoku cloud resistance
MACD crossed bullish; RSI holding above 50
Short-term structure suggests wave (b) may be ending
Implication: Clean breakout above $64.01 on earnings = early entry window. Below $61.25 = still unconfirmed.
3. Trade Plan: Phase-Based Execution
Phase 1 – Base Entry:
Enter between $59.50–$61.25 (wave (C) fib zone)
Stop under $58.80
Position size: 30% of full allocation
Phase 2 – Breakout Confirmation:
Add above $64.85 on MACD > 0 and RSI > 50
Target $68.35, then trail toward $74.01
Stop tightened to $61.25
Position size: 40% of allocation
Phase 3 – Trend Continuation:
Add remaining 30% on weekly close > $74.01
Long-term target: $114 (1.618× Fib extension from weekly wave structure)
Use trailing stop under weekly 50-SMA
Implication: Risk-defined, staged exposure into a macro reversal.
4. Macro & Catalyst Map
June 27 – Q4 Earnings: guidance clarity and margin commentary could spark re-rate
July 10 – CPI print: inflation slowing supports discretionary rotation
July 30 – FOMC Meeting: dovish tone or rate-cut hint = upside for consumer names
Q3 2025 – Margin updates from DTC push; potential stock buyback headlines
Ongoing – U.S.–China tariff talks: clarity or de-escalation could flip the sentiment switch
Bottom Line
$NKE is still one of the world’s most powerful brands.
But the market is pricing it like a broken story.
The chart disagrees.
With technicals stabilizing, valuation resetting, and sentiment wiped out - this is the kind of asymmetric setup worth watching.
Wait for confirmation.
Then ride the turn.