


Nvidia closed at $223.47 on 2026-05-20, then reported Q1 results after the bell. What didn’t happen is the story. A record beat, a guide well ahead of the Street, a 25-fold dividend hike, and the stock barely moved, hovering near its pre-print close in the hours around the report rather than gapping either way.
That non-reaction is the part worth sitting with. Revenue came in at a record $81.6B, up 85% YoY, with data center alone at $75.2B. Management guided the next quarter to $91.0B, well above the $86.8B Wall Street was modeling. The board lifted the dividend from $0.01 to $0.25 a share and authorized another $80.0B of buybacks.
By almost any standard it was a beat with a stronger guide, and the market’s first response was a yawn. When a company this size does everything right and the tape barely flinches, it’s telling you what’s already in the price.
Key Takeaways
The quarter was a record on every line. Revenue $81.6B (up 85% YoY), data center $75.2B (up 92% from a year ago), GAAP operating income $53.5B at a 65.6% operating margin. This wasn’t a beat-and-trim, it was a beat-and-raise.
The guide is the real headline. Management sees $91.0B next quarter, roughly 11% above the quarter just reported and above the $86.8B consensus, and it assumes zero data center compute revenue from China. Demand isn’t the question.
Capital returns shifted gears. The dividend went up 25-fold ($0.01 to $0.25) and the board added $80.0B to the buyback on top of $38.5B already left. Nvidia returned about $20B to holders in the quarter alone.
Mind the GAAP headline. GAAP net income of $58.3B and $2.39 of GAAP EPS were inflated by a $15.9B gain on investments. The number to underwrite is non-GAAP EPS of $1.87, which still beat the $1.76 estimate. Treat the rest as a windfall, not run-rate.
One level frames the trade. $236.54 is the swing high set into the print. A daily close above it is a fresh breakout. Failure to reclaim it and a slip back to the $214 to $202 moving-average shelf is a healthy digestion of an extended run.
Here’s what the numbers actually say.
NVDA: The Operating Line Is Still Bending Upward
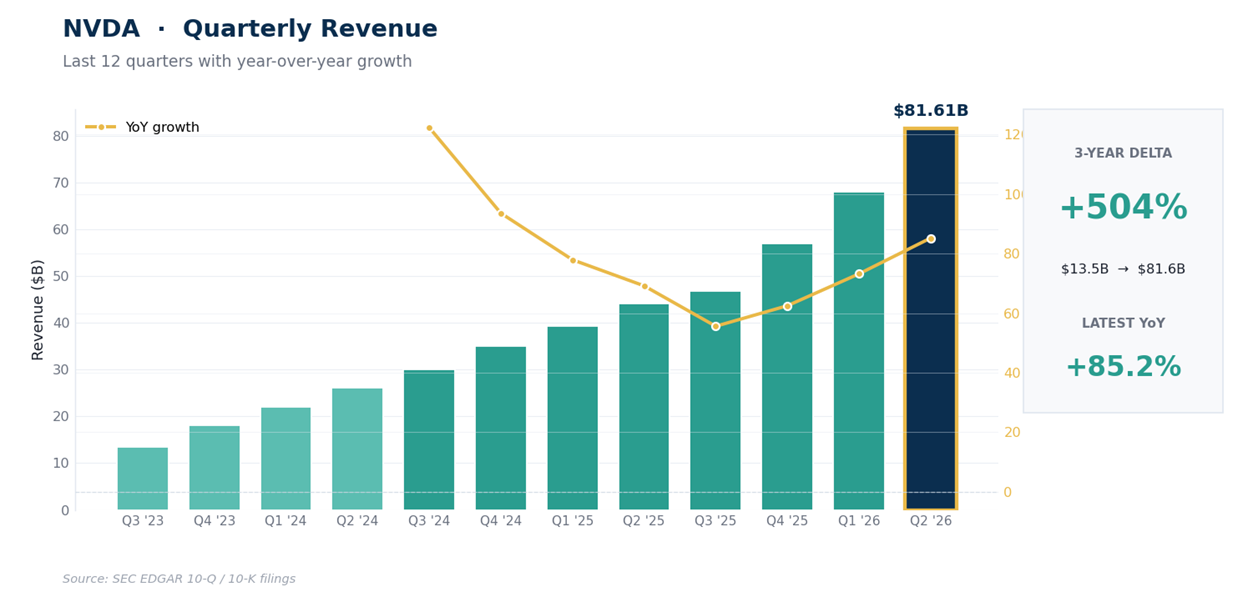
Nvidia’s last 12 quarters trace one of the steepest revenue ramps in corporate history. The top line went from $13.5B in the quarter ended July 2023 to $81.6B in the quarter ended April 2026, about 6x in under 3 years, and the last 3 prints alone read $57.0B, then $68.1B, then $81.6B.
The latest quarter put up revenue of $81.6B (up 85% YoY reported), GAAP operating income of $53.5B, and GAAP diluted EPS of $2.39. The margin stack is back near the highs: GAAP gross margin 74.9%, up from 60.5% a year ago when China H20 charges dragged it down, and operating margin 65.6%.
One caveat matters here. GAAP net income of $58.3B and the $2.39 of GAAP EPS sit well above the operating line because of a $15.9B gain on equity securities, a markup on Nvidia’s investment stakes rather than anything it sold to customers.
The figure to underwrite is non-GAAP EPS of $1.87, up from $0.78 a year ago, which strips the investment noise out. Data center did $75.2B of the $81.6B, and within it networking grew 199% from a year ago as Nvidia increasingly sells whole systems instead of loose chips.
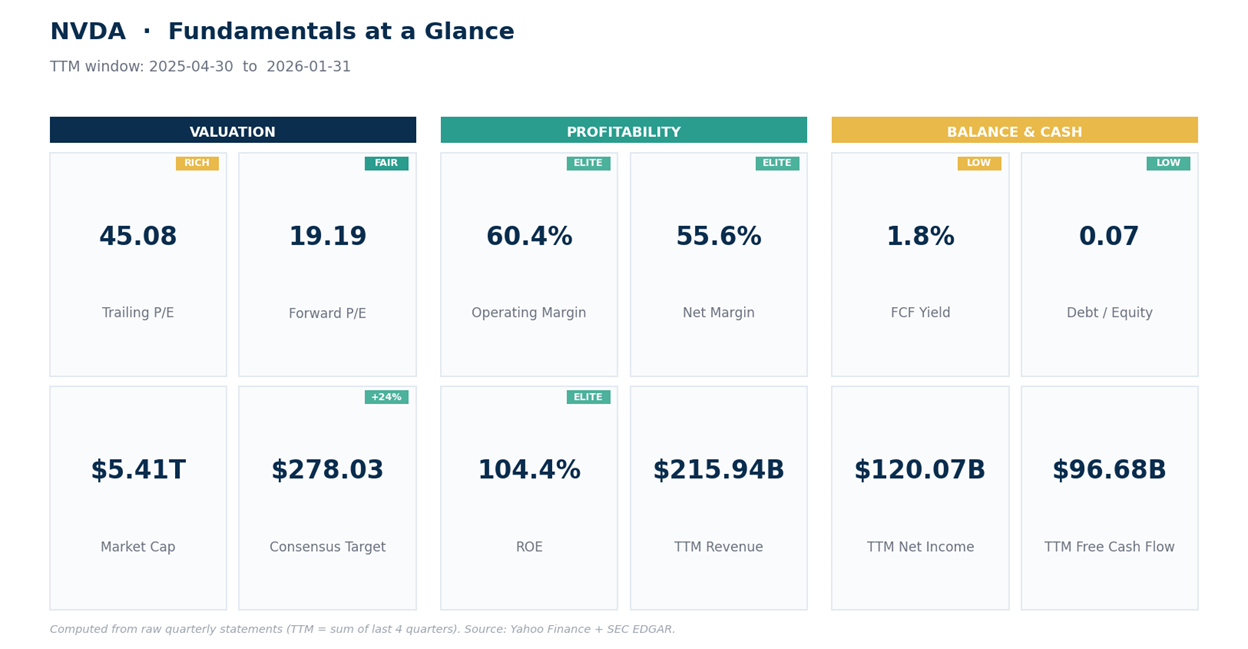
The balance sheet is why the capital-return news lands. Trailing revenue is now about $253.5B, and free cash flow was $48.6B in this quarter alone.
Nvidia holds roughly $80.5B of cash and marketable securities against about $8.5B of debt, with stockholders’ equity of $195.5B and trailing return on equity above 100%.
On valuation, the stock trades near 21x trailing sales and, on the engine’s read, about 19x forward earnings, and that forward number is the bull case in one line: a $5.4T company still growing the top line 85% while priced below the market’s slower-growing chip names.
Broadcom sits near 23x forward earnings and AMD near 35x, both expanding slower than this. The analyst desk is lopsided too, with a $278 mean target ($275 median, $400 high, $180 low) across 61 opinions, 58 of them buy or strong buy and a lone sell.
Beta is 2.24, so the shares move more than double the market on a typical day, which matters a lot for how big a position you carry.
The weekly trend is firmly up and a little hot. Last weekly close $223.47, with the weekly EMA20 at $195.40, EMA50 $179.01, EMA100 $153.95, and EMA200 $116.95 (EMA is the exponential moving average, a trend line that reacts faster than a plain average). Price sits far above all of them, which is the multi-year uptrend doing its thing. Weekly RSI is 67.1, a momentum gauge that runs 0 to 100 where above 70 reads hot, so it’s knocking on that door.
Weekly MACD line 10.23 holds above its signal at 6.13, with a +4.09 histogram that says upward momentum is still building (MACD tracks the gap between a fast and a slow trend average). The flag is the weekly Bollinger %B at 1.00, meaning price is riding the very top of its weekly volatility band, alongside weekly StochRSI near 98, an overbought reading on a faster, more sensitive cousin of RSI, and both say the run was stretched going into the print.
Weekly ADX is 22 with +DI 29 over -DI 11 (ADX measures how strong a trend is, and the DI pair compares buyers against sellers), so buyers are clearly in front without the reading being at an extreme.
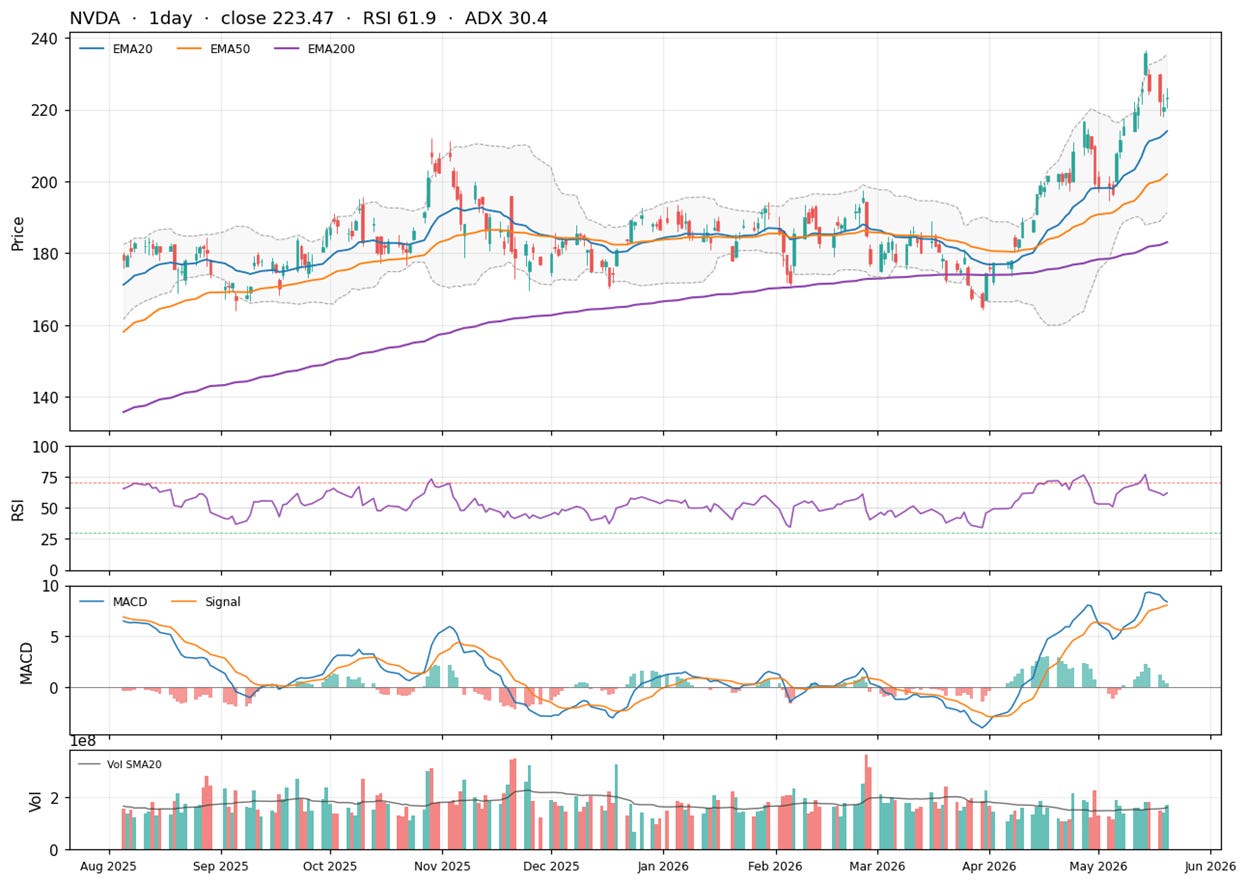
The daily tells an orderly story. Close $223.47 sits above all 4 daily EMAs in textbook order (EMA20 $214.03, EMA50 $202.01, EMA100 $193.83, EMA200 $183.08), the stacking that defines an intact uptrend. Daily RSI 61.9 is firm without being overbought.
The daily MACD line 8.38 holds just above its signal at 8.05 with a small positive histogram. Daily ADX 30.4 says a genuine trend is in force, and +DI 30 over -DI 17 keeps buyers ahead. ATR is $7.56, so a normal session swings about $7.50, which is what you use to set a sane stop distance. Resistance is the $236.54 swing high, then the $240 round number, and a reclaim of those opens air above.
Support steps down through the EMA20 at $214, the $209 retracement, then the heavy shelf at $202 to $200 where the EMA50 and the round number sit together, with the lower Bollinger band and EMA100 near $192 below that. Worth noting that the April-to-May run lifted price from the low $160s to $236, so a lot of this band is recent and untested as support.
Net read: the business is accelerating and the trend is up, but the stock walked into the print extended on the weekly band and right under its swing high, which is exactly the condition that tends to mute the immediate move no matter how strong the print. $236.54 is the line that separates a fresh breakout from a digestion. A pullback into the $214 to $202 moving-average shelf would be normal, and arguably healthier, than another vertical leg. The next print is Wednesday 2026-08-26, 97 days out, so there’s room to let the setup come to you rather than chase the open.
Here’s how to act on it.
