
Oracle After the Reset: Opportunity or Trap?
A deep reset, big ambitions, and the levels that decide what comes next

Oracle ORCL 0.00%↑ is back on the desk, and it is not because the business “broke.” It is because the stock has been doing what stocks do when expectations get too hot, too fast.
Since our last ORCL write-up, the conversation in the comments and inbox has been loud and clear: people are not looking for hype. They want a clean read on what changed, what did not, and what price is really saying right now. That is exactly what this update is.
ORCL is trading around 178, 50% off the prior highs, and the chart is no longer acting like a calm uptrend with dips. It is acting like a name that is being repriced, with rallies sold and support being tested.

Key takeaways
Oracle is still a strong business. Large cloud and AI contracts, growing backlog, and global buildout support the long-term story.
The stock has already gone through a deep reset. Expectations were too high, spending is front-loaded, and the market repriced the risk.
This is no longer a momentum name. It is in a prove-it phase where execution matters more than vision.
Near-term, ORCL is a trading stock. Support at 177 and 170 to 167 can produce bounces, but those moves are reactions, not trend changes.
From an investment view, patience matters. Real confidence only returns if price holds 167 and starts reclaiming 190.
A sustained move above 200 to 201 is the signal that the chart is repairing and the market is willing to reward the business again.
Until then, trade levels, manage risk tightly, and let price earn back trust.
Business updates since our last post
No new earnings since our last write-up, so this update is about what is shaping the future before it shows up in the numbers.
The deal that changed the conversation
Oracle disclosed a single cloud contract expected to be worth $30B per year, with revenue starting in FY2028.
This is real proof that OCI can win the biggest workloads in the world. But it also means the market is focused on one thing right now: how much Oracle has to spend today before that revenue shows up.
Big deal, yes. Near-term patience required, also yes.
AI buildout is now part of the stock
Oracle is tied to large AI data center expansion plans, with spending that runs into the hundreds of billions over time across the ecosystem.
Oracle is leaning into infrastructure, not just software. That shifts how the stock trades.
If investors see long-term profit machines, the multiple holds.
If they see heavy spend with delayed payoff, the stock compresses.
Right now, the market is leaning cautious.

Debt headlines matter more than usual
Oracle raised about $18B in bonds in 2025, and a bondholder lawsuit brought funding and disclosure into the spotlight.
Even without new earnings, debt and funding stories can pressure the stock.
This is not about the lawsuit outcome. It is about perception and cost of capital.
When funding becomes part of the narrative, stocks usually reprice first.
Demand is not the issue
Oracle denied reports of AI data center delays and continues to expand capacity, including $2B in Germany and $1B in the Netherlands.
They are not pulling back. They are building because demand is there.
The risk is not demand. The risk is timing and execution.
Oracle’s cloud footprint, extended through global regions and deep integration with Azure.

Oracle is doing bigger things than before. That is the opportunity.
The cost is higher spend, more scrutiny, and less room for mistakes.
The business story is still intact, but the market wants proof, not promises.
Technical setup: what price is actually telling us
Now let’s zoom out and listen to the chart. Price is doing a much better job than headlines at explaining where risk really sits.
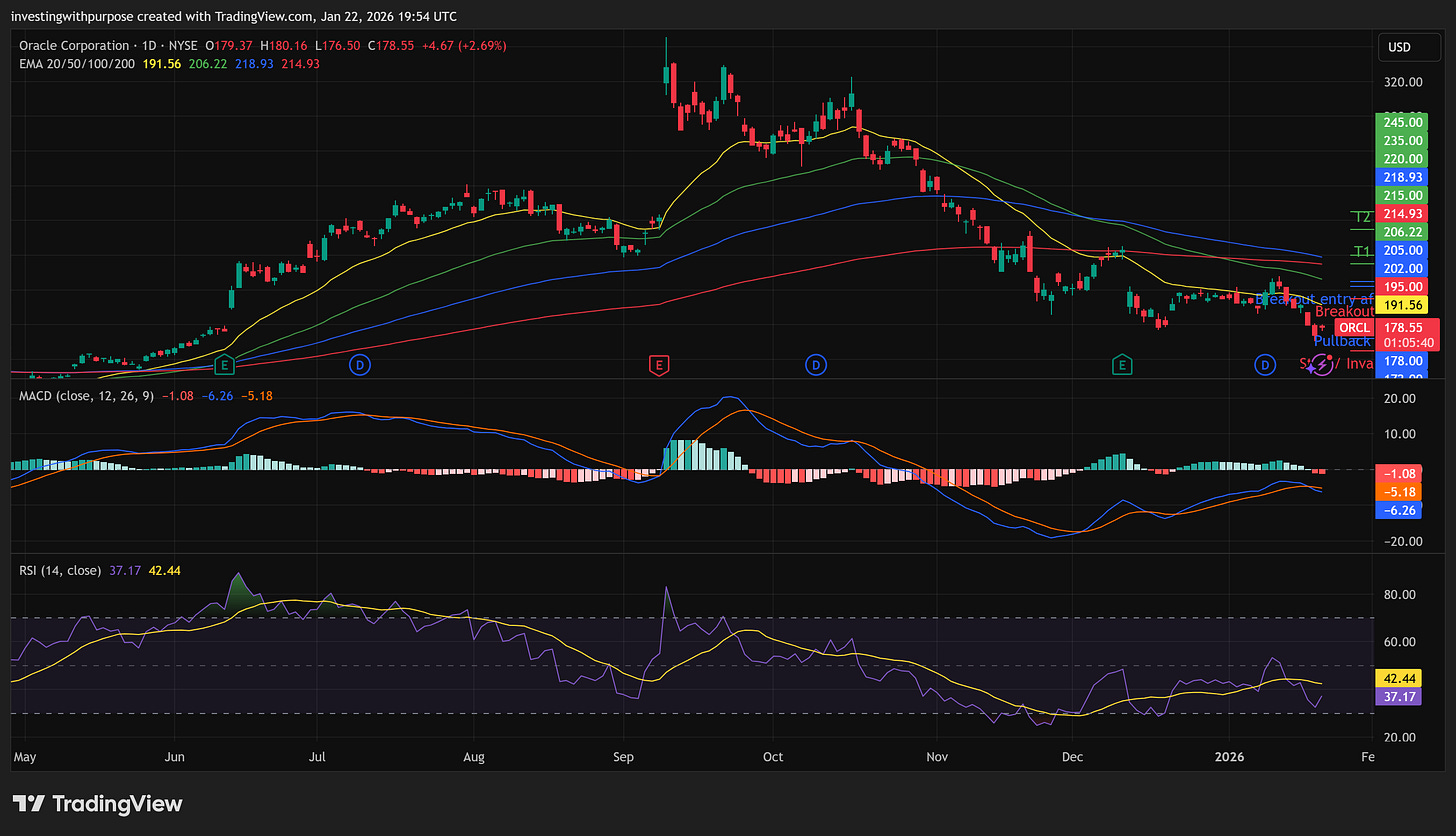
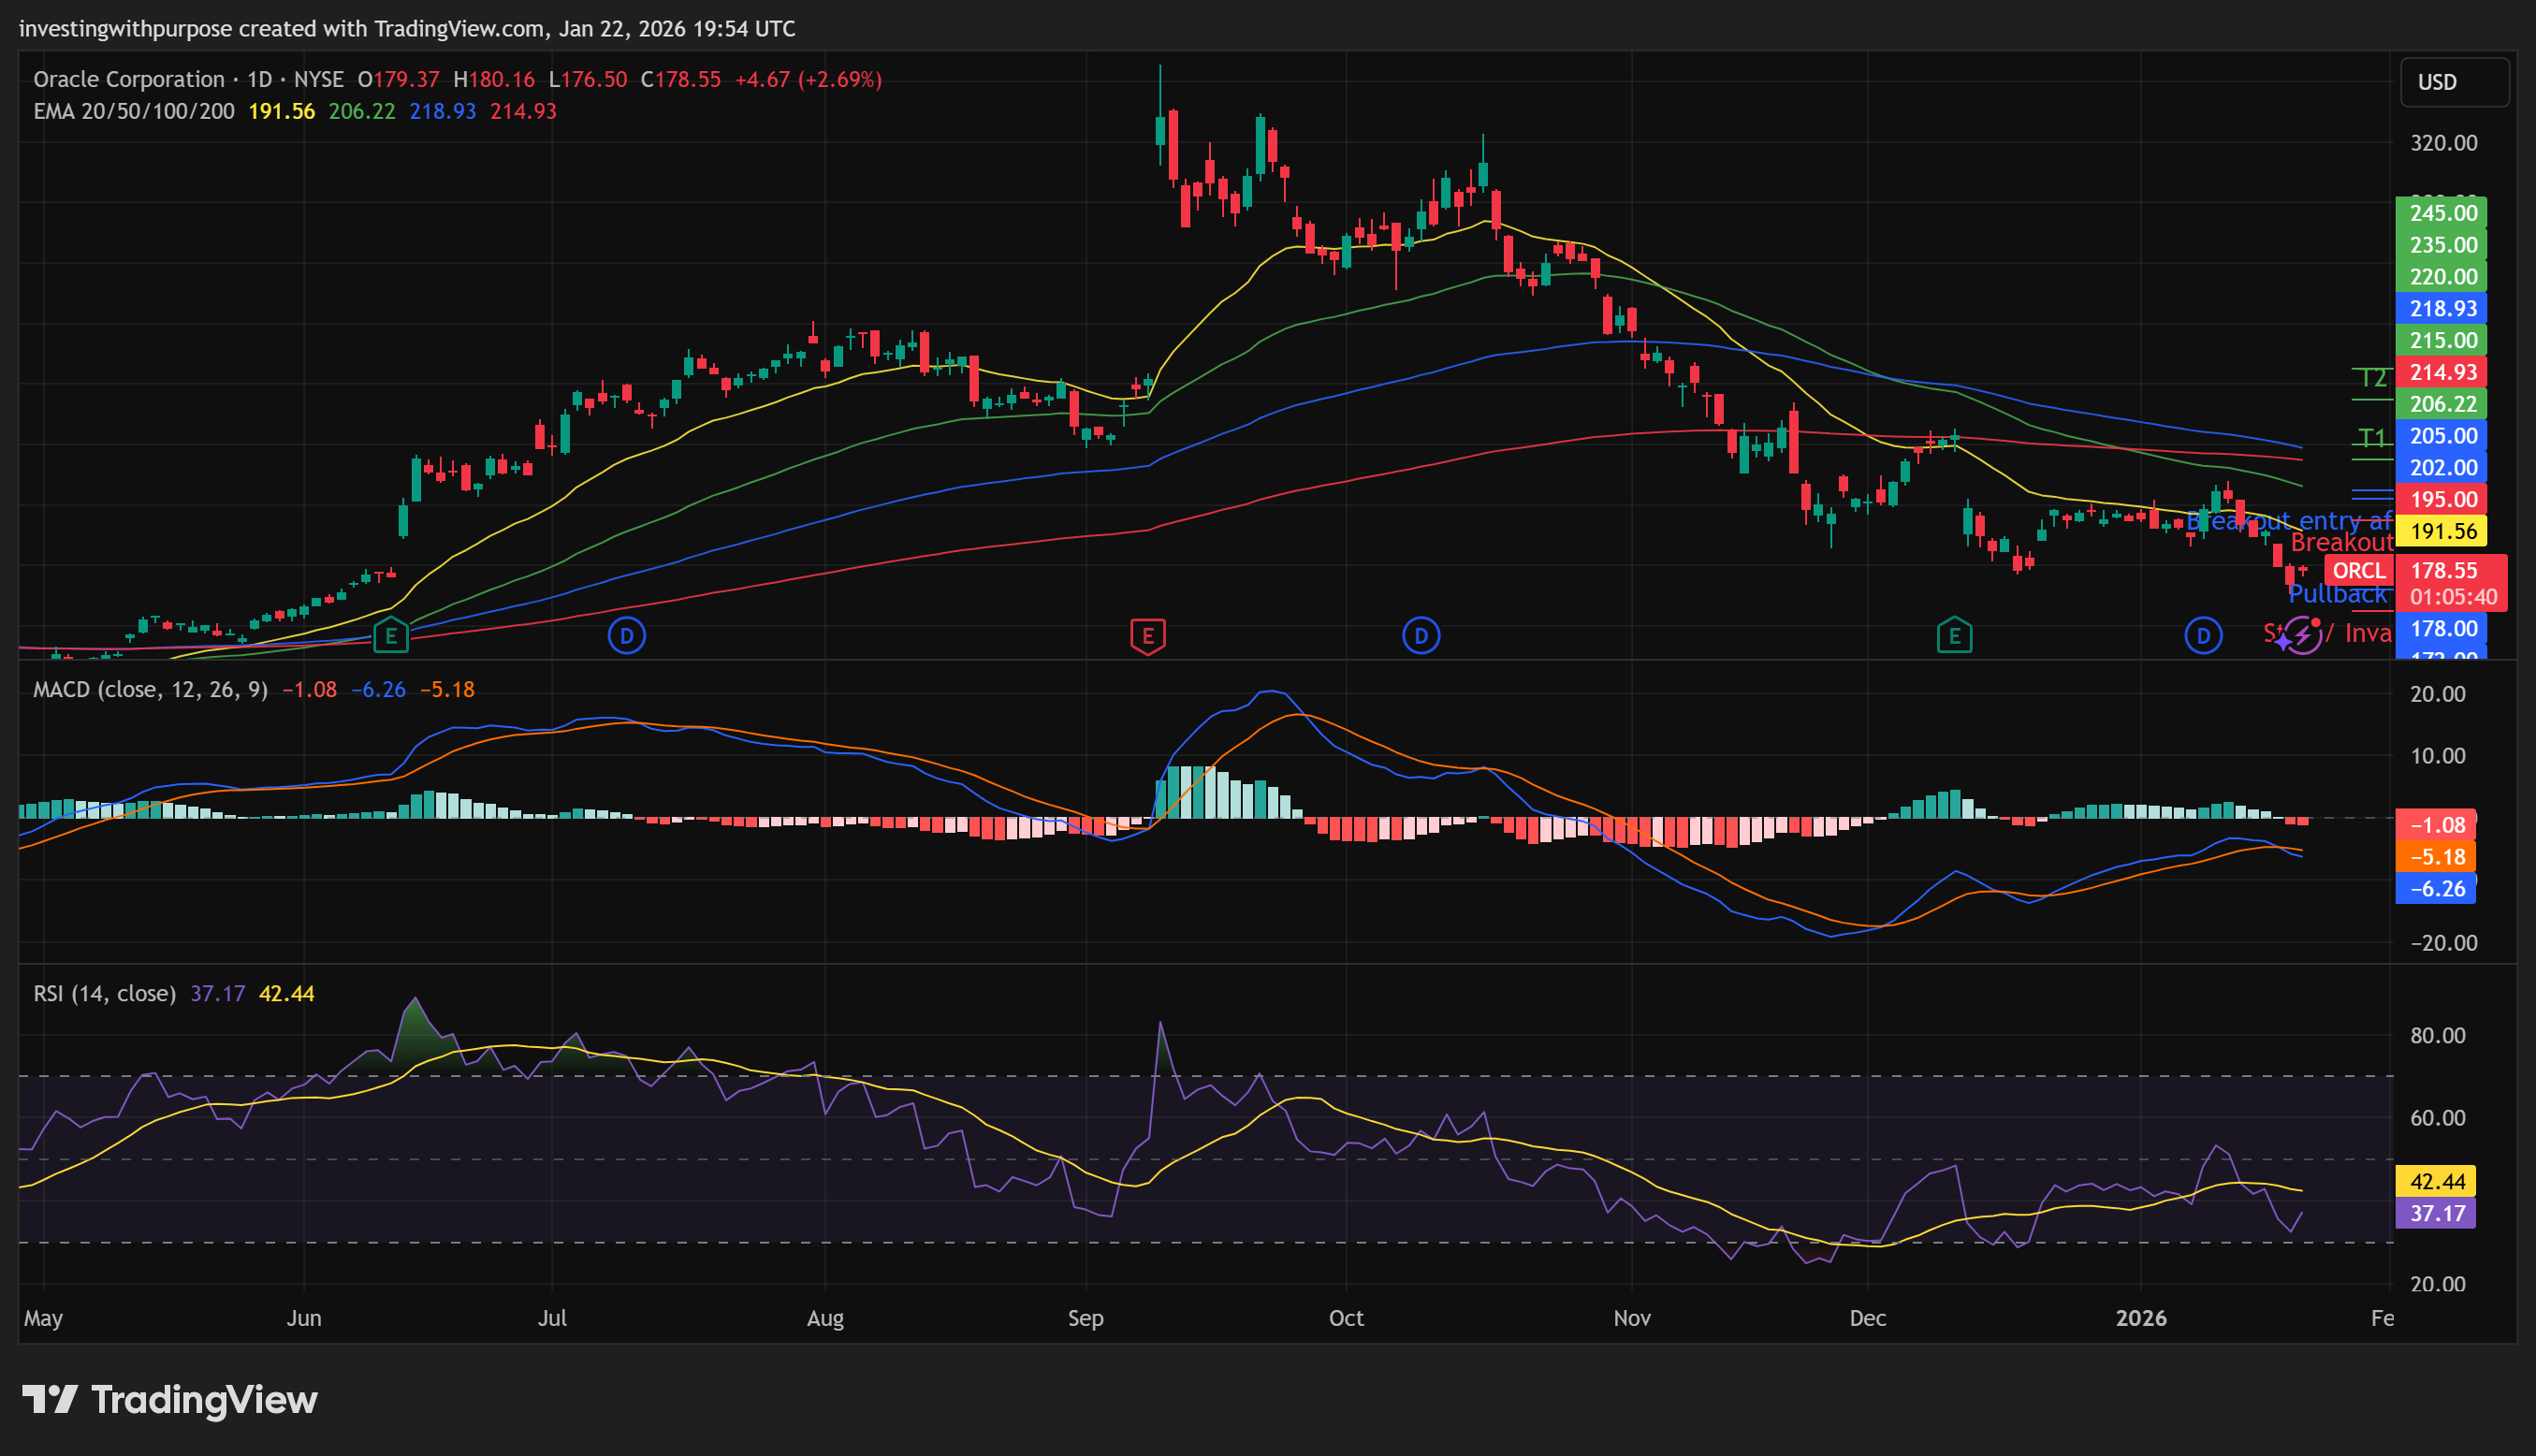
The trend changed, clearly
Since our last article, Oracle has not just pulled back. It has broken trend.
Price is now: Below the 20, 50, and 100 week moving averages
Still above the 200 week moving average around 150
That matters because it tells us this is no longer a smooth uptrend. This is a reset phase inside a longer-term structure that is still alive, but under stress.
The stock lost momentum first. Then it lost support. Now it is searching for balance.
Why the 177 to 178 area matters
Current price is sitting near 177 to 178, and this zone is not random.
It lines up with:
The lower daily Bollinger Band
A key Fibonacci level from the prior major move
A prior demand area where buyers stepped in before
When multiple tools point to the same price, it usually becomes a decision zone.
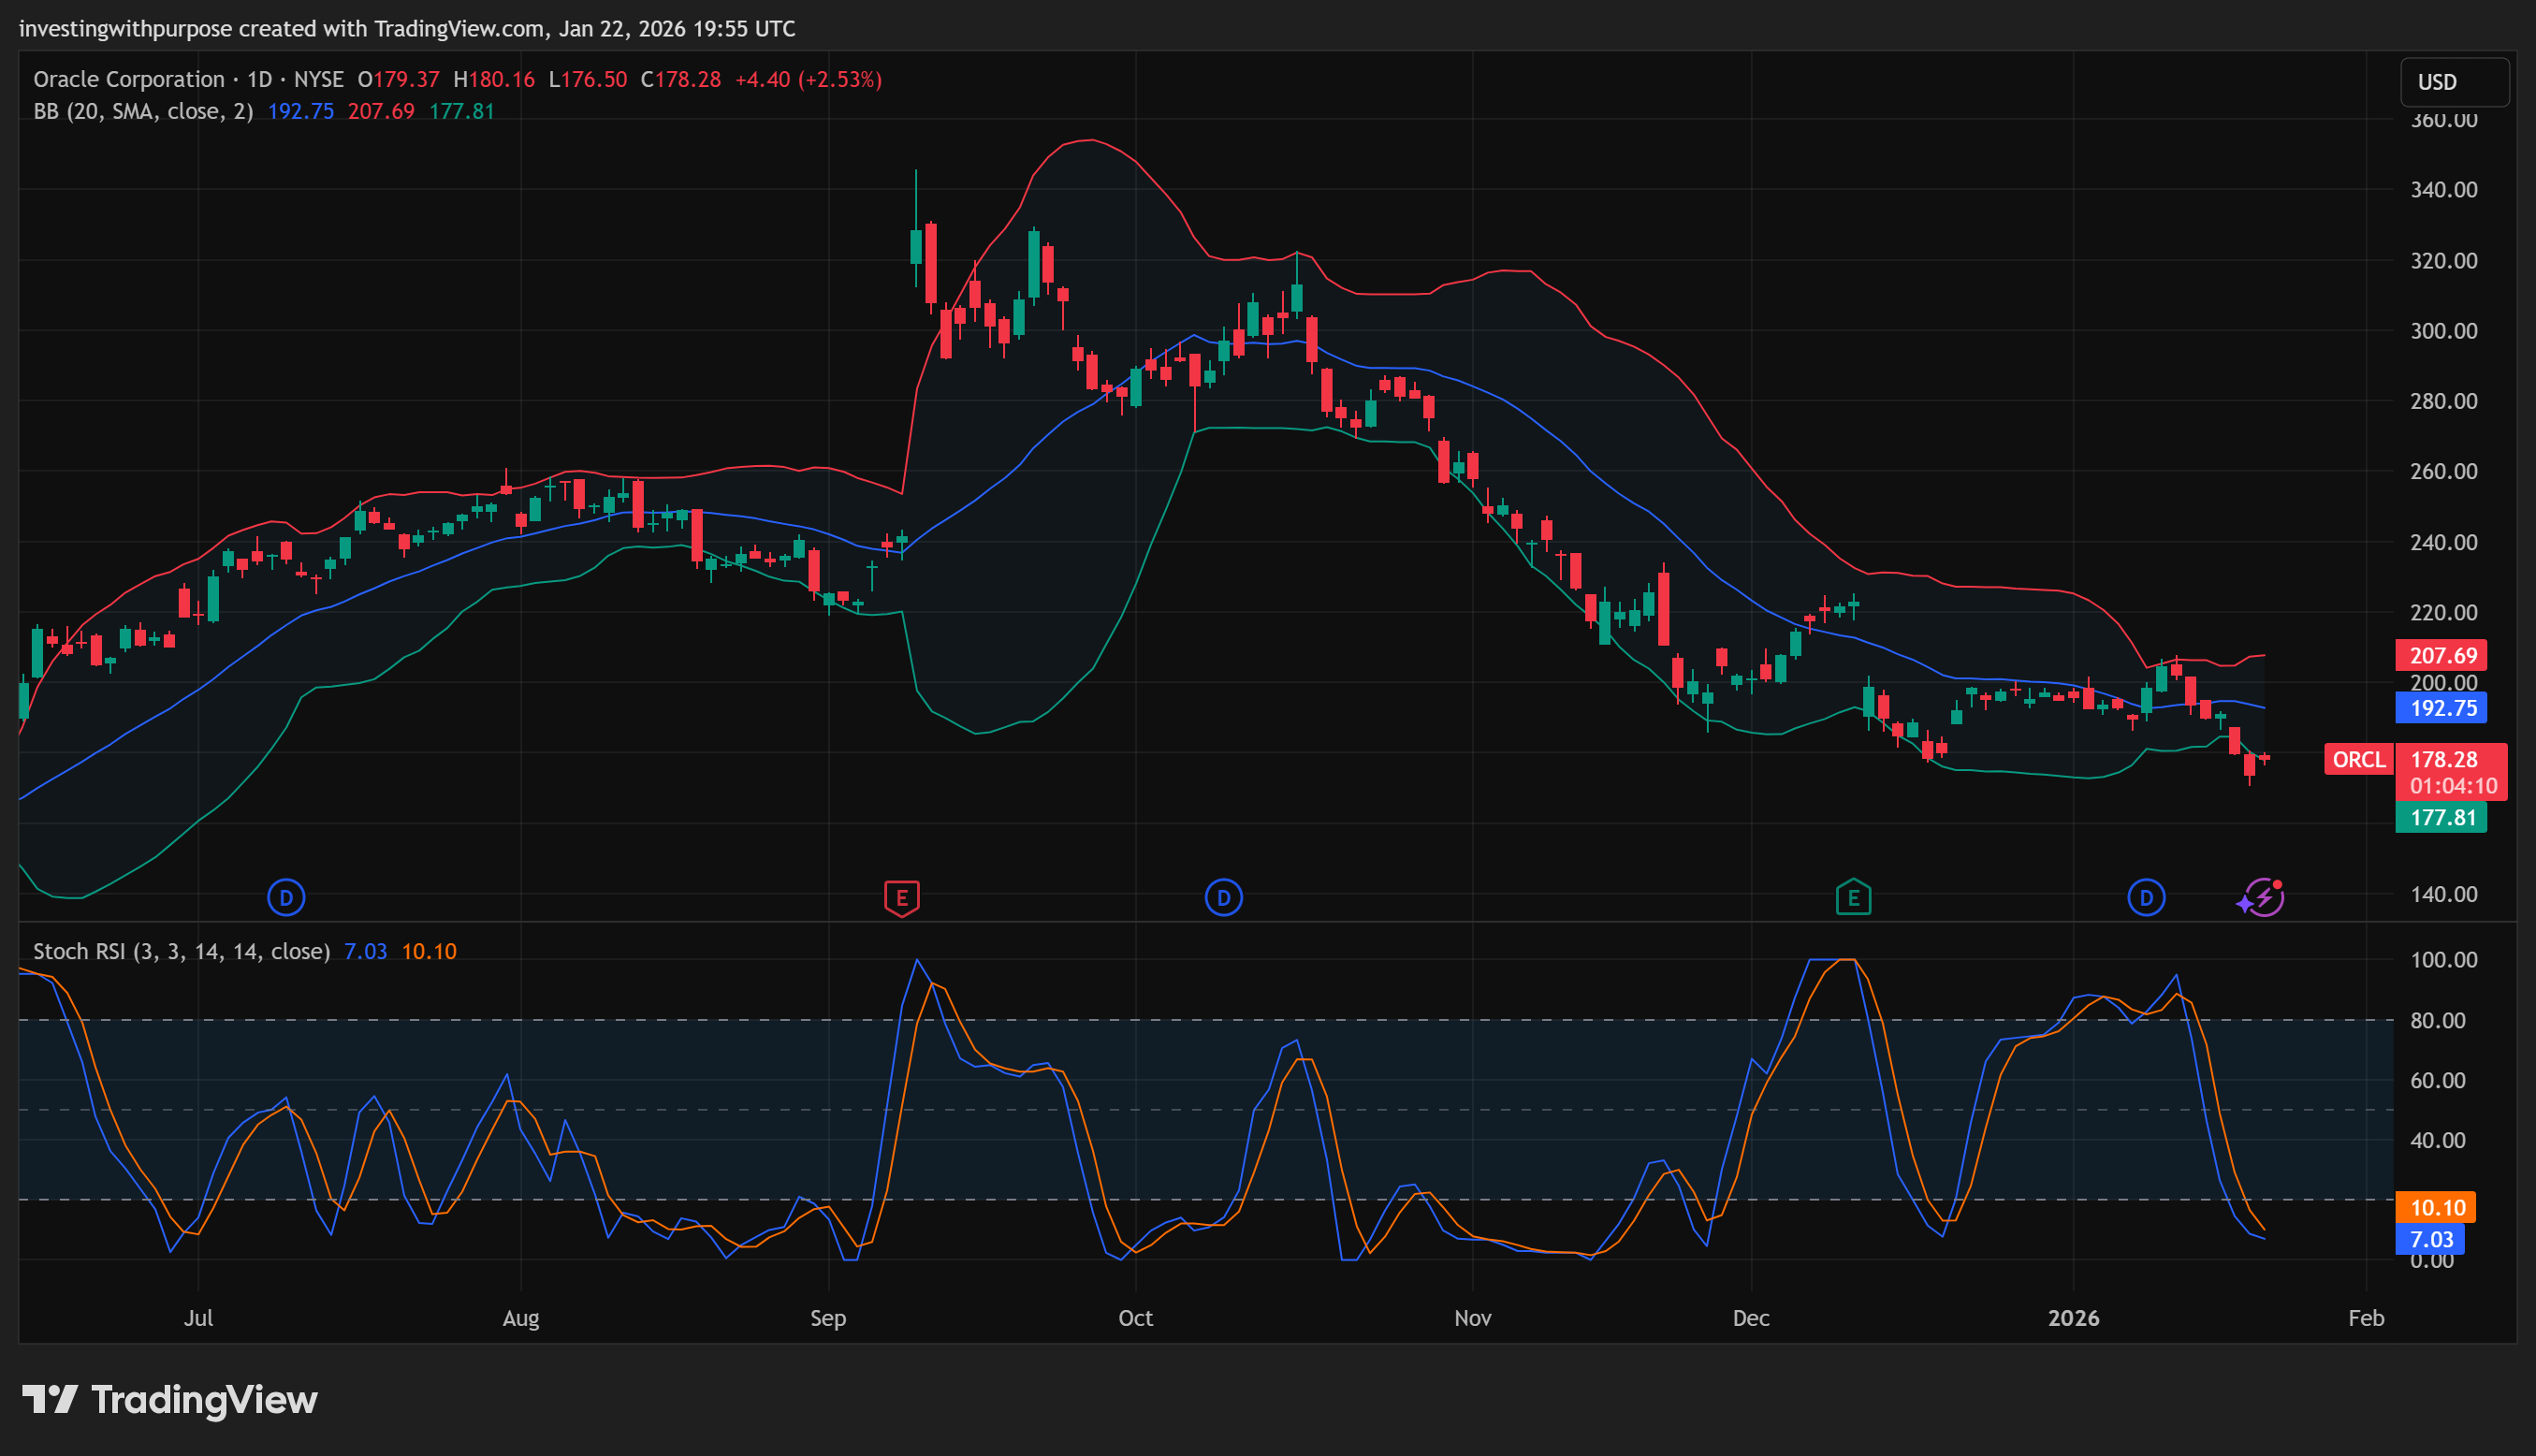
If this area holds, the stock can bounce because sellers are stretched.
If it fails, it tells us sellers are still in control and price needs to move lower to find real demand.
Momentum is weak, but not broken beyond repair
RSI on the daily and weekly sits near 36 to 38.
That is weak, but not panic.MACD on the weekly is still negative, which tells us downside pressure is not finished yet.
At the same time, short-term momentum is stretched enough that sharp rallies can happen even inside a downtrend.This is why chasing here is risky, but so is assuming the stock must fall straight down.
The next real downside test
If 177 does not hold, the chart opens up toward 170 to 167.
This zone matters because:
It lines up with multiple Fibonacci targets
It matches projected downside from the prior breakdown
It sits just above the long-term trend support zone
This is where longer-term buyers are more likely to show up, not because they love the story, but because risk becomes easier to define.
Below that, the big level is still 150, where the 200 week average sits. That is the line between a deep reset and something more serious.
Overhead levels that decide everything
On any bounce, resistance comes fast.
First test is 183 to 184. This is where prior support flipped into resistance.
Next is 188 to 190, where trend filters and prior supply sit.
Above that, 196 to 201 is the area that would start to repair the chart.
Until price can hold above those zones, rallies are reactions, not reversals.
The technical sum up
Oracle has already crashed. The market has removed optimism from the price.
Support is being tested seriously. Bounces can happen, but they are fragile. Proof is required before trust returns.
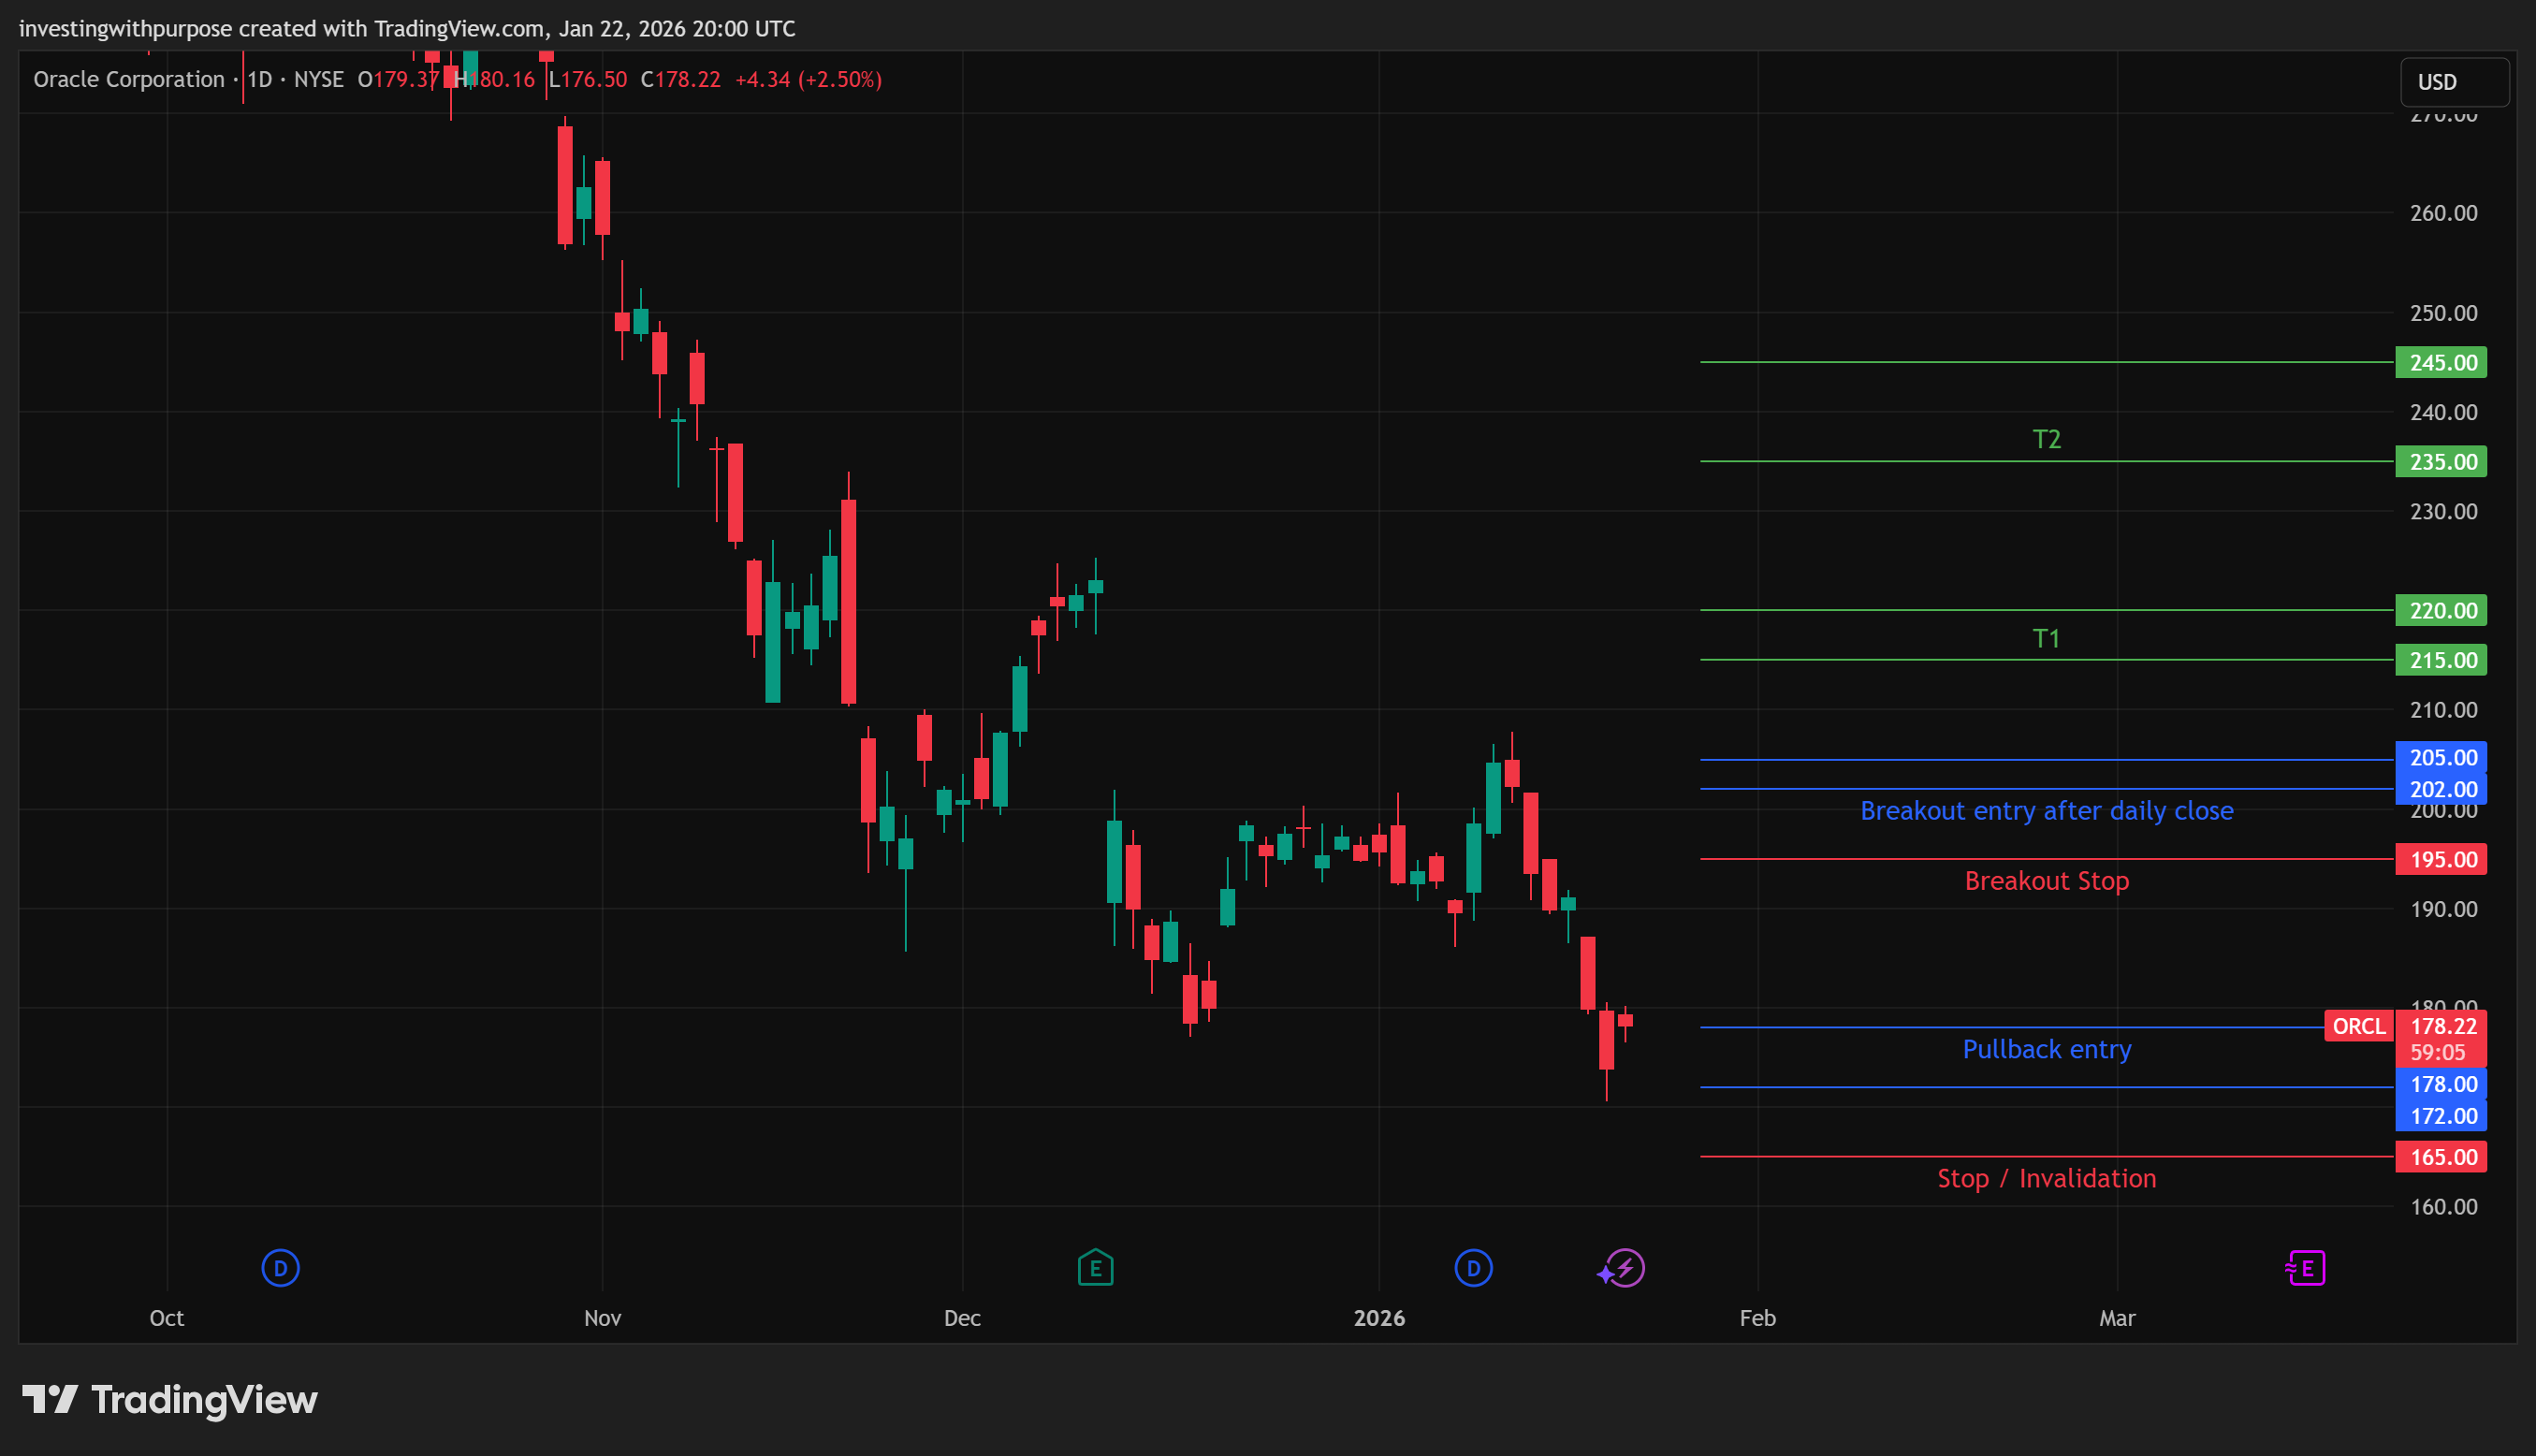
Our Trade Plans
Key levels: 201 (real breakout) | 190 (repair breakout) | 184 (short breakout) | 177 (near-term line) | 170–167 (major support) | 150 (last stand)
A- As existing holders
Hold thesis: valid while weekly closes stay above 167.
Risk action: if ORCL loses 167 and cannot reclaim within 1–2 weeks, assume next magnet is 150 and reduce exposure.
Trim zone: strength into 183–190 is a place to rebalance if you are overweight.
Confidence returns: only above 200–201 on a hold.
B- As traders (weeks to a few months)
Pullback entry A (tight risk): buy 177–178 only if it holds intraday and closes firm.
Stop / invalidation: daily close below 177 (or break + no quick reclaim).
Targets: 184 first, then 188–190. Take partials into those zones.
Pullback entry B (higher quality): buy 170–167 if price stabilizes.
Stop / invalidation: weekly close below 167.
Targets: 184, then 190, then 200–201 if momentum improves.
Breakout entry: daily close above 184 with follow-through.
Stop / invalidation: back below 183 on a daily close.
Targets: 188–190, then 196–201.
C- As investors (months to years)
Starter zone: scale in small between 170–178.
Hard invalidation: sustained break below 150 (structural failure).
Add on proof: add if ORCL reclaims 190 and holds for several sessions.
Add aggressively: only after reclaim and hold above 200–201 (trend repair becomes rebuild).
Upside targets: first big repair target 215–220, then reassess as structure improves.
The below chart lays out the entire ORCL playbook in one view. The stock is sitting on a well-defined support band around 170 to 175, which is why pullback entries are focused there with risk clearly capped below 165. Above that, the market is still treating rallies as trades, not trends. For upside to become durable, ORCL needs to reclaim the 200 to 202 zone on a daily close. That level is the line between relief bounces and real momentum. If that breakout happens, upside opens toward 215 to 220 first, then potentially 235 to 245 as the chart repairs. Until then, this is a structure-driven setup. Trade support, respect invalidation, and demand proof before chasing strength in Oracle.
ORCL is a damaged chart with tradable bounces.
Trade support, not hope. Invest only when proof shows up at 190, then 201.
Bottom line
Oracle is a business with real long-term upside. The company is winning massive cloud and AI contracts, building real backlog, and positioning itself as a serious infrastructure player. That part of the story is intact.
The stock, however, has already paid the price for that ambition. Heavy spending, funding concerns, and delayed revenue have pushed ORCL into a deep reset. The market is no longer rewarding promises. It wants execution and proof.
In the near term, ORCL is a trading stock, with bounces possible from 177 and 170 to 167. From an investment standpoint, patience still pays. Confidence returns only if the stock can hold 167 and reclaim 190, with real trend repair above 200 to 201.
Strong business.
Damaged chart.
Let execution show up in price before getting aggressive.
This material is for informational and educational purposes only and reflects general market observations, not personalized investment advice. Nothing here should be interpreted as a recommendation to buy, sell, or hold any security. All market views, price levels, and scenarios discussed are illustrative and subject to change without notice.
Yes. Appreciate a multi prong approach but am so glad I’m not holding and waiting for a recovery. So many better choices right now.