
Our Trade Plan Update For Week 1 Feb26
Active Trade Setups, Key Levels, and Risk Framework by Sector

This week is about separating true trend from post-shock noise.
A lot of the tape just shifted regimes: volatility expanded, momentum rolled, and several names moved from “easy continuation” into “prove it” territory. That does not automatically mean the bull case is dead, but it does mean location and reclaim levels matter more than conviction.
So the framework for the week is simple: identify the line-in-the-sand supports that must hold for the higher timeframe thesis to stay intact, then map the reclaim gates that flip a move from “reflex bounce” into “repair.” If price is below the moving average stack, assume rallies are corrective until proven otherwise. If price is above it, assume dips are buyable only when support is defended and momentum stops deteriorating.
This update is built to be trigger-driven. Every ticker has a small set of levels that decide the next swing, with blunt invalidation logic so we do not get emotionally trapped in chop.

How our trade plans work
Our process is rules-based and level-driven. Every setup is framed around a small number of decision zones: reclaim zones, pullback shelves, breakout triggers, targets, and a clear invalidation level. We act only at defined levels, where downside risk is already known.
We avoid the middle. We don’t chase strength. We step aside when structure breaks. Not every dip is a buy. Not every bounce deserves exposure. Cash is a position. Waiting is part of the plan.
Mechanically, the playbook is consistent:
If price is above a reclaimed breakout band and holding, the setup is in continuation mode and the job becomes management (trail risk up, respect the reclaimed zone, target the next checkpoints).
If price is inside the range between demand and resistance, the setup is in “no edge” mode and patience is the trade.
If price loses the level that defined the thesis (daily or weekly, depending on the plan), we treat it as invalidation. No rationalizing, no “it’ll come back.” The framework flips from offense to defense automatically.
That’s the point of falsifiable plans: we’re not trying to be right, we’re trying to be consistent.
This update covers the following 35+ stocks and ETFs across consumer, technology, healthcare, industrials, and commodities.
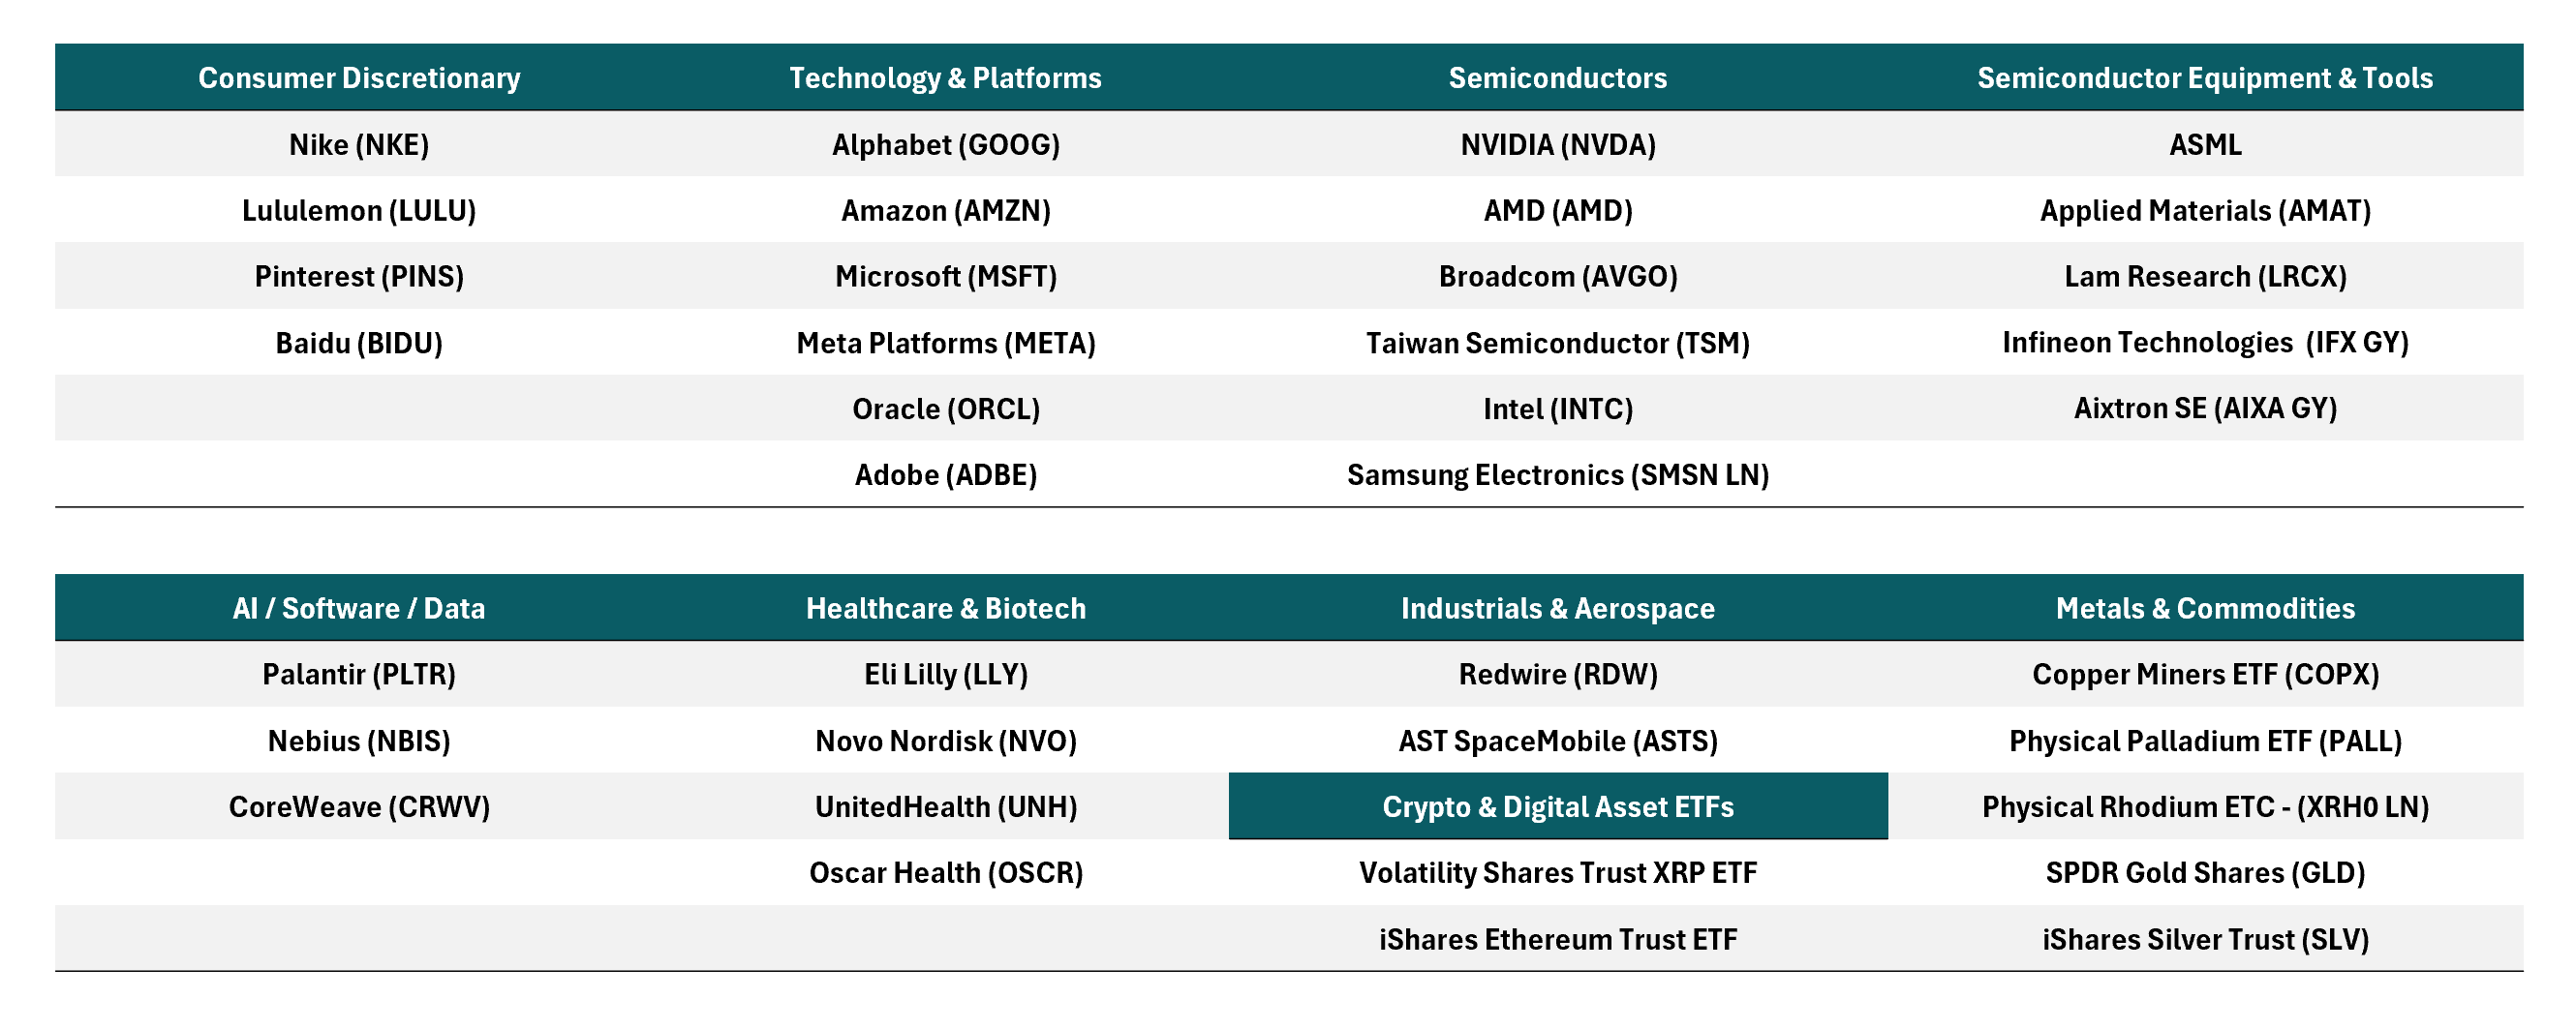
All are evaluated using the same rules-based framework and level-driven process.
This report concludes with a comprehensive, downloadable Trade Plan Summary table (PDF), designed as a quick reference to all active and developing setups discussed.
What has been working
The plans have stayed on the rails because they are falsifiable and level-driven. When price holds reclaimed zones, we stay in continuation mode and let checkpoints guide execution. When price pulls back into defined support, risk becomes measurable again instead of emotional.
The framework has also kept us from forcing trades. If structure does not repair, we shift from offense to patience, and we do not give damaged charts the benefit of the doubt.
The edge is repeatable decision-making. Not being right. Being consistent.
Alphabet GOOG 0.00%↑
Where price is now relative to the plan
Weekly structure is firmly bullish: price remains above the full weekly EMA stack, but it’s extended, with weekly RSI near 80. Daily and 4H structure are also constructive, with price holding above 20/50/100/200 EMAs and daily RSI in the mid-60s; bullish momentum without daily blowoff behavior.
What price action has confirmed or challenged
Confirmed: trend continuation remains intact across weekly, daily, and 4H. The market is still paying higher prices and respecting the moving-average framework.
Challenged: extension risk is elevated on the weekly. When weekly RSI is this stretched, pullbacks can be fast and deeper than expected even inside an uptrend, so location matters more than conviction.
Key decision zones
First support band: 333–334 (4H 20 EMA zone).
Next support: 329 (Daily 20 EMA; the cleanest “trend pullback” reference).
Deeper shelf: 327 (4H 50 EMA).
Regime check: 315 (Daily 50 EMA; below here, it stops behaving like a healthy pullback).
Ceiling / trigger zone: 340–342 (recent highs; acceptance above 342 is the next-leg signal).
If you are already holding
This remains a hold-in-trend as long as price continues to respect the 333–334 band on a closing basis. A pullback that holds 333–334 keeps the “easy trend” intact and supports trailing risk higher once a higher low forms. If price loses 333–334, expect a rotation toward 329 / 327 without treating it as thesis failure, this is the normal unwind path given the ATR profile. Trend damage only becomes a real conversation on a clean daily break below 315.
If you are not in the position
Chasing into 340–342 offers weaker asymmetry. The higher-probability entries are still location-based: a controlled pullback that holds 333–334 and re-accelerates, or a deeper reset into 329 that stabilizes cleanly. Breakout exposure only becomes attractive on a daily close and hold through 342, with the key requirement being fast acceptance above 340–342; failure to hold that band typically fades back into the prior range.
Invalidation (thesis-failure rules)
Loss of 333–334 = not failure, but signals a likely move to 329 / 327.
Daily loss of 329 = still uptrend, but the plan shifts to “wait for structure,” because odds of 315 rise.
Clean daily break below 315 = first meaningful regime-damage signal under the current MA stack.
Amazon AMZN 0.00%↑
Where price is now relative to the plan
Weekly structure is constructive with price above rising 20W and 50W. Weekly RSI is around 56, so trend is intact without extension risk. Daily is tight near the 20D with RSI in the low to mid 50s, which reads as consolidation and cooling momentum, not a breakout you chase.
What price action has confirmed or challenged
Confirmed: higher timeframe trend remains supportive, with a clean moving average structure underneath price.
Challenged: daily has compressed into a coil under resistance, so directional edge comes from resolution, not prediction.
Key decision zones
First support band: 238 to 239 (current area plus daily 20 EMA around 238.1).
Next shelf: 237 to 237.5 (4H 50 EMA around 237.25).
Primary pullback zone: 234.7 to 235 (4H and daily 50 EMA cluster, daily 50 EMA around 234.8).
Last healthy pullback: 231 (daily 100 EMA around 231.0).
Regime check: 223 to 224 (daily 200 EMA around 223.9).
Near term supply: 243 to 245 (reclaim level to re ignite momentum).
Major ceiling: 247 to 250 (weekly high near 247.8 plus prior swing high zone).
If you are already holding
This is a hold through consolidation as long as 238 to 239 continues to defend on a closing basis. If price reclaims 243 to 245 after holding 238 to 239, that is the clean continuation signal and the most straightforward path to a retest of 247 to 250. If 238 to 239 gives way, expect rotation toward 237 to 237.5, then potentially 234.7 to 235. That is not automatic thesis failure, it is the market working off the coil.
If you are not in the position
Avoid chasing into 243 to 245 while price is still coiling. Higher quality entries are location based:
A hold of 238 to 239 followed by a reclaim of 243 to 245.
If 238 fails, the next shelves are 237 to 237.5 for quick stabilization, then 234.7 to 235 for the best risk to reward pullback if trend remains intact.
Breakout exposure only becomes attractive on acceptance through 247 to 250, with the requirement that price holds above 245 quickly. Failure to hold 245 after a breakout attempt increases false break risk.
Invalidation and thesis failure rules
Daily loss of 234.7 to 235 shifts the setup away from easy continuation and increases odds of a deeper reset to 231.
Clean daily loss of 231 is trend damage and turns 223 to 224 into the major line.
Sustained trade below 223 to 224 is the thesis failure zone for the current uptrend framing.
Microsoft MSFT 0.00%↑
Where price is now relative to the plan
Price is around 430. Momentum is weak across all frames with 4H RSI around 35, daily RSI in the low 30s, and weekly RSI around 34, which signals trend damage. Volatility is elevated with ATR expanded across 4H, daily, and weekly, so this stays wide range and higher risk until a base forms.
What price action has confirmed or challenged
Confirmed: this is breakdown mode, not a clean dip buy. Weekly momentum damage plus expanding ATR typically means chop, failed rallies, and slower repair.
Challenged: any bounce attempt remains counter trend until key reclaim levels are taken back and held.
