
Our Trade Plan Update For Week 1 March 2026
Regime awareness, key decision zones, and disciplined risk framing

The regime picture entering March shows continued divergence, with notable shifts in both directions.
Mega-cap tech: stabilizing but not resolved
AMZN bounced marginally to 210.64 from 210.11 but remains below its full EMA stack. MSFT held the 392-402 base zone at 400.60, with MACD histogram turning positive at 0.81 for the first time in weeks; early deceleration of selling, not yet a buy signal. META at 653.69 sits directly at EMA20 (654.88), compressing the entire EMA stack into a tight 654–665 cluster. This sets up a directional resolution; the next move out of this band will be decisive. NVDA is the most important shift: price surged to 195.56, back above all four EMAs (20/50/100/200), with RSI at 61 and MACD histogram positive at 1.01. However, ADX at 36 still shows -DI at 21.8 dominating +DI at 4.7, the uptrend is not yet structurally confirmed.
Leadership: strong trends intact
Semiconductor equipment (ASML, LRCX, AMAT) remains the highest-conviction leadership group with strong uptrend structure intact. European tech continues to extend; IFX GY at 45.83, AIXA GY at 27.60. COPX at 95.70 maintains its strong uptrend with +DI at 43.6. Precious metals are pressing higher: GLD pushed to 483.75 near the Bollinger upper band, SLV surged to 84.99 approaching its BB upper at 85.19. SMSN LN at 3578 remains the strongest asset in the portfolio; ADX 45.5, RSI 78.
Damage: deepening in select names
BIDU collapsed to 125.15 (RSI 28.5), breaking from range into a downtrend. NVO deepened to 37.45, down 21% from two weeks ago. NBIS pulled back to 88.40, now below EMA20 and EMA50. CRWV fell to 75.66, well below its EMA stack.

How our trade plans work
Our process is rules-based and level-driven. Every setup is framed around a small number of decision zones: reclaim zones, pullback shelves, breakout triggers, targets, and a clear invalidation level. We act only at defined levels, where downside risk is already known.
We avoid the middle. We do not chase strength. We step aside when structure breaks. Not every dip is a buy. Not every bounce deserves exposure. Cash is a position. Waiting is part of the plan.
Mechanically, the playbook is consistent:
If price is above a reclaimed breakout band and holding, the setup is in continuation mode and the job becomes management: trail risk up, respect the reclaimed zone, target the next checkpoints.
If price is inside the range between demand and resistance, the setup is in no edge mode and patience is the trade.
If price loses the level that defined the thesis (daily or weekly, depending on the plan), we treat it as invalidation. No rationalizing, no it will come back. The framework flips from offense to defense automatically.
The objective is consistency and managing risk.
This update covers the following 40 stocks and ETFs across consumer, technology, healthcare, industrials, and commodities.
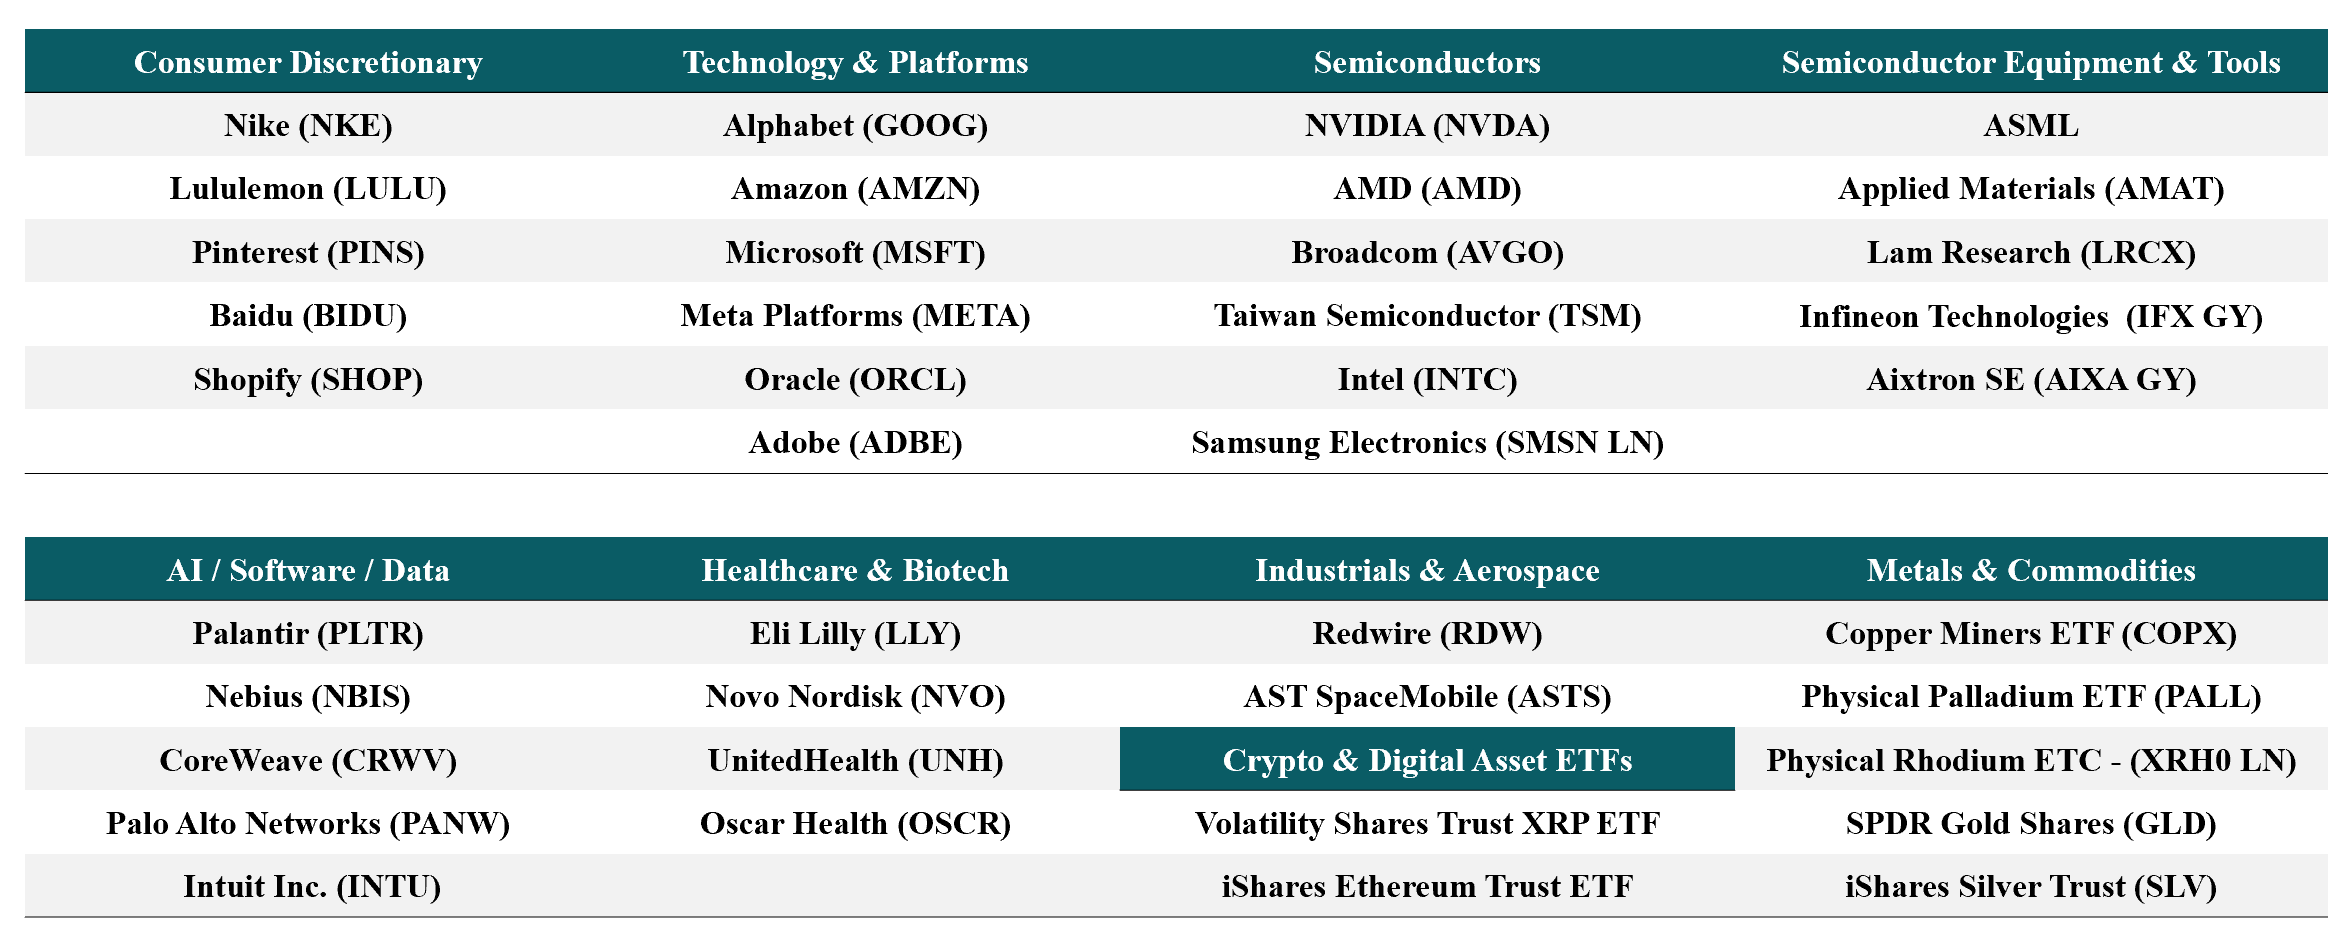
All are evaluated using the same rules-based framework and level-driven process.
What has been working
This week continued to reward discipline around regime classification. The strongest performers remain names that held above the daily EMA stack: ASML, LRCX, AMAT, IFX GY, AIXA GY, COPX, and GLD have all maintained trend structure, and pullbacks in these names continue to resolve constructively. SLV’s breakout to 84.99 from last week’s 76.62 confirms that commodity exposure continues to outperform. GLD pushed to new highs at 483.75. On the defensive side, respecting invalidation levels in BIDU, NVO, NBIS, and CRWV prevented further drawdowns as those names continued lower or pulled back sharply. Names in strong downtrends (ADBE, PINS, ORCL) have remained unrewarding for early longs, confirming that confirmation-only entries outperform anticipation trades in this environment.
In short: regime discipline, patience at levels, and confirmation-first engagement continue to work.
This trade plan is based on technical levels and risk framing; full context matters and outcomes are not guaranteed.
Alphabet Inc. (GOOG)
Where price is now relative to last week’s plan: Last week framed GOOG as range/compression with 296 to 315 as Support 1 and 318 as the first reclaim (EMA20). Price is at 311.43, down 1.1% from last week’s 314.90. Still below the EMA20 (315.30) and EMA50 (315.01), but above the EMA100 (298.18) and EMA200 (266.00). RSI is 44.6, neutral. MACD histogram at negative 0.55, slightly negative but flattening. ADX at 30.3 with -DI at 29.4 dominating +DI at 15.6 confirms bearish pressure remains. The range thesis is weakening toward downtrend.
What price action confirmed or challenged
Confirmed: range conditions persist but bearish pressure is building. Price failed to reclaim the EMA20 at 318 from last week and is now slipping further below the EMA20/50 cluster at 315.
Challenged: the EMA100 at 298 continues to hold as the structural floor, preventing a full downtrend classification.
Key decision zones
Support 1: 292 to 311 (Bollinger lower at 291.60 to current area)
Support 2: 298 (EMA100, major structural shelf)
Line in the sand: 266 (EMA200, larger trend integrity)
First reclaim: 315 (EMA20/50 cluster, now tightly compressed)
Upside checkpoints: 318 (last week’s reclaim), then 345 (Bollinger upper)
If already holding: This is shifting from range to defensive posture. The EMA20/50 cluster at 315 is overhead resistance. If 298 holds on closes, the range survives. If 298 breaks, the setup shifts from range into damage. Any bounce into 315 is the first real decision wall.
If not in the position: No edge inside the range. Higher-quality exposure requires either a stabilization at 298 to 303 with evidence of demand, or a confirmed reclaim and hold above 315. Do not front-run a bounce inside declining momentum.
Invalidation and thesis-failure rules: Daily acceptance below 298 shifts this from range into trend damage. Stand aside until 315 is reclaimed and held.
Amazon.com, Inc. (AMZN)
Where price is now relative to last week’s plan: Last week framed AMZN as a downtrend with 207 to 210 as Support 1 and 216 as the first reclaim (EMA20). Price is at 210.64, essentially flat from last week’s 210.11. Still below the EMA20 (214.38), EMA50 (222.97), EMA100 (225.39), and EMA200 (222.27). RSI is 42.4, improving from last week’s 39. MACD histogram turned slightly positive at 0.24 for the first time in weeks. ADX at 28.8 with -DI at 28.5 still dominating +DI at 19.4. The downtrend has stabilized but not reversed.
What price action confirmed or challenged
Confirmed: downtrend structure persists with price below the full EMA stack.
Challenged: MACD histogram turning positive and RSI improving from 39 to 42 suggests downside momentum is fading. The base at 207 to 210 has held for two weeks.
Key decision zones
Support 1: 207 to 211 (current acceptance area)
Support 2: 184 (Bollinger lower)
First reclaim: 214 to 216 (EMA20)
Next reclaim: 222 to 223 (EMA50/200 cluster)
Upside checkpoints: 225, then 249 (Bollinger upper, repair objectives only)
If already holding: This is still defense mode, but momentum is improving. The 207 to 210 floor has held. If 214 is reclaimed and held, the first corrective bounce target is the EMA50/200 cluster at 222 to 223. Until then, any strength remains corrective.
If not in the position: Confirmation-only. A base that holds 207 and then reclaims 214 to 216 is the first credible repair signal. Conservative improvement only above the EMA50/200 cluster at 222 to 225.
Invalidation and thesis-failure rules: Sustained trade below 207 increases continuation-down risk toward 184. Repair thesis is not credible until 214 is reclaimed and held.
Microsoft Corp. (MSFT)
Where price is now relative to last week’s plan: Last week framed MSFT as a strong downtrend with 392 to 397 as Support 1 and 418 as the first reclaim (EMA20). Price is at 400.60, up 0.8% from 397.23. Still below the entire EMA stack (EMA20 411, EMA50 439, EMA100 460, EMA200 467). RSI is 39.6, improving from 32. MACD histogram turned positive at 0.81 for the first time in weeks. ADX at 36.3 with -DI at 37.7 still dominating +DI at 21.8. The base zone at 392 to 402 continues to hold.
What price action confirmed or challenged
Confirmed: structural damage continues with price well below the EMA stack.
Challenged: MACD histogram turning positive and RSI improving from 32 to 40 suggests selling pressure may be fading. The 392 floor has held for three consecutive weeks.
