
Our Trade Plan Update For Week 2 Feb26
Regime awareness, key decision zones, and disciplined risk framing

Market conditions remain mixed and increasingly selective. While index-level action has stayed relatively orderly, individual names continue to diverge sharply between those holding trend structure and those in various stages of repair or breakdown.
In this environment, the daily EMA stack remains the primary regime filter. Assets above it are still being treated as trend-holds, while assets below it require confirmation through reclaim levels before risk is justified. Where key supports failed this week, those names have been reclassified accordingly.
The trade plan below reflects this framework, focusing on clear decision zones, defined invalidation levels, and disciplined positioning rather than directional assumptions.

How our trade plans work
Our process is rules-based and level-driven. Every setup is framed around a small number of decision zones: reclaim zones, pullback shelves, breakout triggers, targets, and a clear invalidation level. We act only at defined levels, where downside risk is already known.
We avoid the middle. We don’t chase strength. We step aside when structure breaks. Not every dip is a buy. Not every bounce deserves exposure. Cash is a position. Waiting is part of the plan.
Mechanically, the playbook is consistent:
If price is above a reclaimed breakout band and holding, the setup is in continuation mode and the job becomes management (trail risk up, respect the reclaimed zone, target the next checkpoints).
If price is inside the range between demand and resistance, the setup is in “no edge” mode and patience is the trade.
If price loses the level that defined the thesis (daily or weekly, depending on the plan), we treat it as invalidation. No rationalizing, no “it’ll come back.” The framework flips from offense to defense automatically.
That’s the point of falsifiable plans: we’re not trying to be right, we’re trying to be consistent.
This update covers the following 35+ stocks and ETFs across consumer, technology, healthcare, industrials, and commodities.
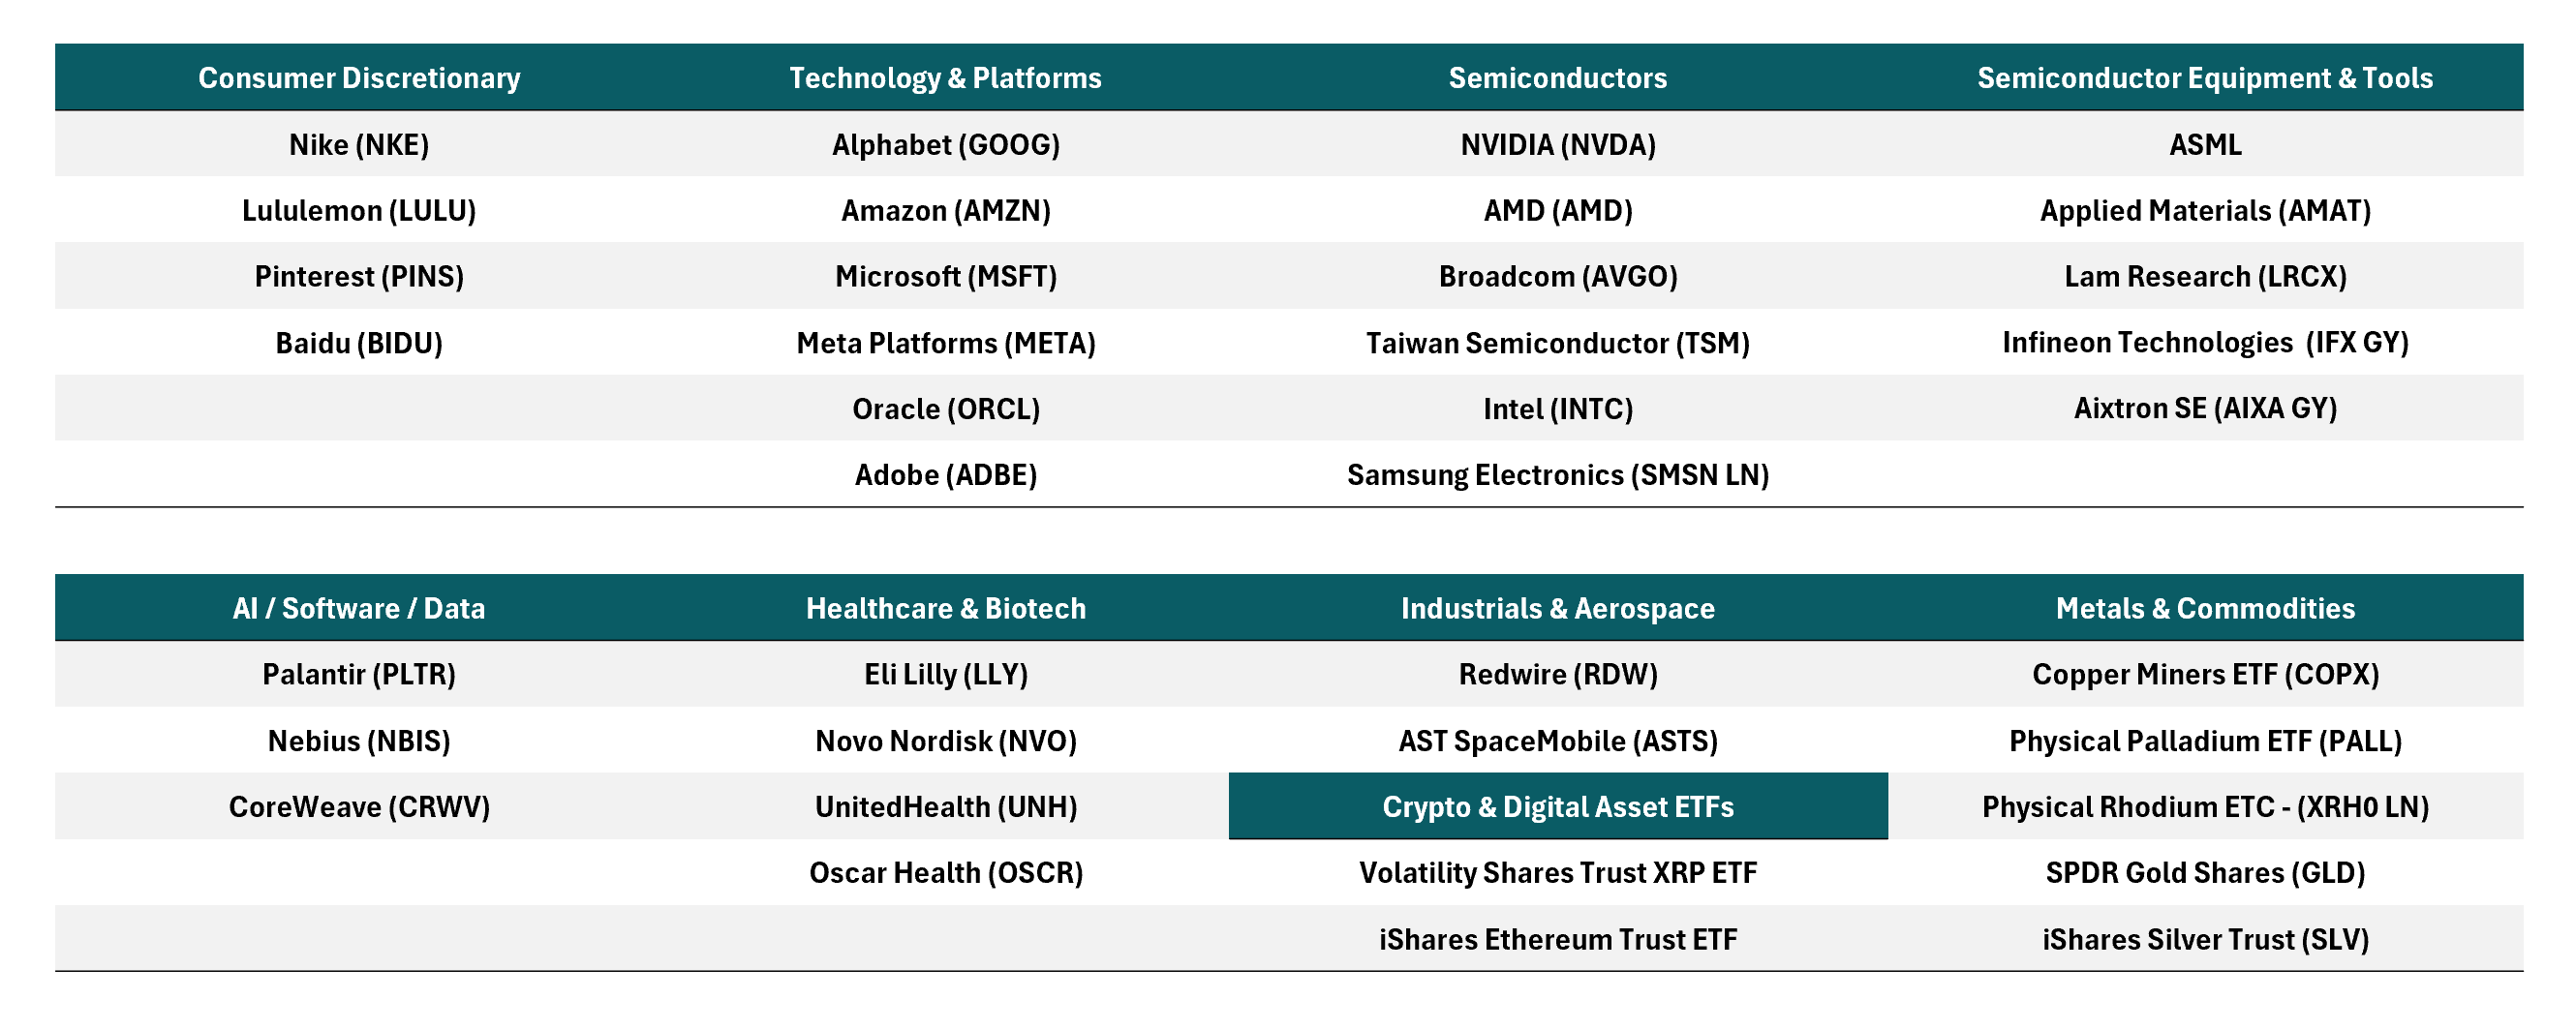
All are evaluated using the same rules-based framework and level-driven process.
This report concludes with a comprehensive, downloadable Trade Plan Summary table (PDF), designed as a quick reference to all active and developing setups discussed.
What Has Been Working
This environment has continued to reward discipline over anticipation.
Assets that have held above key daily EMAs have remained the most reliable, with pullbacks resolving constructively and downside attempts failing quickly. By contrast, names below the EMA stack have required confirmation before engagement, and waiting for reclaim levels has consistently produced better outcomes than trying to front-run repairs.
Just as important, respecting invalidation levels early has helped avoid deeper drawdowns, while patience and selectivity have often been the correct response as dispersion increased.
In short, following the regime and letting price earn participation has continued to work.
This trade plan is based on technical levels and risk framing; full context matters and outcomes are not guaranteed.
Alphabet Inc. (GOOG) Last price: 323.10
Where price is now relative to last week’s plan: Last week had GOOG in breakout-confirmed continuation mode. This week, price lost the breakout area and is now below the daily EMA20, sitting just above the daily EMA50. Momentum cooled (RSI sub-50, MACD rolling).
What price action confirmed or challenged
Confirmed: higher timeframe trend is not broken yet, because the EMA50 is still holding underneath.
Challenged: “easy continuation” is gone until GOOG reclaims the EMA20 band and holds.
Key decision zones
Support 1: 318 to 320 (daily EMA50 zone, first must-hold for a normal pullback)
Support 2: 310 to 312 (wick low zone, next shelf if EMA50 fails)
Deeper support: 303 to 300 (prior plan’s deeper pullback band)
First reclaim: 330 to 332 (daily EMA20 and breakdown pivot)
Next reclaim: 338 to 342 (prior highs area)
If already holding: This is “manage, not add” unless 318 to 320 holds and you see a higher low. If 318 to 320 fails on closes, expect rotation to 310 to 312, then possibly 303 to 300.
If not in the position: Higher-quality exposure is location-based: a stabilization at 318 to 320, or a deeper reset into 310 to 312 with evidence of demand. Breakout behavior only returns after a reclaim and hold above 330 to 332.
Invalidation and thesis-failure rules: Daily acceptance below 318 to 320 shifts the setup from pullback to deeper reset risk.
A clean loss of 303 to 300 materially weakens the swing-long framing.
Amazon.com, Inc. (AMZN) Last price: 210.32
Where price is now relative to last week’s plan: Last week framed AMZN as a reclaimed breakout holding above the range. Now price is far below the full daily EMA stack, with RSI deeply oversold and MACD accelerating down. This is post-event damage, not a dip-buy trend.
What price action confirmed or challenged
Confirmed: the breakout thesis failed for now.
Challenged: oversold can bounce, but oversold is not repair.
Key decision zones
Immediate floor: 200 to 202 (panic-low area, first place a base must form)
Next shelf: 195 (if 200 fails, odds shift quickly)
First reclaim: 224 to 225 (daily EMA200 area, minimum reclaim to reduce “downtrend bounce” risk)
Next reclaim: 231 (daily EMA100 area)
Major reclaim wall: 233 to 235 (EMA20/50 region, trend does not improve meaningfully until this is retaken)
If already holding: This is defense. If 200 to 202 fails on closes, the market is still repricing. If a bounce happens, treat 224 to 225 as the first real decision wall.
If not in the position: This is confirmation-only. A base that holds 200 to 202 and then reclaims 224 to 225 is the first credible “repair attempt.” Anything else is trading a reflex bounce inside damage.
Invalidation and thesis-failure rules: Sustained trade below 200 breaks the base attempt and increases continuation-down risk.
Repair thesis is not credible until 224 to 225 is reclaimed and held.
Microsoft Corp. (MSFT) Last price: 401.14
Where price is now relative to last week’s plan: Last week already framed MSFT as breakdown/repair mode. This week price is even lower, still far below the EMA stack, with RSI near oversold and MACD deeply negative. This remains “prove it” tape.
Key decision zones
Support 1: 392 to 402 (current base zone)
Major support: 388 to 390 (weekly structural shelf from last week’s framework)
First reclaim: 421 to 426 (first level that turns “freefall” into “base”)
Next reclaim: 442 to 443 (repair gate)
