

Our Trade Plan Update For Week 2 March 2026
Regime awareness, key decision zones, and disciplined risk framing

The regime picture entering Week 2 of March is defined by two forces pulling in opposite directions. On one hand, several key names are pressing into confirmed breakout zones after weeks of coiling and base-building. On the other, broad damage in mega-cap tech and consumer names has not repaired, and the temptation to bottom-fish remains the single greatest risk to capital.
Live decision points dominating this week.

NFLX surged to 98.66, now sitting directly below the 200-day moving average at 99.66. RSI at 73.9 and StochRSI at 100 confirm this is a genuine momentum thrust, not a dead cat bounce. The 101 level determines whether this becomes a multi-quarter advance or a high-quality bear market rally. ASML pulled back to 1399.37 from last week’s 1463.80, now testing the 1400 breakout zone with StochRSI washed out at 6.8. Selling is exhausted. NVDA fell from 195.56 to 183.04, now sitting on the EMA100 at 183 with ADX at 13, the lowest reading in recent memory. The coil is tightening. META broke above 667.73, clearing the EMA20/50 cluster for the first time since the downtrend began, with +DI crossing above -DI. This is the most significant regime shift in mega-cap tech this week.
Leadership rotation continues
European tech maintains strength: AIXA at 30.41 (RSI 82, parabolic extension) and IFX at 43.95 (confirmed uptrend structure intact). Semi equipment is cooling: AMAT pulled back from 375.72 to 357.76 but holds above the EMA20 at 355. LRCX fell below EMA20 to 222.99. GLD consolidated to 471.80 from 483.75 but remains above all EMAs. SLV pulled back sharply from 84.99 to 75.34, falling below EMA20 at 77.38. COPX weakened from 95.70 to 88.16, now below EMA20.
Damage deepening in select names
BIDU collapsed further to 118.98 (RSI 24). NVO continued lower to 38.50, still in freefall. NKE broke below its prior EMA cluster to 58.64. PLTR surged to 153.19, reclaiming the EMA50/200 cluster in a dramatic shift. INTU bounced to 440.14 from 381.23, reclaiming the EMA20 at 424 with StochRSI at 100.
How our trade plans work
Our process is rules-based and level-driven. Every setup is framed around a small number of decision zones: reclaim zones, pullback shelves, breakout triggers, targets, and a clear invalidation level. We act only at defined levels, where downside risk is already known.
We avoid the middle. We do not chase strength. We step aside when structure breaks. Not every dip is a buy. Not every bounce deserves exposure. Cash is a position. Waiting is part of the plan.
This update covers the following 40+ stocks and ETFs across consumer, technology, healthcare, industrials, and commodities.
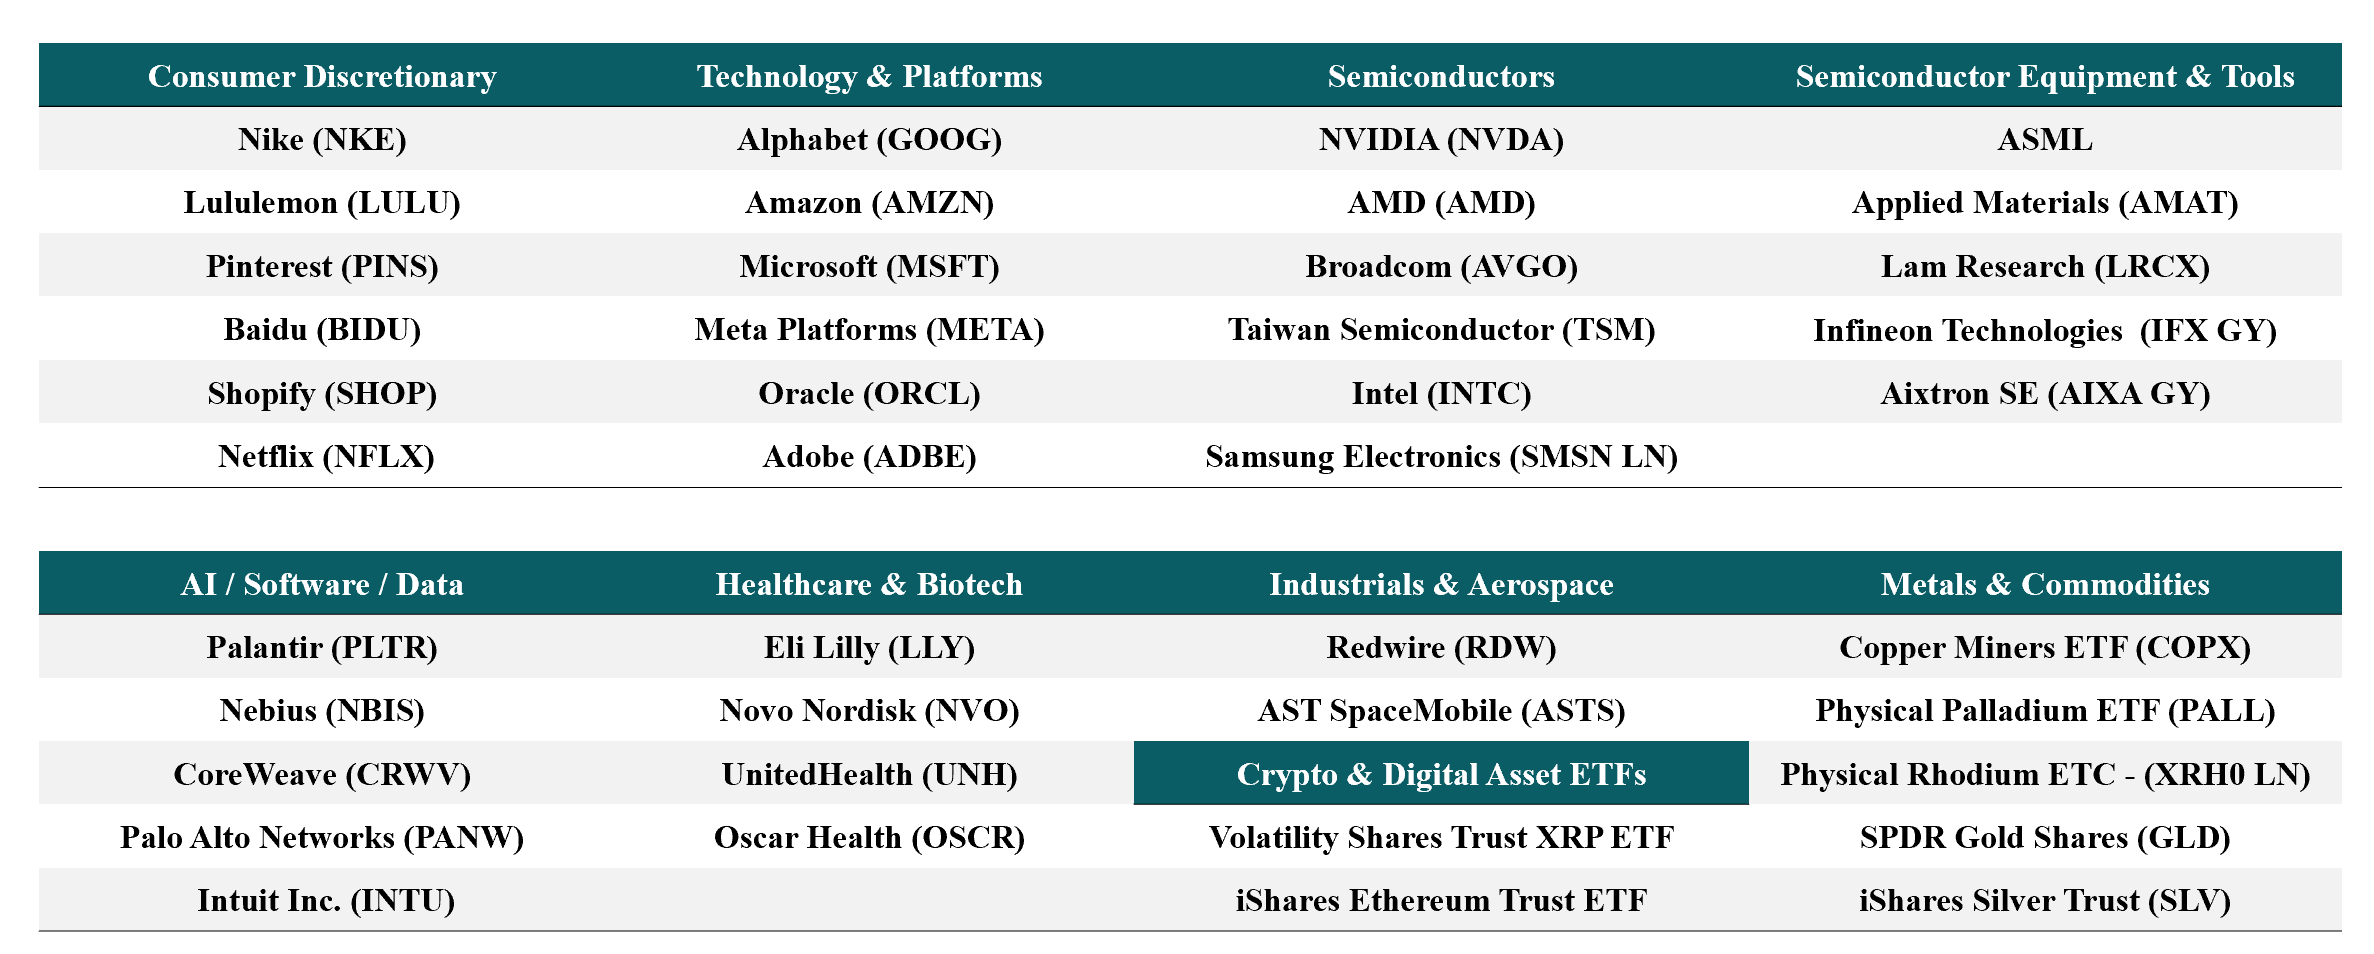
All are evaluated using the same rules-based framework and level-driven process.
What has been working
This week rewarded two things: patience at levels and respect for momentum. NFLX delivered a textbook structural thrust from the completed 5-wave decline, confirming the exhaustion low thesis at 75. PLTR surged 12.7% to 153.19, reclaiming the EMA50 and EMA200 in a single week, flipping from downtrend to potential uptrend. INTU bounced 15.4% from 381 to 440, clearing the EMA20 at 424 with extreme StochRSI readings. META cleared its EMA20/50 compression band, the first decisive move in weeks. On the defensive side, respecting invalidation levels in BIDU, NVO, and NKE prevented further losses as all three continued lower. Names with validated theses (AVGO, NVDA, IFX, ASML, GLD, SLV) are approaching their defined entry zones, rewarding the discipline of setting alerts rather than chasing.
In short: the names with structure are producing actionable setups at defined levels. The names without structure continue to punish early engagement. Regime first. Levels second.
This trade plan is based on technical levels and risk framing; full context matters and outcomes are not guaranteed.
Alphabet Inc. (GOOG) Last price: 303.45
Where price is now relative to last week’s plan: W1 framed GOOG as range/compression weakening toward downtrend, with 298 as the structural floor and 315 as the first reclaim (EMA20/50 cluster). Price is at 303.45, down 2.6% from 311.43. Now below the EMA20 (312.46) and EMA50 (313.81), still above the EMA100 (298.54) and EMA200 (267.13). RSI has deteriorated to 38.22 from 44.6 last week. MACD histogram at negative 0.70, negative and expanding. ADX at 31.46 with -DI at 29.09 dominating +DI at 13.96 confirms bearish pressure is intensifying. StochRSI has bounced to 56.29 from prior washed-out levels, suggesting a minor reflex bounce within the decline. The range thesis from W1 has shifted further toward downtrend.
What price action confirmed or challenged
Confirmed: the slide toward the EMA100 at 298 continues. Price failed again at 315 and is now 10 points below the EMA20/50 cluster. -DI dominance has widened.
Challenged: the EMA100 at 298.54 continues to hold. Until this breaks on a daily close, full downtrend classification is premature.
Key decision zones
Support 1: 294 to 303 (Bollinger lower at 294.05 to current area)
Support 2: 298.54 (EMA100, the structural shelf)
Line in the sand: 267.13 (EMA200)
First reclaim: 312 to 314 (EMA20/50 cluster)
Upside checkpoints: 315, then 331 (Bollinger upper)
If already holding: Defensive. The 298 floor is the last line before regime shifts to damage. If 298 breaks on closes, the setup is no longer range but downtrend. Any bounce into 312 to 314 is overhead resistance. Manage risk at 294.
If not in the position: No edge. The range is compressing toward resolution and momentum is bearish. Wait for either a definitive hold and reversal at 298 with volume, or a reclaim and hold above 314. Do not engage inside the decline.
Invalidation and thesis-failure rules: Daily close below 298 shifts this into trend damage. Stand aside until 314 is reclaimed and held.
Amazon.com, Inc. (AMZN) Last price: 216.82
Where price is now relative to last week’s plan: W1 framed AMZN as downtrend stabilizing, with 207 to 210 as the base zone and 214 as the first reclaim (EMA20). Price surged to 216.82, up 2.9% from 210.64. Now above the EMA20 (212.94) for the first time in weeks, approaching the EMA50/100/200 cluster at 220 to 224. RSI improved to 51.65 from 42.4. MACD histogram expanded to positive 1.67. StochRSI at 95.58 is overbought. ADX at 27.01 with -DI at 25.18 still marginally above +DI at 22.35, but the gap is closing rapidly.
What price action confirmed or challenged
Confirmed: the 207 to 210 base held for a third consecutive week and produced a breakout above the EMA20 at 213. MACD histogram acceleration confirms momentum is improving.
Challenged: the downtrend classification from W1 is weakening. The EMA20 reclaim is the first credible repair signal. However, the EMA50/100/200 cluster at 220 to 224 is massive overhead resistance.
Key decision zones
Support 1: 209 to 213 (prior base to EMA20, now support)
Support 2: 193 (Bollinger lower)
First reclaim: 220 to 222 (EMA50/200 cluster)
Next reclaim: 224 (EMA100)
Upside checkpoints: 225, then 249
If already holding: Constructive for the first time in weeks. The EMA20 reclaim shifts this from defense to cautious hold. Trail stop to 209. The real test is the EMA50/200 cluster at 220 to 222. Bounces that fail there remain corrective.
If not in the position: The EMA20 reclaim is encouraging but the overhead resistance from 220 to 224 is thick. Pullbacks to 213 that hold offer entry with risk at 207. Higher conviction above 222.
Invalidation and thesis-failure rules: Loss of 207 resumes downtrend. Repair thesis requires acceptance above 222.
Microsoft Corp. (MSFT) Last price: 405.20
Where price is now relative to last week’s plan: W1 framed MSFT as strong downtrend with 392 to 402 as the base zone and 411 as the first reclaim (EMA20). Price is at 405.20, up 1.1% from 400.60. Still below the EMA20 (407.06), EMA50 (432.24), EMA100 (454.78), and EMA200 (464.07). RSI improved to 44.79 from 39.6. MACD histogram expanded to positive 3.32, the strongest positive reading in weeks. StochRSI at 100, overbought. ADX at 30.10 with -DI at 30.42 still above +DI at 26.35, but the gap has narrowed significantly.
What price action confirmed or challenged
Confirmed: the 392 base continues to hold for a fourth consecutive week. Selling momentum is decelerating.
Challenged: MACD histogram at 3.32 is the strongest deceleration signal yet. The 392 floor has proven durable. However, price remains 27 points below EMA50 and 59 points below EMA200. The structural damage is deep.
Key decision zones
Support 1: 400 to 405 (current base)
Support 2: 385 (Bollinger lower)
First reclaim: 407 (EMA20)
Next reclaim: 432 (EMA50)
Major reclaim wall: 454 to 464 (EMA100/200)
Upside checkpoints: 416, then 432
If already holding: Improving from extreme damage but not repaired. The EMA20 at 407 is the immediate test. A daily close above 407 shifts this from defense to cautious hold. Trail stop to 392.
If not in the position: Stand aside until EMA20 at 407 is reclaimed and held. Real structural improvement only above 432.
Invalidation and thesis-failure rules: Below 385 resumes downtrend acceleration. Repair requires acceptance above 407.
Meta Platforms Inc. (META) Last price: 667.73
Where price is now relative to last week’s plan: W1 framed META as range/compression with the EMA stack compressed into 655 to 666 and awaiting directional resolution. Price broke out to 667.73, up 2.1% from 653.69. Now above the EMA20 (655.68), EMA50 (657.72), EMA100 (664.80), and EMA200 (664.53) for the first time since the downtrend began. RSI improved to 54.75 from 49.2. MACD histogram turned positive at 0.98. ADX at 12.67 remains extremely low but +DI at 27.79 has crossed decisively above -DI at 19.47. StochRSI at 88.71 is elevated.
What price action confirmed or challenged
Confirmed: the directional resolution W1 anticipated has arrived. Price cleared the full EMA stack at 655 to 666. +DI crossing above -DI confirms bullish directional bias for the first time.
Challenged: the downtrend classification is no longer valid. This is now a confirmed range breakout with early uptrend characteristics. However, ADX at 12.67 means the breakout lacks trend conviction. This needs ADX expansion to confirm.
Key decision zones
