
Our Trade Plan Update For Week 3 Feb26
Regime awareness, key decision zones, and disciplined risk framing

Market conditions have deteriorated sharply from last week. Where Week 2 still had a mix of trend-holds and pullbacks, this week forced a clear reclassification across a large portion of the portfolio. Damage is concentrated in mega-cap tech and select growth names that failed key EMA supports, while semiconductor equipment, European tech, gold, and copper continue to hold trend structure. The daily EMA stack remains the primary regime filter. Assets above it are still treated as trend-holds where pullbacks can be constructive. Assets below it are in repair or breakdown until reclaim levels are achieved and held. Where prior supports failed this week, those names have been reclassified accordingly. Selectivity is not optional.

How our trade plans work
Our process is rules-based and level-driven. Every setup is framed around a small number of decision zones: reclaim zones, pullback shelves, breakout triggers, targets, and a clear invalidation level. We act only at defined levels, where downside risk is already known.
We avoid the middle. We do not chase strength. We step aside when structure breaks. Not every dip is a buy. Not every bounce deserves exposure. Cash is a position. Waiting is part of the plan.
Mechanically, the playbook is consistent:
If price is above a reclaimed breakout band and holding, the setup is in continuation mode and the job becomes management: trail risk up, respect the reclaimed zone, target the next checkpoints.
If price is inside the range between demand and resistance, the setup is in “no edge” mode and patience is the trade.
If price loses the level that defined the thesis (daily or weekly, depending on the plan), we treat it as invalidation. No rationalizing, no “it will come back.” The framework flips from offense to defense automatically.
The objective is consistency and managing risk.
This update covers the following 35+ stocks and ETFs across consumer, technology, healthcare, industrials, and commodities.
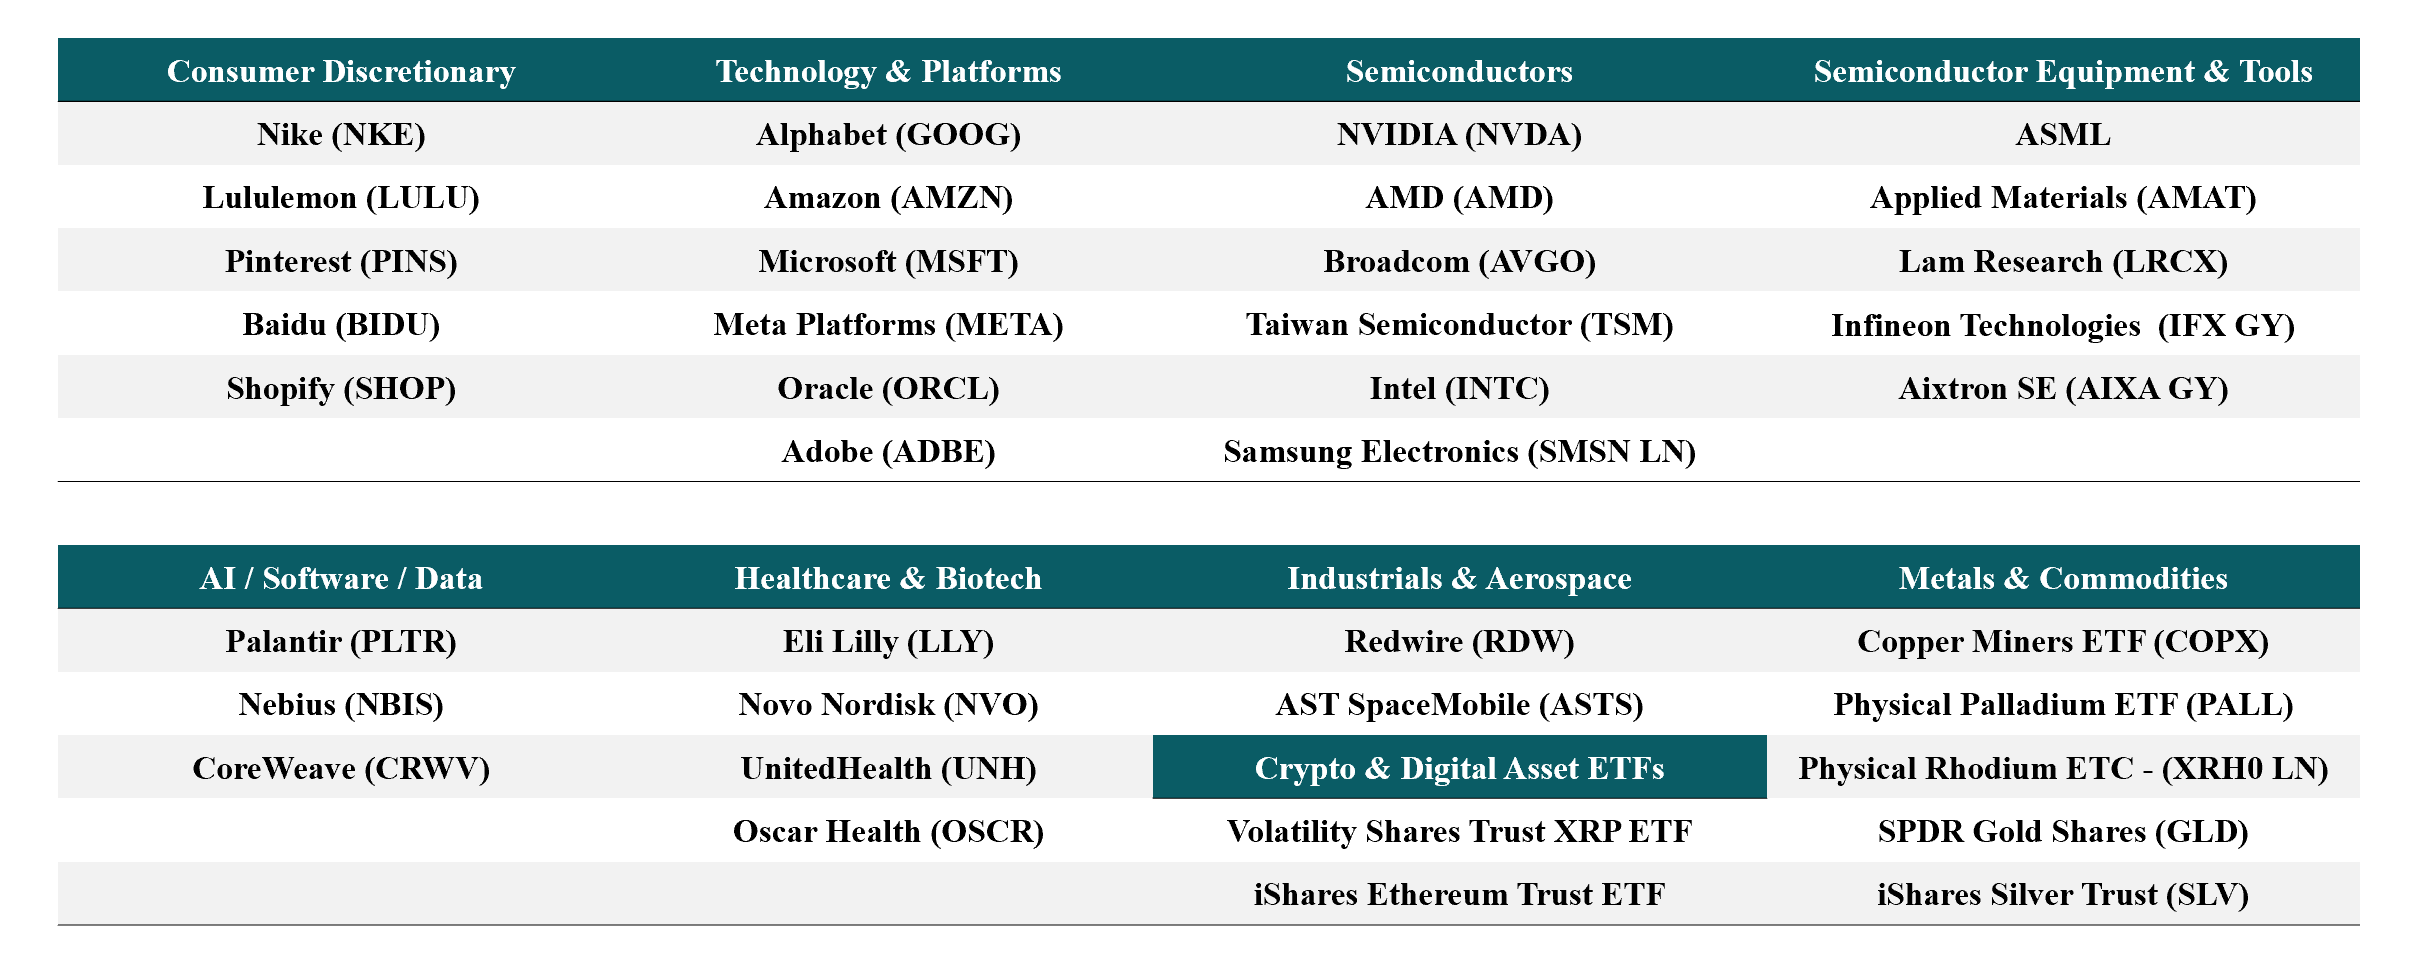
All are evaluated using the same rules-based framework and level-driven process.
This report concludes with a comprehensive, downloadable Trade Plan Summary table (PDF), designed as a quick reference to all active and developing setups discussed.
What has been working
This environment has continued to reward regime discipline over anticipation. Assets that held above key daily EMAs, particularly TSM, ASML, LRCX, AMAT, GLD, and COPX, have remained the most reliable, with pullbacks resolving constructively and downside attempts failing quickly. By contrast, names below the EMA stack have required confirmation before engagement, and waiting for reclaim levels has consistently produced better outcomes than trying to front-run repairs. Just as important, respecting invalidation levels early has helped avoid deeper drawdowns. AMZN, PLTR, PINS, and ASTS all broke critical supports this week, and defensive posturing at those breaks prevented riding damage lower.
In short, following the regime and letting price earn participation has continued to work.
This trade plan is based on technical levels and risk framing; full context matters and outcomes are not guaranteed.
Alphabet Inc. (GOOG) Last price: 306.02
Where price is now relative to last week’s plan: Last week framed GOOG as a repair/pullback with 318 to 320 as Support 1 and the daily EMA50 as the must-hold shelf. This week price broke through all of those supports and is now at 306, below the EMA20 (323.90), EMA50 (317.57), and sitting just above the EMA100 (296.06). RSI is 32, deeply oversold. MACD is accelerating lower with histogram at negative 4.16. The prior pullback thesis failed.
What price action confirmed or challenged
Confirmed: the thesis failed because 318 to 320 did not hold. Regime shifts from pullback to deeper reset.
Challenged: the EMA100 at 296 is now in play as the next structural test, and oversold RSI suggests a reflex bounce is possible.
Key decision zones
Support 1: 303 to 307 (current Bollinger lower band and local area)
Support 2: 296 (daily EMA100, major shelf)
Line in the sand: 262 (EMA200, larger trend integrity)
First reclaim: 317 to 318 (EMA50, prior support now resistance)
Next reclaim: 323 to 324 (EMA20)
Upside checkpoints: 330 to 332 (last week’s first reclaim), then 338 to 342
If already holding: The pullback thesis failed. This is now defense. If 303 to 307 holds and RSI curls from oversold, a reflex bounce toward the EMA50 at 317 is possible, but treat it as corrective until reclaimed. If 296 breaks on closes, the setup degrades further.
If not in the position: Higher-quality exposure requires either a stabilization at 296 to 303 with evidence of demand, or a confirmed reclaim and hold above 317 to 318. Do not front-run a bounce inside damage.
Invalidation and thesis-failure rules: Daily acceptance below 296 shifts this from deep pullback into trend damage. Stand aside until weekly reclaim of 317 or better.
Amazon.com, Inc. (AMZN) Last price: 198.79
Where price is now relative to last week’s plan: Last week identified 200 to 202 as the panic-low floor where a base must form. Price has now lost that zone, trading at 198.79, below the entire EMA stack. RSI is 23, deeply oversold. MACD histogram at negative 4.39 confirms accelerating downside. The prior damage/base thesis has failed.
What price action confirmed or challenged
Confirmed: the thesis failed because 200 did not hold. Downside repricing continues.
Challenged: RSI at 23 is extremely oversold, raising the probability of a mechanical bounce, but oversold is not a buy signal inside damage.
Key decision zones
Support 1: 195 to 199 (current acceptance area and Bollinger lower band)
Support 2: 190 (psychological and structural)
First reclaim: 221 to 222 (EMA20, minimum to reduce downtrend bounce risk)
Next reclaim: 228 (EMA50/100 cluster)
Major reclaim wall: 233 to 235 (last week’s major reclaim, trend does not improve until retaken)
Upside checkpoints: 228, then 233 to 235 (repair objectives only)
If already holding: This is full defense. The 200 floor broke. If 195 holds and a base forms, the first real decision wall on any bounce is 221 to 222. Until then, any strength is still vulnerable.
If not in the position: Stand aside. Confirmation-only. A base that holds 195 and then reclaims 221 to 222 is the first credible repair signal. Anything else is a reflex bounce inside damage.
Invalidation and thesis-failure rules: Sustained trade below 195 increases continuation-down risk. Repair thesis is not credible until 221 to 222 is reclaimed and held.
Microsoft Corp. (MSFT) Last price: 401.32
Where price is now relative to last week’s plan: Last week already had MSFT in breakdown/repair with 392 to 402 as the base zone and 388 to 390 as major support. Price is at the top of that base zone at 401, still far below the EMA stack (EMA20 427, EMA50 453, EMA100 470, EMA200 472). RSI is 32, oversold. MACD deeply negative. ADX at 35 confirms strong downtrend momentum.
What price action confirmed or challenged
Confirmed: continued weakness. Price remains in the base zone with no repair signal.
Challenged: the base at 392 to 402 has held so far, preventing further capitulation.
