

Our Trade Plan Update For Week 3 Mar 2026
Regime awareness, key decision zones, and disciplined risk framing

The regime picture entering Week 3 of March has shifted sharply from last week’s multiple decision points. The breakout candidates from W2, NFLX at the 200 MA, META’s EMA stack reclaim, NVDA’s coil at 183, have produced mixed results. The most significant development: broad market damage has widened, with 17 names now classified as Strong Downtrend, up from approximately 13 last week. Meanwhile, a narrow set of confirmed uptrends continues to outperform.

Live decision points this week
NFLX at 95.31 remains below the 200 MA at 99.45 but above EMA20 (91.49) and EMA50 (90.38). RSI 62 with MACD bullish (+0.63 hist). The 99.5 level remains THE binary decision. XRH0 LN surged to 720, now the strongest chart in the portfolio, Strong Uptrend with all EMAs bullishly stacked, RSI 68, MACD bullish. NBIS broke into Strong Uptrend at 113, above all EMAs with RSI 60 and strong accumulation volume. NVDA at 180.25 has slipped below EMA20/50 (184) and is now between the EMA cluster and EMA200 (174), the coil thesis is approaching its ultimate support.
Leadership narrowed but intensified
XRH0 LN (720), NBIS (113), AIXA (33), and PLTR (151) are the confirmed uptrends with momentum. AIXA is the standout EU semi, Strong Uptrend with +DI at 35.5, the strongest bullish directional reading in the portfolio, though RSI 79 at BB upper demands caution on new entries. FTI (63) and INTC (46) are in Uptrend but lack directional conviction (ADX 30 and 11 respectively). GLD pulled back from 472 to 461, still above EMA50 (452) but MACD has turned bearish, the coiling thesis needs EMA20 (469) reclaim to confirm.
Damage widened significantly
AMZN (208), MSFT (396), META (614) have all fallen back into Strong Downtrend, META’s W2 breakout above the EMA stack has completely reversed. ADBE collapsed to 249, NKE to 54 (RSI 25, StochRSI 0, full capitulation). SOFI at 18 with ADX 40 is in active, strong selling. LULU at 158 and PINS at 18 continued lower. The consumer and mega-cap tech damage is accelerating, not stabilizing.
EU semi update, data restored
ASML, IFX, and AIXA data has been repopulated after last week’s disruption. AIXA (33.04) has surged into Strong Uptrend, above all EMAs with the strongest +DI reading in the portfolio (+DI 35.5 vs -DI 14.9). ASML (1199.80) collapsed 14.3% from W2’s 1400 breakout zone into Repair, above EMA200 (1083) but below EMA20/50/100. IFX (41.55) fell through its entry zone into Repair, below EMA20/50 but above EMA100 (39.76) and EMA200 (37.48). The EU semi picture is now split: AIXA leading, ASML and IFX in repair.
How our trade plans work
Our process is rules-based and level-driven. Every setup is framed around a small number of decision zones: reclaim zones, pullback shelves, breakout triggers, targets, and a clear invalidation level. We act only at defined levels, where downside risk is already known.
We avoid the middle. We do not chase strength. We step aside when structure breaks. Not every dip is a buy. Not every bounce deserves exposure. Cash is a position. Waiting is part of the plan.
This update covers the following 44 stocks and ETFs across consumer, technology, healthcare, industrials, and commodities.
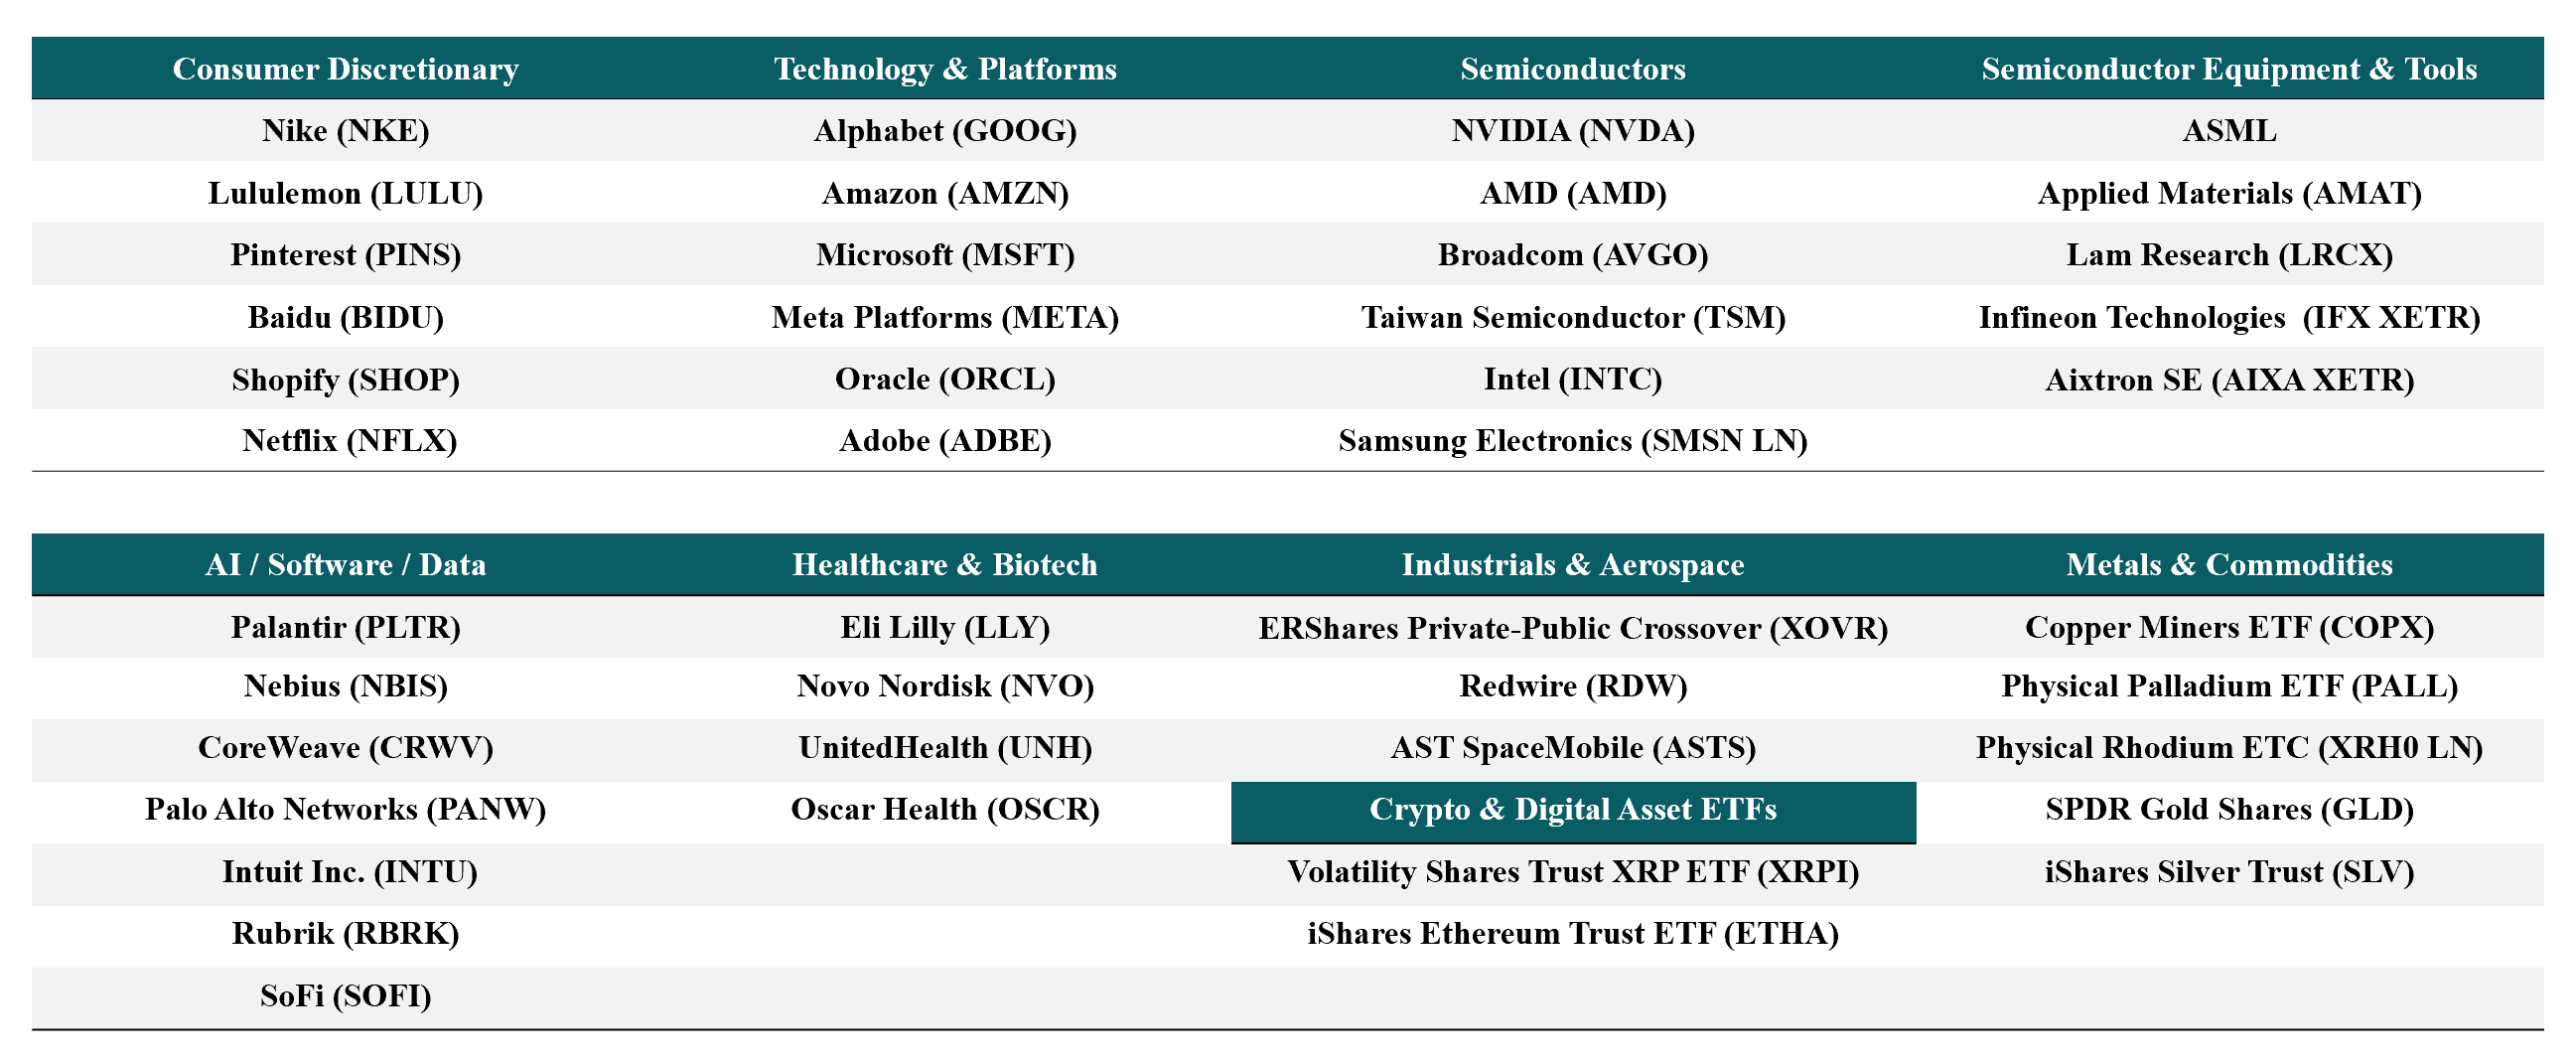
All are evaluated using the same rules-based framework and level-driven process.
What has been working
This week rewarded one thing above all: staying with confirmed trends and avoiding damage zones. XRH0 LN continued its surge to 720, delivering for holders who respected the Strong Uptrend classification. NBIS broke out decisively above all EMAs, the Repair > Strong Uptrend upgrade was the week’s most important regime shift. PLTR held above its EMA200 at 151, confirming the W2 regime flip. On the defensive side, every name classified as Priority-D continued lower. META’s W2 breakout above the EMA stack was a false signal, it has reversed entirely back to Strong Downtrend at 614. NKE hit RSI 25 / StochRSI 0. The names with no structure continued to punish engagement. The lesson: regime shifts require follow-through, not just a single week’s breakout.
In short: confirmed uptrends (XRH0 LN, NBIS, PLTR) continue to reward. False breakouts (META) and damage zones (NKE, LULU, SOFI) continue to punish. Regime first. Follow-through second. Levels third.
This trade plan is based on technical levels and risk framing; full context matters and outcomes are not guaranteed.
Alphabet Inc. (GOOG) Last price: 301.46
Where price is now relative to last week’s plan: W2 framed GOOG as range weakening toward downtrend with 298 as the structural floor and 312-314 as the EMA20/50 reclaim cluster. Price fell to 301.46, down from 303.45. Now below EMA20 (308.08) and EMA50 (311.33), above EMA100 (299.21) and EMA200 (269.60). RSI improved slightly to 40.25 from 38.22, still weak but no longer declining. MACD histogram turned positive at +0.23, the first bullish signal in weeks. ADX at 29.18 with -DI at 27.34 dominating +DI at 16.58. StochRSI at 69.45, bouncing from washed-out levels. The EMA100 at 299 continues to act as the structural floor.
What price action confirmed or challenged
Confirmed: the EMA100 at 299 continues to hold. Price has now tested this level for four consecutive weeks without breaking.
Challenged: MACD histogram turning positive (+0.23) is the first bullish divergence signal. The bounce from 297 area suggests the floor has real demand.
Key decision zones
Support 1: 297-301 (Bollinger lower at 297.40 to current area)
Support 2: 299.21 (EMA100, structural shelf, must hold)
Line in the sand: 269.60 (EMA200)
First reclaim: 308 (EMA20)
Upside checkpoints: 315 (BB upper), then 331 (EMA50)
If already holding: Cautiously improving. MACD turning positive is the first constructive signal since the decline began. However, -DI still dominates. The 308 (EMA20) reclaim is the confirmation level. Manage risk at 297.
If not in the position: MACD positive turn is encouraging but unconfirmed. Wait for daily close above 308 (EMA20 reclaim) for entry, or a definitive hold and reversal at 299 with volume.
Invalidation and thesis-failure rules: Daily close below 299 shifts to full downtrend damage. Stand aside until 308 reclaimed.
Amazon.com, Inc. (AMZN) Last price: 207.67
Where price is now relative to last week’s plan: W2 saw AMZN surge to 216.82, reclaiming the EMA20 at 213 for the first time. That breakout has failed. Price fell to 207.67, down 4.2% from 216.82. Now below EMA20 (212.58), EMA50 (218.72), EMA100 (222.49), and EMA200 (221.19). RSI at 41.33, down from 51.65. MACD histogram still positive at +0.84 but decelerating from W2’s +1.67. StochRSI at 38.31, washed out. ADX at 20.97 with -DI at 29.80 dominating +DI at 20.12.
What price action confirmed or challenged
Confirmed: the W2 EMA20 reclaim was a false breakout. Price rejected at the EMA50/100/200 cluster at 220-224 and reversed.
Challenged: the 207-210 base zone has been revisited. If this floor breaks, the next support is the Bollinger lower at 199.
Key decision zones
Support 1: 199-208 (BB lower to current)
Support 2: 199.44 (BB lower, must hold)
First reclaim: 213 (EMA20)
Next reclaim: 219-222 (EMA50/EMA200 cluster)
Upside: 225+
If already holding: W2 repair failed. The EMA20 breakout was rejected. Manage risk at 199. Bounces into 212-213 are now resistance.
If not in the position: Stand aside. The 207-210 base needs to prove itself again. Requires daily close above 213 for re-engagement.
Invalidation: Below 199 (BB lower) opens significant downside.
Microsoft Corp. (MSFT) Last price: 395.55
Where price is now relative to last week’s plan: W2 noted MSFT approaching EMA20 at 407 with MACD histogram at +3.32. Price fell to 395.55, down 2.4%. Still below EMA20 (405.70), EMA50 (425.57), EMA100 (448.29), EMA200 (459.98). RSI 38.76, down from 44.79. MACD histogram at +2.20, decelerating from W2’s +3.32. StochRSI at 66.34. ADX at 22.87 with -DI at 31.01 above +DI at 19.46.
What price action confirmed or challenged
Confirmed: the EMA20 at 407 was not reclaimed. The 392 base continues to hold.
Challenged: MACD still positive but decelerating. The bounce is losing momentum before reaching the EMA20.
Key decision zones
Support: 387-396 (BB lower to current).
First reclaim: 406 (EMA20).
Next: 426 (EMA50).
Major: 448-460 (EMA100/200).
If already holding: Defence. The 392 floor holds but the bounce is fading. Manage at 387.
If not in: Stand aside until 406 reclaimed.
Invalidation: Below 387 resumes downtrend acceleration.
Meta Platforms Inc. (META) Last price: 613.71
Where price is now relative to last week’s plan: W2 saw META break above the full EMA stack for the first time at 667.73, with +DI crossing above -DI, a confirmed regime shift. That breakout has completely reversed. Price crashed to 613.71, down 8.1%. Now below the entire EMA stack: EMA20 (649.10), EMA50 (654.36), EMA100 (662.13), EMA200 (663.39). RSI collapsed to 35.82 from 54.75. MACD histogram turned deeply negative at -2.74. StochRSI at 20.76, approaching washed out. ADX at 10.98 with -DI at 33.48 dominating +DI at 20.26.
What price action confirmed or challenged
Confirmed: the W2 EMA stack breakout was a false signal. This is the most significant regime reversal of the week, the first credible repair signal in mega-cap tech has been completely invalidated.
Challenged: ADX at 11 shows no trend conviction in either direction. The whipsaw from above-stack to below-stack in one week suggests extreme indecision.
