
Our Trade Plan Update For Week 4 Feb26
Regime awareness, key decision zones, and disciplined risk framing

The regime picture this week is mixed but telling. The broad deterioration that defined Week 3 has not reversed for most mega-cap tech, where names like MSFT, ORCL, ADBE, PINS, and UNH have deepened into strong downtrends with price well below the EMA stack. However, selective improvement has emerged. NVDA broke out of its multi-week compression into a confirmed strong uptrend above all four EMAs. SLV and PALL both upgraded from range/compression to strong uptrends on metals strength. NKE flipped from downtrend to uptrend. LULU shifted into repair mode with strong accumulation. Meanwhile, the semiconductor equipment complex (TSM, ASML, LRCX, AMAT) continues to be the highest-conviction leadership group, with all four names in confirmed strong uptrends and healthy momentum. European tech (IFX GY, AIXA GY) extended its strong uptrend with bullish momentum and healthy ADX. The commodities complex (COPX, GLD, SLV, XRH0 LN) remains constructive. On the other side, CRWV has deteriorated from range to downtrend, INTC shifted from uptrend to range/compression with strong distribution, and LLY moved from uptrend to range/compression. The daily EMA stack remains the primary regime filter. Selectivity remains non-negotiable.

How our trade plans work
Our process is rules-based and level-driven. Every setup is framed around a small number of decision zones: reclaim zones, pullback shelves, breakout triggers, targets, and a clear invalidation level. We act only at defined levels, where downside risk is already known.
We avoid the middle. We do not chase strength. We step aside when structure breaks. Not every dip is a buy. Not every bounce deserves exposure. Cash is a position. Waiting is part of the plan.
Mechanically, the playbook is consistent: If price is above a reclaimed breakout band and holding, the setup is in continuation mode and the job becomes management: trail risk up, respect the reclaimed zone, target the next checkpoints.
If price is inside the range between demand and resistance, the setup is in “no edge” mode and patience is the trade.
If price loses the level that defined the thesis (daily or weekly, depending on the plan), we treat it as invalidation. No rationalizing, no “it will come back.” The framework flips from offense to defense automatically.
The objective is consistency and managing risk.
This update covers the following 35+ stocks and ETFs across consumer, technology, healthcare, industrials, and commodities.
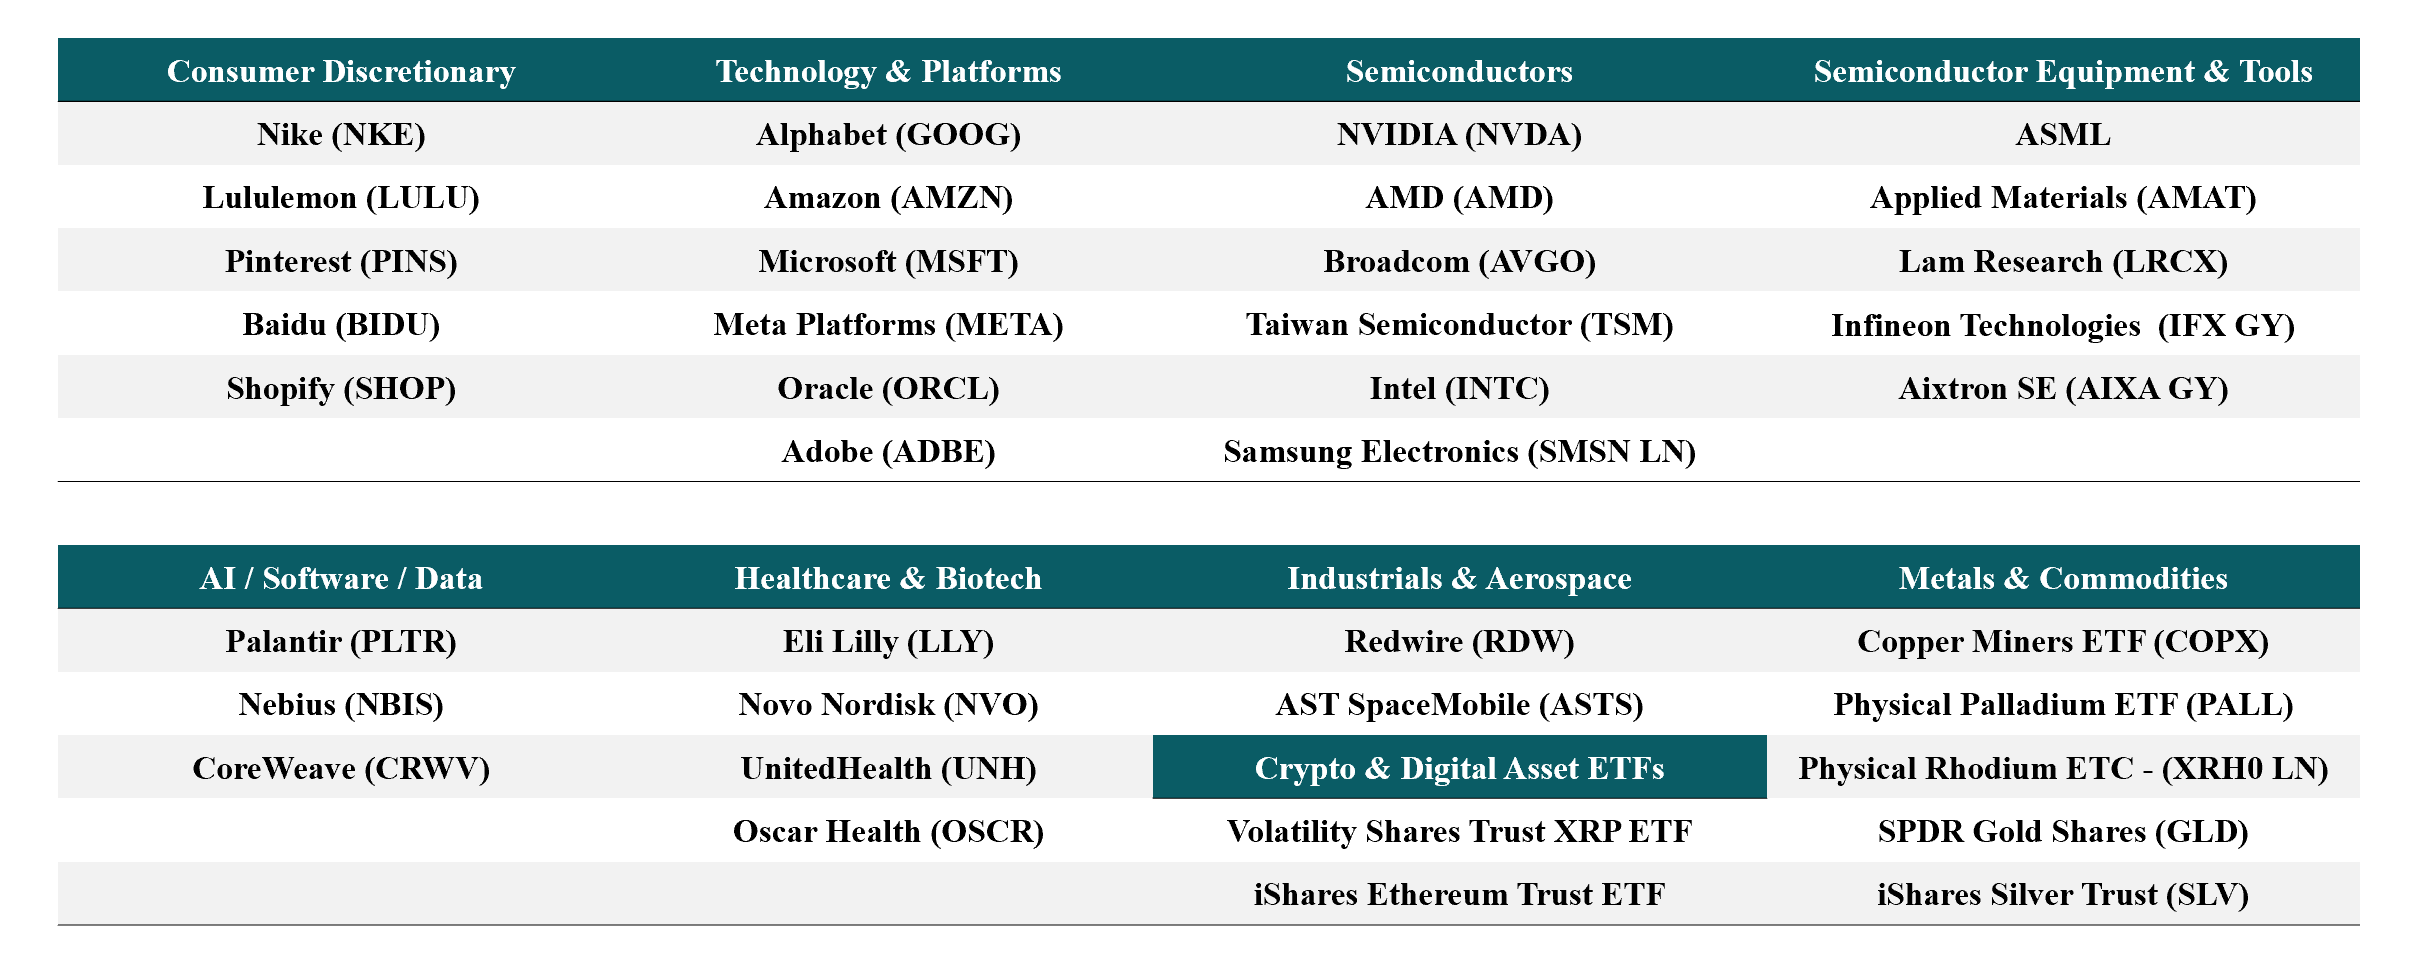
All are evaluated using the same rules-based framework and level-driven process.
What has been working
This week continued to reward discipline around regime classification. The strongest performers remain names that held above the daily EMA stack: TSM, ASML, LRCX, AMAT, IFX GY, AIXA GY, COPX, and GLD have all maintained trend structure, and pullbacks in these names have continued to resolve constructively. NVDA’s breakout above its compression range validated the patience of waiting for a clean signal rather than guessing direction. In metals, SLV’s upgrade from range to strong uptrend confirms that commodity exposure continues to outperform tech on a relative basis. On the defensive side, respecting invalidation levels in ORCL, PINS, and ASTS prevented further drawdowns as those names continued lower. Names in strong downtrends (MSFT, ADBE, NVO, ETHA) have remained unrewarding for early longs, confirming that confirmation-only entries outperform anticipation trades in this environment.
In short; regime discipline, patience at levels, and confirmation-first engagement continue to work.
This trade plan is based on technical levels and risk framing; full context matters and outcomes are not guaranteed.
Alphabet Inc. (GOOG)
Where price is now relative to last week’s plan: Price is at 314.9, up 2.9% from last week’s 306.02. Currently above the EMA100 (297), EMA200 (264) but below the EMA20 (318), EMA50 (316). RSI is 46. Regime unchanged at range / compression.
What price action confirmed or challenged
Confirmed: range conditions persist with no directional edge.
Challenged: directional resolution is needed. The range will break eventually, and the framework requires waiting for that signal.
Key decision zones
Support 1: 296 to 315 (Bollinger lower to mid)
Support 2: 264 (deeper structural floor)
First reclaim: 318 (EMA20)
Upside checkpoints: 352 (Bollinger upper)
If already holding: Range trade. No directional edge until a breakout occurs. Manage risk around the range boundaries.
If not in the position: “No edge” mode. Patience is the trade. Wait for either a range support defense or a confirmed breakout above the EMA20 at 318.
Invalidation and thesis-failure rules: Acceptance below 296 breaks the range floor and increases downside continuation risk.
Amazon.com, Inc. (AMZN)
Where price is now relative to last week’s plan: Price is at 210.11, up 5.7% from last week’s 198.79. Currently below the entire EMA stack (EMA20 216, EMA50 225, EMA100 226, EMA200 223). RSI is 39. Regime unchanged at downtrend.
What price action confirmed or challenged
Confirmed: downtrend pressure persists with price below key EMAs.
Challenged: oversold conditions may produce a reflex bounce, but structure remains broken.
Key decision zones
Support 1: 207 to 210 (current acceptance area)
Support 2: 186 (Bollinger lower)
First reclaim: 216 (EMA20)
Next reclaim: 225 (EMA50)
Upside checkpoints: 225, then 226
If already holding: This is defense mode. Manage risk against the nearest support. Bounces that fail below the EMA20 at 216 remain corrective.
If not in the position: Higher-quality exposure requires either stabilization at current levels with evidence of demand, or a confirmed reclaim and hold above 216. Do not chase bounces inside damage.
Invalidation and thesis-failure rules: Daily acceptance below 186 increases continuation-down risk. Repair thesis is not credible until 216 is reclaimed and held.
Microsoft Corp. (MSFT)
Where price is now relative to last week’s plan: Price is at 397.23, down 1.0% from last week’s 401.32. Currently below the entire EMA stack (EMA20 418, EMA50 445, EMA100 465, EMA200 470). RSI is 32. Regime shifts from downtrend to strong downtrend.
What price action confirmed or challenged
Confirmed: structural damage continues with price well below the EMA stack and bearish ADX confirming trend.
Challenged: RSI at 32 is deeply oversold, which mechanically increases bounce probability, but oversold is not a buy signal inside damage.
Key decision zones
