
Our Trade Plan Update For Week 4, March 2026
Regime awareness, key decision zones, and disciplined risk framing

This week reshuffled the deck. The names that led last week stumbled, and quiet names stepped forward. XRH0 LN, our strongest chart for three consecutive weeks, collapsed from 720 to 975, a 35% decline that shifted it from Strong Uptrend to Downtrend. GLD fell 10% from 460.84 to 413.38, moving from Uptrend to Repair. NVDA slipped from Repair into Downtrend.
The new leadership comes from semiconductor equipment. LRCX rose 7.6% to 228.36 and AMAT gained 4.5% to 357.06. Both are now above their entire moving average stack, upgraded to Strong Uptrend. AIXA continued higher at 33.47 with RSI at 76.6. NBIS held its gains at 117.62. FTI remains steady at 65.26 with all moving averages rising.
The overall picture: 5 confirmed Strong Uptrends. 10 names in Repair or Range. 28 names in Downtrend or worse. The market remains under pressure, but the winners are clearly defined.

How our trade plans work
Our process is rules-based and level-driven. Every setup is framed around a small number of decision zones: reclaim zones, pullback shelves, breakout triggers, targets, and a clear invalidation level. We act only at defined levels, where downside risk is already known.
We avoid the middle. We do not chase strength. We step aside when structure breaks. Not every dip is a buy. Not every bounce deserves exposure. Cash is a position. Waiting is part of the plan.
This update covers the following 44 stocks and ETFs across consumer, technology, healthcare, industrials, and commodities.
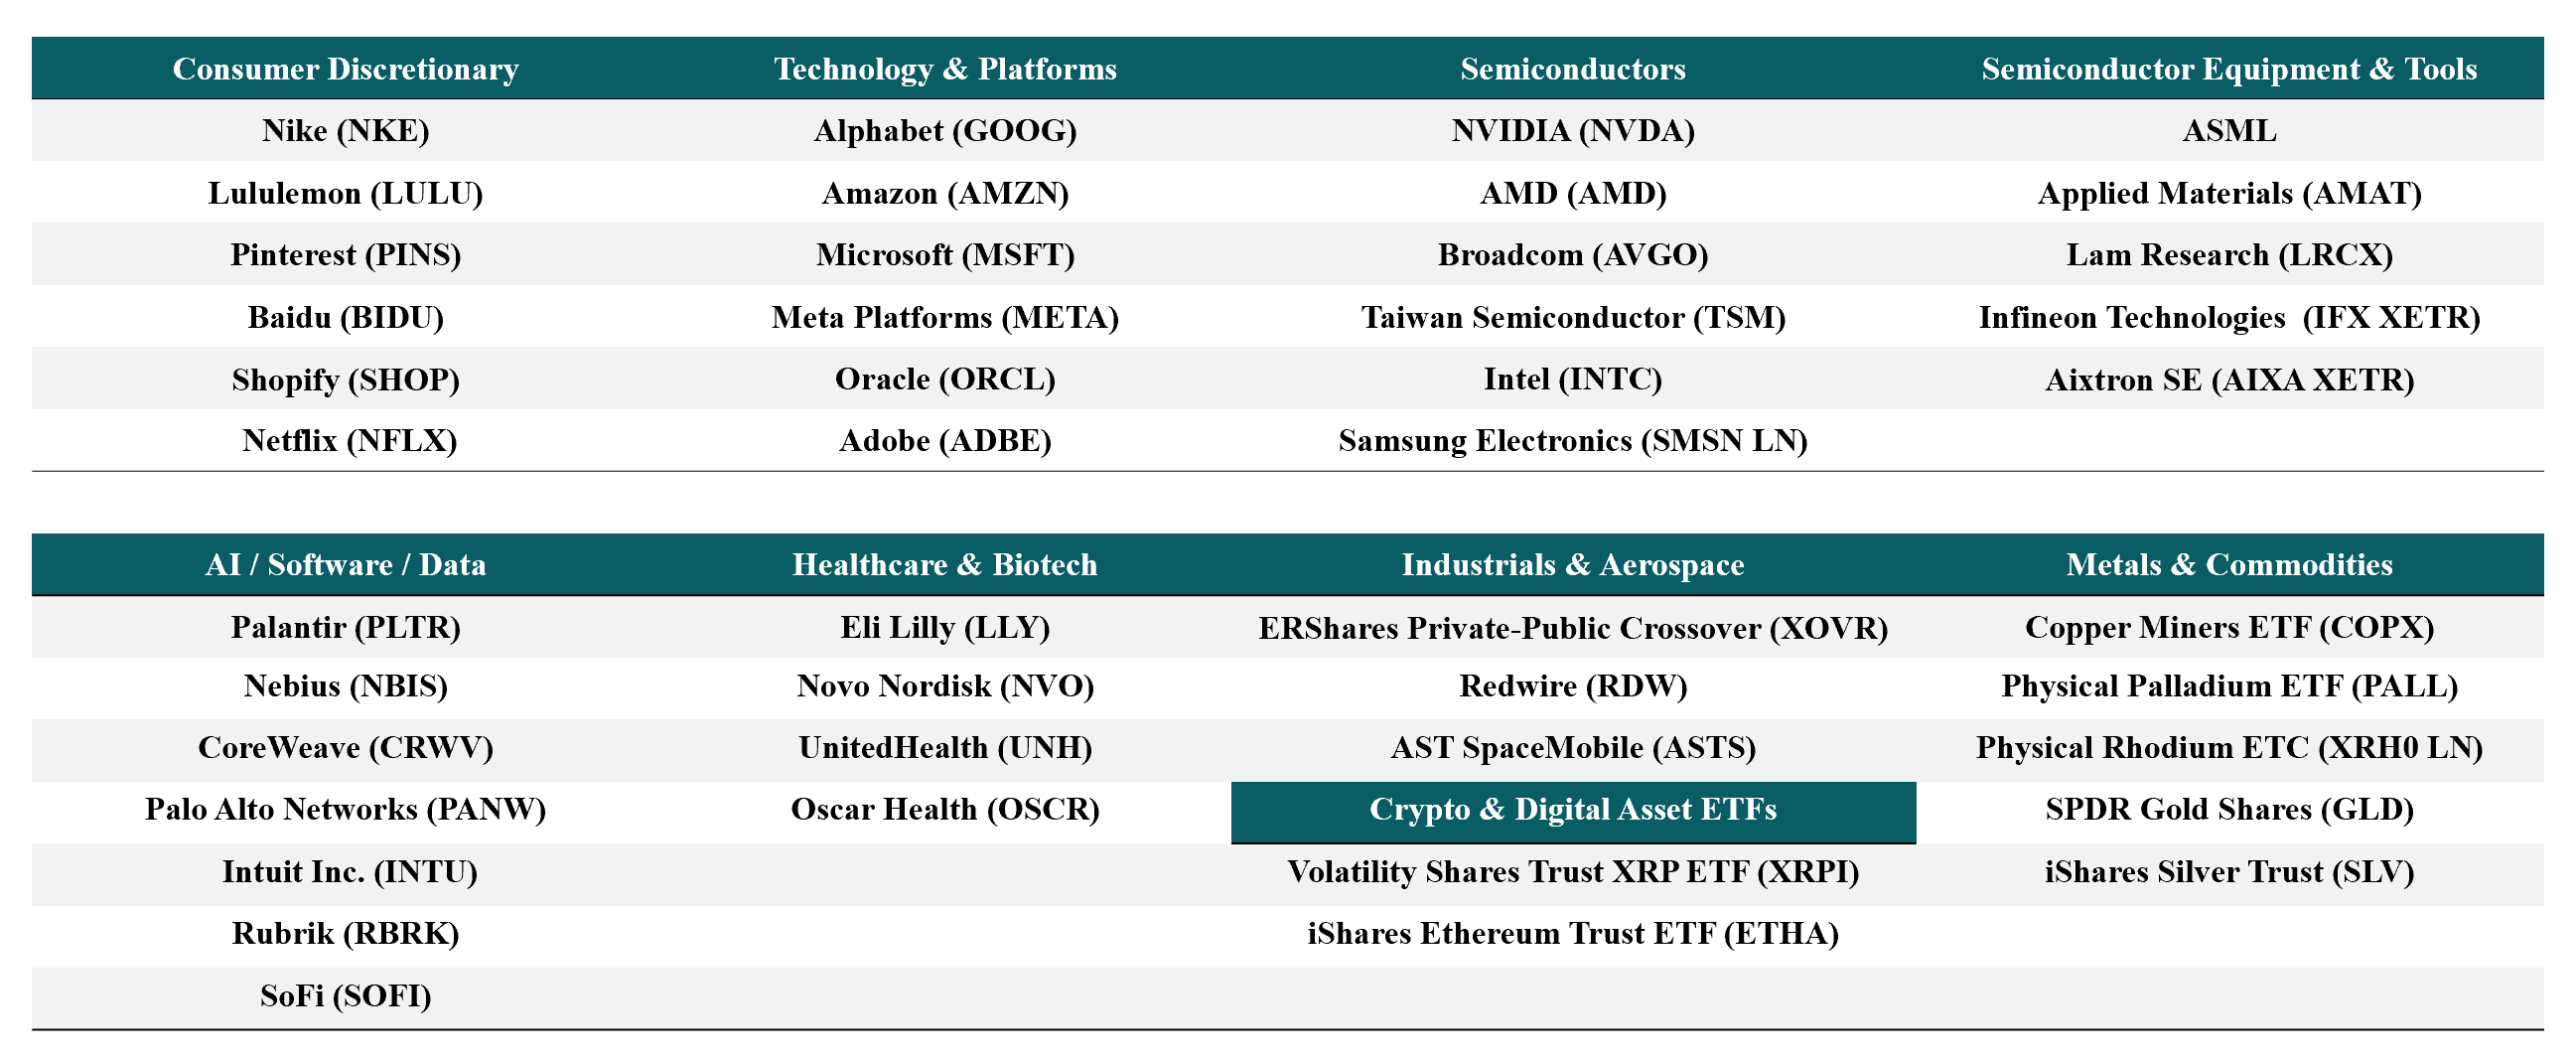
All are evaluated using the same rules-based framework and level-driven process.
What has been working
Trailing stops on XRH0 LN. Our W3 recommendation was to trail to 657 (the Bollinger midband). That discipline meant exiting well above the eventual 975 level. The lesson: trailing stops are not optional, even on the strongest chart in the portfolio.
Staying with semiconductor equipment. LRCX (+7.6%), AMAT (+4.5%), and AIXA (+1.3%) all delivered. These names were flagged in prior weeks as constructive, and the trend has now been confirmed with full moving average stacks pointing higher.
Avoiding damage zones. Every name classified as Stand Aside in W3 either fell further or went nowhere. MSFT (-3.5%), META (-3.3%), NKE (-3%). The discipline of not engaging with broken structure continues to preserve capital.
This trade plan is based on technical levels and risk framing. Full context matters and outcomes are not guaranteed.
Alphabet Inc. (GOOG) Last price: 298.79
Google’s ad business remains the internet’s cash engine, but the stock has been grinding lower as the tech selloff extends.
Where price is now relative to last week’s plan: W3 held the EMA100 at 299 as the structural floor with MACD turning positive for the first time. Price slipped to 298.79 (-0.9%), breaking below that five week shelf. Now below EMA20 (306.71), EMA50 (310.15), and EMA100 (299.74). RSI 39.5. MACD histogram 0.41, still positive. ADX 26.1 with sellers in control.
What price action confirmed or challenged:The EMA100 floor at 299 that held for five consecutive weeks has finally broken. The regime shifts from Repair to Downtrend. The one positive: MACD histogram remains above zero at 0.41. This divergence between weakening price and positive MACD could set up a reversal, but it needs confirmation above 306.71.
Key decision zones:
Support: 297.47 (Bollinger lower band)
Resistance: 306.71 (20 day EMA), then 310.15 (50 day EMA)
Pullback entry: 297.47 to 298.79 if the Bollinger lower holds with a reversal candle
Breakout entry: Daily close above 306.71 (20 day EMA reclaim)
Invalidation: Below 297.47 opens downside toward the 200 day EMA at 271.36
If already holding: The five week floor is gone. Manage risk at 297.47. The 20 day EMA at 306.71 is now resistance, not support.
If already holding: Stand aside. A five week floor breaking is not a buying opportunity. Wait for a daily close above 306.71 for re engagement.
Invalidation and thesis failure: Below 297.47 on closes shifts GOOG into deeper downtrend territory with the 200 day EMA at 271.36 as the next reference.
GOOG lost its longest standing support. MACD positive keeps a sliver of hope, but price has to prove it. Patience.
Amazon.com, Inc. (AMZN) Last price: 205.37
Consumer spending uncertainty and cloud scrutiny continue to weigh on Amazon’s near term direction.
Where price is now relative to last week’s plan: W3 confirmed the W2 EMA20 reclaim was a false breakout. Price fell further to 205.37 (-1.1%). Below the full moving average stack: EMA20 (211.49), EMA50 (217.15), EMA100 (221.31), EMA200 (220.69). RSI 40.6. MACD bullish at 0.19. StochRSI 18.5, washed out.
What price action confirmed or challenged: Downtrend confirmed. Price remains trapped below the full EMA stack with no recovery signal. StochRSI washed out at 18.5 suggests near term selling may be exhausting, but a bounce within a downtrend is not a buy signal.
Key decision zones:
Support: 203.57 (Bollinger lower)
Resistance: 211.49 (20 day EMA)
Pullback entry: Not applicable in current regime
Breakout entry: Daily close above 211.49
Invalidation: Below 203.57 accelerates downside
If already holding: Defense. Bounces toward 211.49 are resistance. Manage risk at 203.57.
If already holding: Stand aside until the 20 day EMA at 211.49 is reclaimed and held.
Invalidation and thesis failure: Below 203.57 with no nearby support.
AMZN remains in Downtrend. The false W2 breakout taught us that one week of recovery is not a regime change.
Microsoft Corp. (MSFT) Last price: 381.87
AI spending remains Microsoft’s growth narrative, but the stock continues to break lower, well beneath its long term trend.
Where price is now relative to last week’s plan: W3 noted the EMA20 at 407 was not reclaimed. Price fell to 381.87 (-3.5%). Now below the full stack: EMA20 (400.1), EMA50 (419.49), EMA100 (442.95), EMA200 (456.5). RSI 32.1. MACD bearish at -0.28. ADX 23.9 with sellers in control.
What price action confirmed or challenged: Strong Downtrend persists. MACD has turned negative, removing the last positive signal from W3. StochRSI at 3.2 is washed out, suggesting near term selling pressure may ease, but the structure remains broken.
Key decision zones:
Support: 382.14 (Bollinger lower)
Resistance: 400.1 (20 day EMA)
Pullback entry: Not applicable
Breakout entry: Daily close above 400.1
Invalidation: Below 382.14
If already holding: Full defense. MACD turning negative removes the lifeline. Manage at 382.14.
If already holding: Stand aside. Below the full moving average stack with MACD now bearish. No entry until 400.1 reclaimed.
Invalidation and thesis failure: Below 382.14 accelerates the decline.
MSFT is in active damage. MACD flipping bearish is a deterioration from W3. Stand aside.
Meta Platforms, Inc. (META) Last price: 593.66
Meta continues to invest heavily in AI infrastructure. The stock has given back its W2 breakout entirely and then some.
Where price is now relative to last week’s plan: W3 confirmed META’s W2 EMA stack breakout was a false signal. Price fell further to 593.66 (-3.3%). Strong Downtrend. Below all EMAs. RSI 32.5. MACD bearish at -5.23. StochRSI 4.6, deeply washed out. Strong distribution on volume.
What price action confirmed or challenged: The decline continues. META is now well below the EMA stack with no structural support until the Bollinger lower. StochRSI at 4.6 is deeply washed out. A reflex bounce is possible but would be corrective, not structural.
Key decision zones:
Support: 599.45 (Bollinger lower)
Resistance: 634.31 (20 day EMA)
Pullback entry: Not applicable
Breakout entry: Daily close above 634.31
Invalidation: Below 599.45
If already holding: Damage continues. Any bounce into 634.31 is a chance to reduce, not add. Manage at 599.45.
If already holding: Do not engage. The W2 false breakout followed by continued decline makes this untouchable until the EMA20 is reclaimed and held for multiple sessions.
Invalidation and thesis failure: Below 599.45 opens further downside.
META in Strong Downtrend with strong distribution. The lesson from W2’s false breakout: single week reclaims mean nothing without follow through.
NVIDIA Corp. (NVDA) Last price: 172.7
The AI chip leader is testing patience. The coiling thesis from prior weeks has resolved to the downside.
Where price is now relative to last week’s plan: W3 framed NVDA in the PDF Entry 2 zone at 180.25 with EMA200 at 174 as the hard line. Price fell to 172.7 (-4.2%). Now below EMA20 (182) and EMA50 (183.72). RSI 37.8. MACD bearish at -0.84. Strong distribution on volume. ADX 17.3.
What price action confirmed or challenged:The regime has shifted from Repair to Downtrend. The coiling thesis from W2/W3 has resolved bearishly. Price is below the 20 and 50 day EMAs with strong distribution. The 200 day EMA at 174.64 remains the last structural reference.
Key decision zones:
