


Palantir went from $66 in April 2025 to $207 in November 2025, then spent 6 months giving back a third of that move. As of 2026-05-18 the stock closed at $135.14, down 35% from the November all-time high and up 104% from the April panic low. The peculiar thing about this drawdown is that nothing in the operating business broke. The latest reported quarter put up $1.63B of revenue at 85% year-on-year growth, with net income up 307% and a 53% net margin for the quarter. The multiple has done all the damage, not the fundamentals.

Key Takeaways
PLTR is the rare megacap correcting on multiple compression, not earnings. Trailing 12-month revenue $5.22B, net margin 43.7%, free cash flow $2.69B (FCF margin 51.5%), debt almost zero. The growth is still accelerating.
The drawdown is sharp but contained. Spot $135.14 is 35% below the November $207 high but still up 104% from the April $66 low. The weekly trend has rolled over and daily price sits below all 4 major moving averages.
Q1 2026 was the strongest print in years. Revenue $1.63B (up 84.7% YoY), net income $871M (up 307%), diluted EPS $0.34. Q1 net margin was 53.3%, gross margin 86.8%. This isn’t a slowdown story.
Valuation is still extreme. Computed trailing P/E 136x, forward P/E 65x, price-to-sales 62x, EV/EBITDA 159x. Even after a 35% drawdown, the multiple is at a level where any miss compresses fast.
One number decides the setup. $122 daily close. That’s the April daily low. Above it, the correction is healthy. A daily close below confirms a lower-low and the de-rating extends.
PLTR: The Operating Line Keeps Accelerating
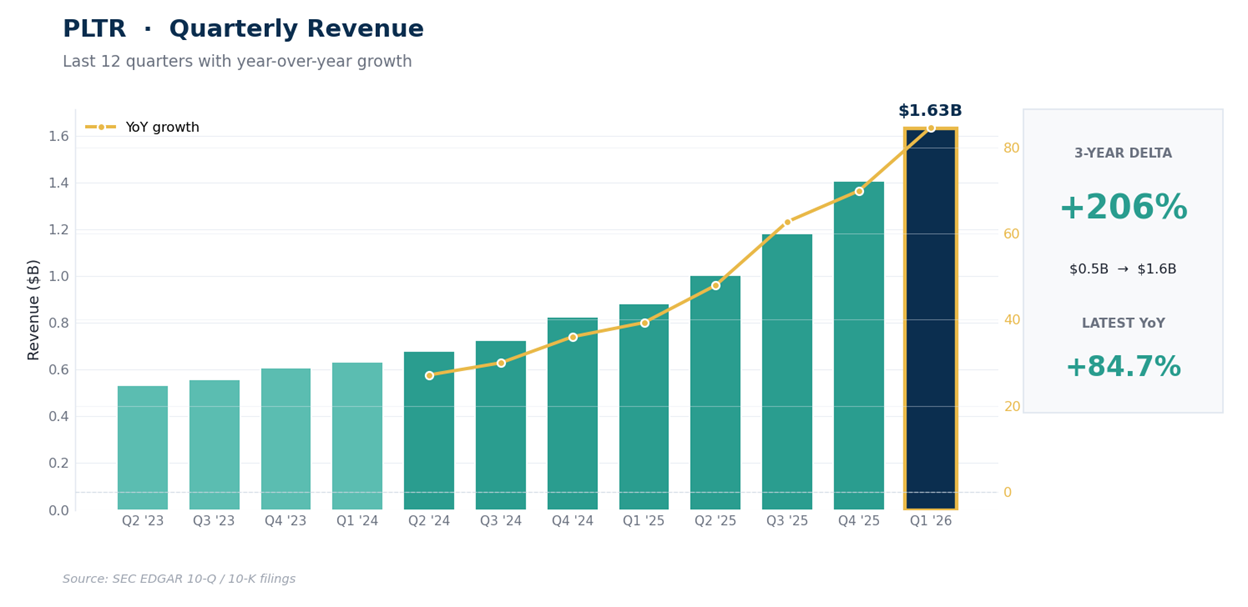
Palantir’s last 12 quarters trace one of the cleanest revenue accelerations in software. Revenue went from $533M in Q2 2023 to $1.63B in Q1 2026, a 3.1x in 3 years, with the year-on-year growth rate climbing from the high teens to 85% over that window.
Latest reported quarter print: revenue $1.63B (up 84.7% reported), net income $871M (up 307% reported), diluted EPS $0.34. The quarterly margin stack tells the story even better: gross margin 86.8%, operating margin 46.2%, net margin 53.3%. One important caveat on that 53% net margin: it sits well above the 46.2% operating margin because of below-operating-line items (interest income on the big cash pile, tax benefits, gains on investments).
Don’t model 53% as the new run-rate. The defensible margin to underwrite is the 46% operating line, with everything below it treated as windfall rather than baseline. Each of the last 4 reported quarters has shown year-on-year growth accelerating from 48% to 63% to 70% to 85%.
The fundamentals are what make this drawdown puzzling. Trailing 12-month revenue $5.22B, net income $2.28B, operating cash flow $2.72B, free cash flow $2.69B (FCF margin a remarkable 51.5%). TTM gross margin 84.1%, net margin 43.7%, EBITDA margin 38.6%. Return on equity 32.6%. Balance sheet is debt-free in any meaningful sense (total debt $212M is just capital-lease obligations, debt-to-equity 0.025).
Cash and short-term investments $8.03B at quarter end. Current ratio 6.91 means current assets are nearly 7 times current liabilities (the balance sheet is mostly cash). Beta 1.52 (the stock moves about 50% more than the market on any given day, which matters for position sizing). Computed trailing P/E 136x, forward P/E 65x, price-to-sales 62x.
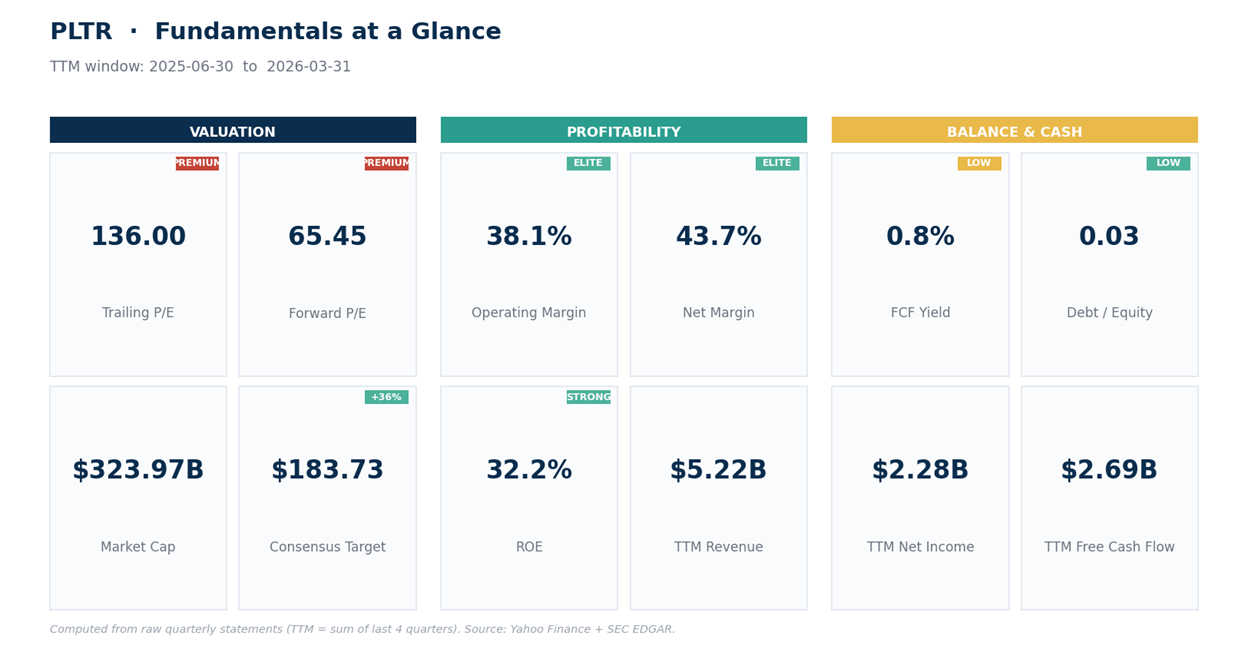
Consensus target $183.73 mean across 31 analyst opinions (1 strong buy, 18 buy, 10 hold, 1 sell, 1 strong sell). Median target $200, high $255, low $70. The bear case sits in that $70 low target, and it’s the same bear case the market is currently expressing: that 62x sales is unsustainable regardless of how strong the operating numbers look.
The Technical Setup
The weekly trend has rolled over. PLTR printed an all-time high of $207.52 on 2025-11-03 (the post-Q3 2025 earnings rip), spent November and December chopping in the high $180s to low $200s, then corrected from $200 to $122 over 4 months.
Last close $135.14. Weekly EMA20 $146.45, EMA50 $143.88, EMA200 $85.45 (EMA is exponential moving average, a trend gauge that reacts faster than a plain average).
The 200-week is far below price because the multi-year trend is still up, but the 20-week and 50-week have curled and crossed below spot, which is the visible weekly damage. Weekly RSI 43.5 is neutral-to-weak, not panic.
Weekly MACD line -6.15 below signal -4.89, with the histogram -1.26 (sellers still have momentum, but the downside push has flattened). Weekly Bollinger %B 0.30 (price sits in the lower part of its weekly volatility band, not stretched).
Weekly ADX 24.3 means a real trend exists but is losing strength. +DI 11.8 vs -DI 23.2 means sellers are still in charge on the weekly timeframe.
The daily tells a more interesting story. Daily close $135.14 sits below all 4 major EMAs (EMA20 $137.89, EMA50 $142.50, EMA100 $148.61, EMA200 $148.20).
The short and intermediate averages have rolled below the longer ones (20 < 50 < 200 < 100, with EMA100 still narrowly above EMA200), so the daily trend has weakened without the 200-day fully decaying below the 100-day.
That’s a mature pullback inside a longer up-cycle, not yet a regime change. RSI 45.0 is neutral, not yet oversold. MACD line -2.70 below signal at -2.34, histogram -0.36 (negative but very small, the down-move has flattened). Bollinger %B 0.31 puts price in the lower part of its daily volatility band, not extended.
ATR $6.01 means a normal day swings about $6, so traders can size to that. ADX 12.5 says there’s no strong directional trend on the daily right now, just chop. +DI 20.1 vs -DI 28.3 (sellers in front, but only modestly).
Williams %R -69.4 (lower-middle of its 14-day range, not yet washed out). Support clusters at $128 (lower daily Bollinger Band), $122 (the April 10 daily low), then weekly support comes in around $115. Resistance is the EMA cluster $138 to $148, then $162 (the March 24 swing high), then $183 (analyst mean), then $207 (the all-time high).
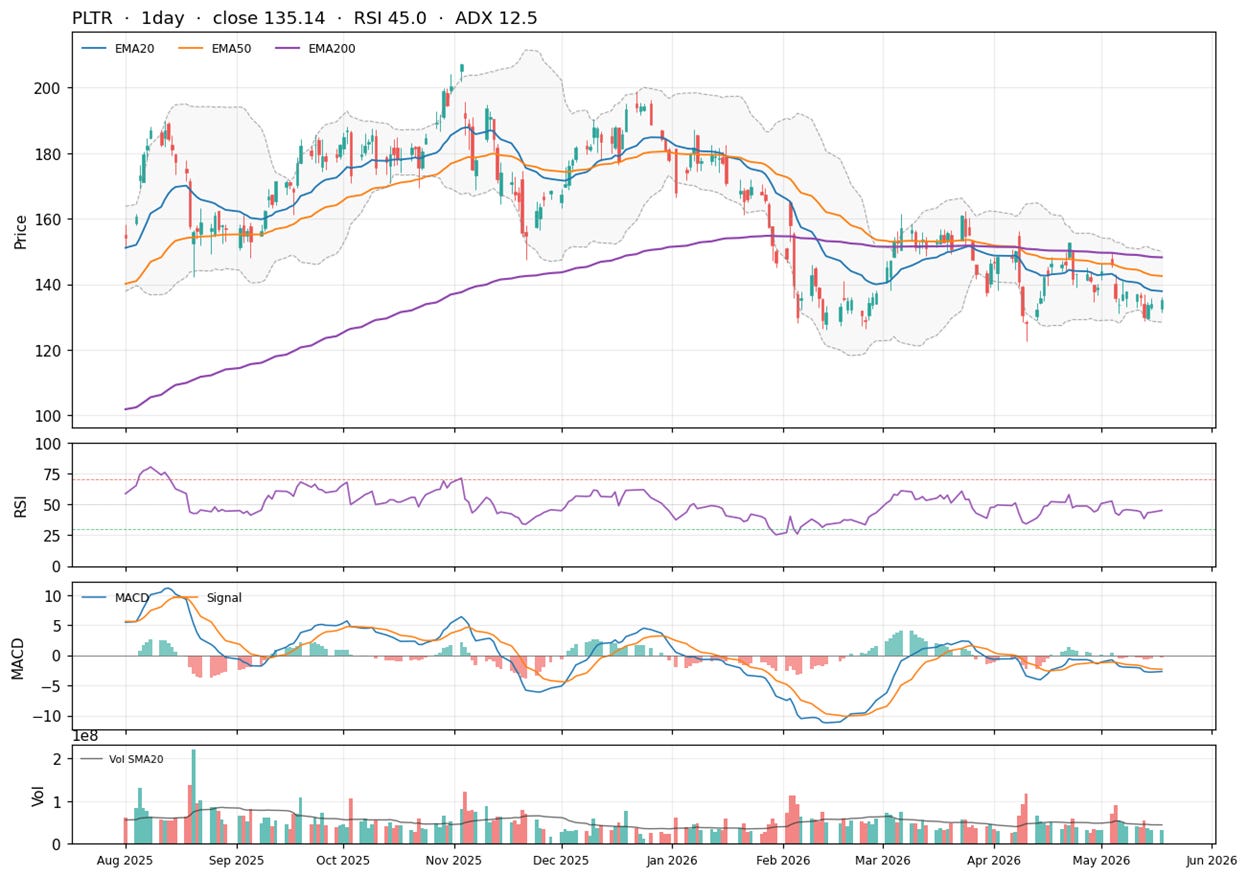
Net read: the weekly trend is broken on its short and intermediate EMAs but the long-term structure is intact. Daily $122 is the line that separates “healthy 35% correction” from “lower-low and the de-rating extends.” A weekly close above $150 reclaims the broken structure and opens the conversation about $162, then $183, then $207. The next earnings print is Monday 2026-08-03, 76 days out. That’s runway to add or wait, not a wall.
How to act on it?
