


The AI story isn’t only about who designs the chips. Someone has to buy those chips in bulk, rack them in data centers, wire them to power, and rent the compute by the hour. That business has a name now, the neocloud, and 2 of its loudest stocks are Nebius and CoreWeave.
Both let you bet on that demand without guessing which model wins. But if you put them side by side, you’re looking at 2 genuinely different risk profiles wearing the same growth story.
One is small, pricey, and cash-rich. The other is large, cheaper on sales, and leveraged to the hilt. Let’s see where the reward actually lines up with the risk.

Key Takeaways
Nebius is the balance-sheet play. Revenue grew 684% YoY in the March quarter off a tiny base, and the company holds roughly as much cash as debt. You pay for that safety, though: the stock trades near 60x sales.
CoreWeave is the scale play. It books $2.08B of revenue a quarter, up 112% YoY, and more than $6B over the past year, roughly 7x Nebius. Even so, it’s cheaper at 9x sales. The catch is about $35B of total debt, leases included, and thin liquidity.
Watch the profit story on both. Nebius shows a reported net profit, but it comes from a one-time asset sale, not from renting compute; the operating line still loses money. CoreWeave earns positive cash flow before depreciation and interest, then heavy depreciation and a big interest bill drag it to a net loss.
The price action diverges. Nebius is in a clean uptrend near its record high. CoreWeave is in a correction, well off its high and leaning on support.
Ranking them today: Nebius for trend and safety, CoreWeave for value and scale, neither for the faint of heart.
The smaller, stronger-looking one first.
Nebius: Tiny Revenue, Cash-Rich Balance Sheet
Nebius came out of the old Yandex breakup with cash, a clean listing, and a plan to build compute capacity across Europe and the US. The growth has been violent off a small base. Quarterly revenue went from $100.7M to $146.1M to $227.7M, then to $399M in the March quarter, up 684% YoY. Trailing 12-month revenue now sits near $878M. Gross margin runs around 74%, which tells you the underlying rental economics are healthy once the boxes are full.
Here’s the part you can’t skip. Nebius reported a net profit of about $621M in the March quarter, but the operating line still lost $128M. The black ink came from a one-time gain of about $781M on the sale of investments, not from renting out GPUs.
So don’t read that profit as a sign the core business has turned; it hasn’t yet. What has turned is the balance sheet. The company holds roughly $9.4B in cash against $9.6B in debt, near enough to neutral, with a current ratio above 8, meaning it can cover short-term bills many times over.
Free cash flow ran deeply negative over the past year as it pours money into build-out, but with that cash pile, it can fund the expansion without begging the market.
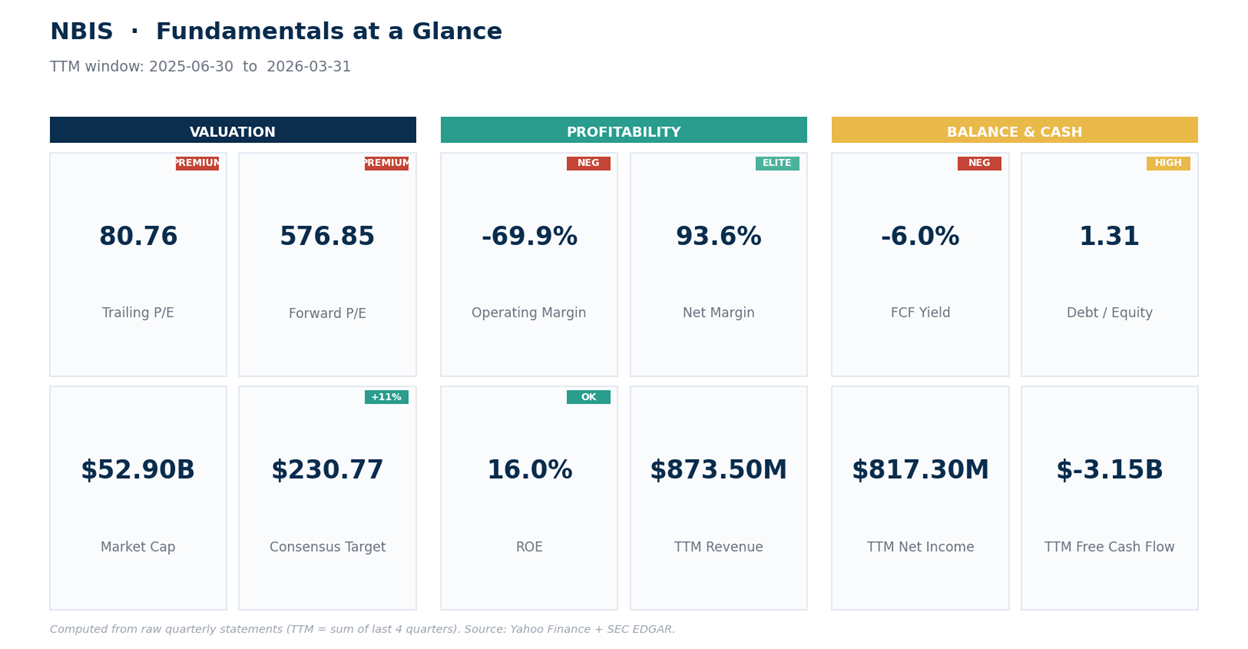
What you don’t get is a cheap entry. At around $208 the shares trade near 60x sales, and earnings multiples are meaningless here because the profit isn’t operational. For context, the desk leans positive with a mean target near $231, but that’s supporting color, not the reason to act. The trend decides that.
On price, Nebius is in command. The stock sits above its 20-, 50-, and 200-day averages (near 192, 163, and 113) and has more than quadrupled off its 52-week low near 35. RSI, a momentum gauge that runs 0 to 100, sits at a firm 60, and ADX, a trend-strength reading where above 25 means a real trend rather than chop, is up at 36.8 with buyers (+DI) well ahead of sellers (-DI), so the pressure stays on the upside. Momentum cooled a touch this week, a normal breather inside a strong uptrend. The level overhead that matters is the record high near 234.
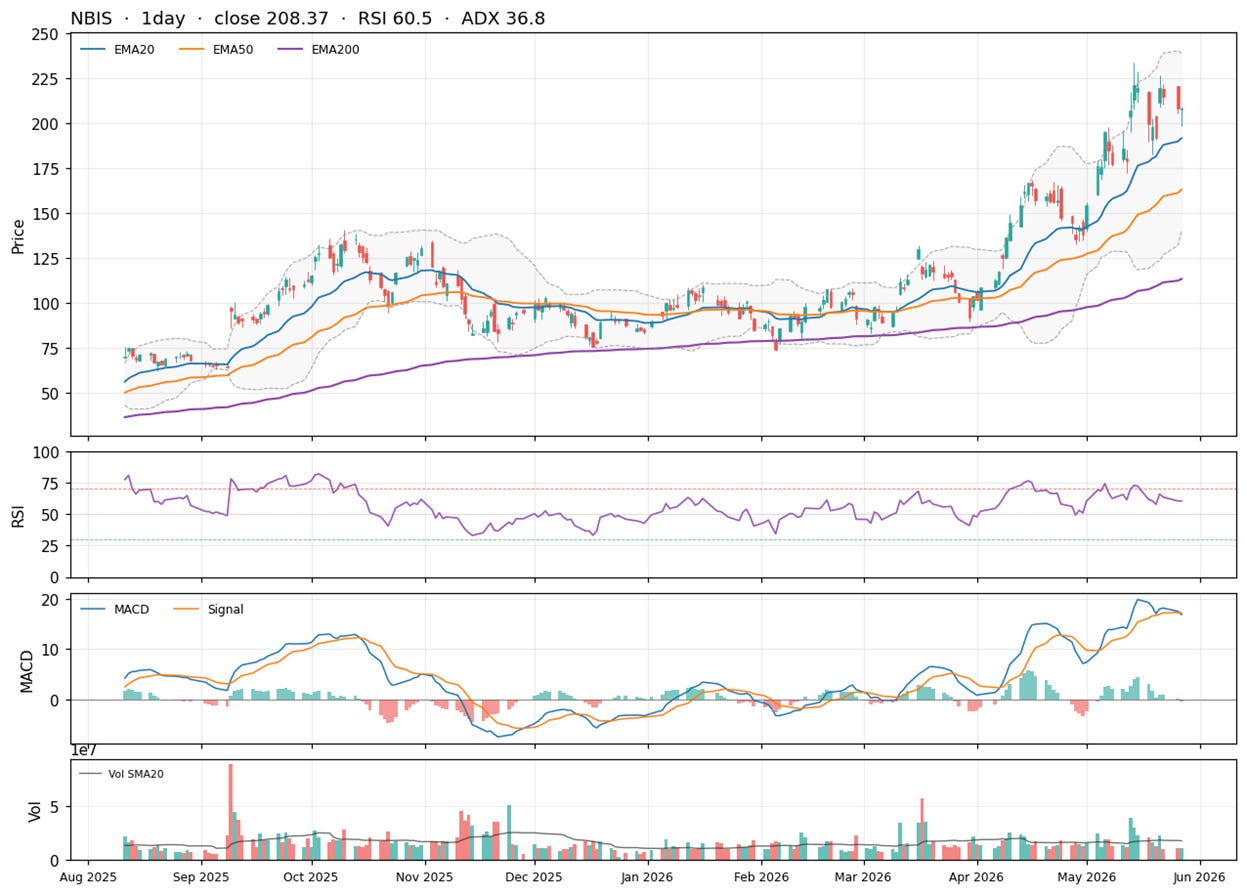
Net read: Nebius is the safer balance sheet and the better-behaved stock, but you’re paying a nosebleed multiple for a business that doesn’t yet make operating money. The trend says don’t fight it; the valuation says don’t chase it. A pullback toward the rising 20-day is the entry that respects both.
Now the bigger one with the heavier load.
CoreWeave: Scale, Cash Earnings, and a Mountain of Debt
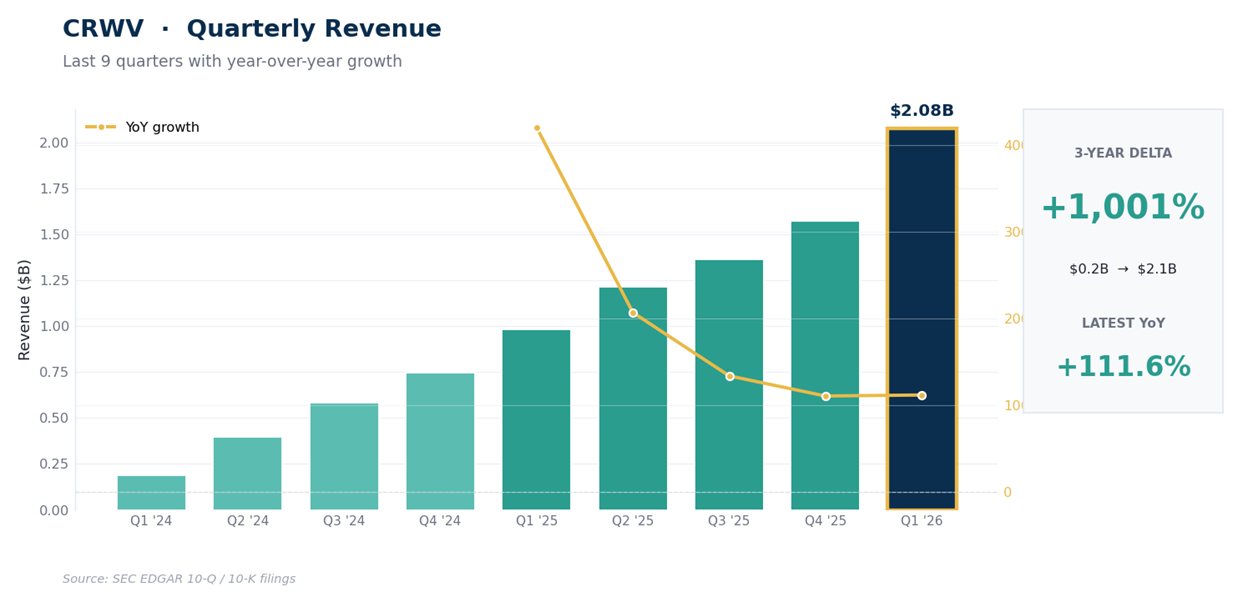
CoreWeave is the giant of the pair. It rents GPU clusters to the biggest names in AI under long contracts, and its revenue dwarfs Nebius. The ramp has been steep: quarterly revenue climbed from $1.21B to $1.36B to $1.57B, then to $2.08B in the March quarter, up 112% YoY. Over the trailing 12 months the business pulled in $6.23B. Gross margin sits near 66%, a touch below Nebius but on far more volume.
The profit story splits 2 ways. EBITDA, a rough cash-earnings proxy that strips out depreciation and interest, ran positive at about $3.02B over the past year, a 49% margin. That’s the bull case the company keeps pointing to, that margins inflect higher as more power capacity comes online. The trouble sits below that line.
Depreciation of roughly $1.15B over the March period outran the $1.03B of EBITDA it earned, pushing operating income to a $144M loss, and then $536M of interest on the debt dragged the bottom line to a $740M net loss. That gap is widening as the build-out accelerates. The balance sheet is the real worry.
Total debt runs about $35B, which includes roughly $10B of finance leases on its data-center gear, more than 7x equity; net of cash it’s around $23B. With only $2.3B of cash and a current ratio of 0.31, short-term bills outweigh short-term assets, so the company is funding its land grab with borrowed money.
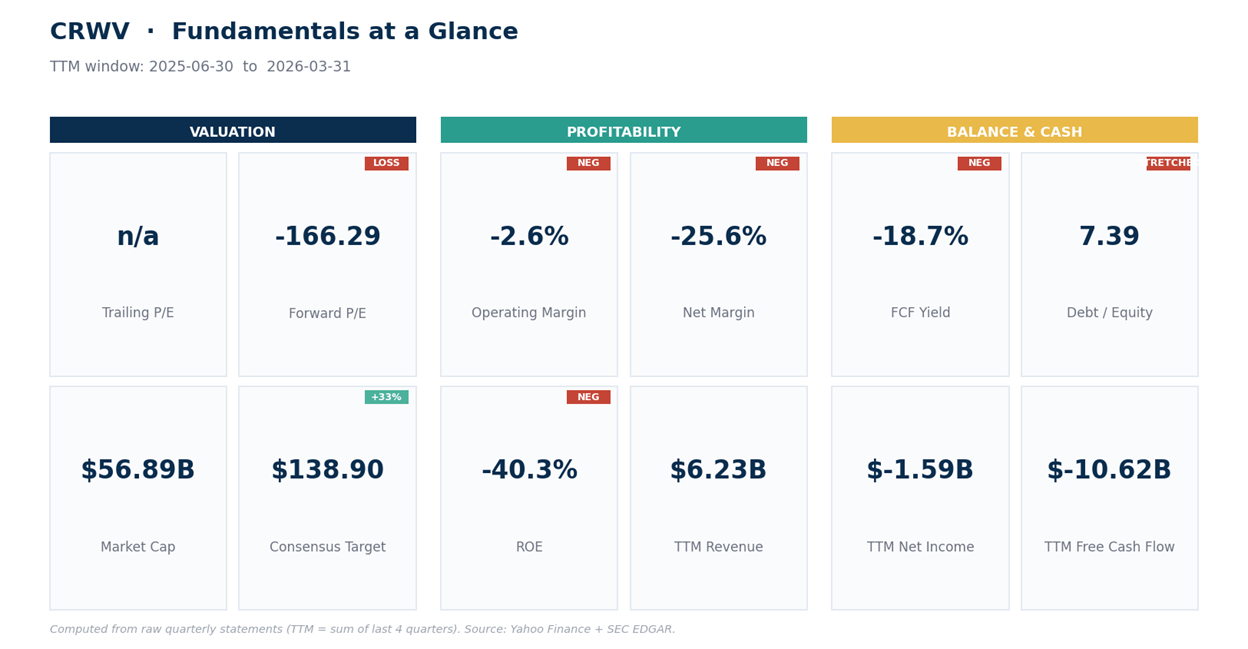
On valuation, CoreWeave is the cheaper name where it counts: near 9x sales and about 30x EV/EBITDA, versus 60x sales for Nebius. There’s no meaningful price-to-earnings figure since it loses money at the bottom. The 34 analysts covering it lean buy, mean target near $139, but their range runs from $36 to $295, which tells you the Street can’t agree on what this is worth.
Price action is the soft spot. At around $104 the stock sits below its 20-day average (near 109), on its 50-day (near 105), and above its rising 200-day (near 97), well off the 187 high it set earlier this year. RSI reads a weak 46 and ADX at 15 signals no real trend, just chop, with sellers (-DI) modestly ahead of buyers (+DI). Soft, but leaning on support rather than breaking it.
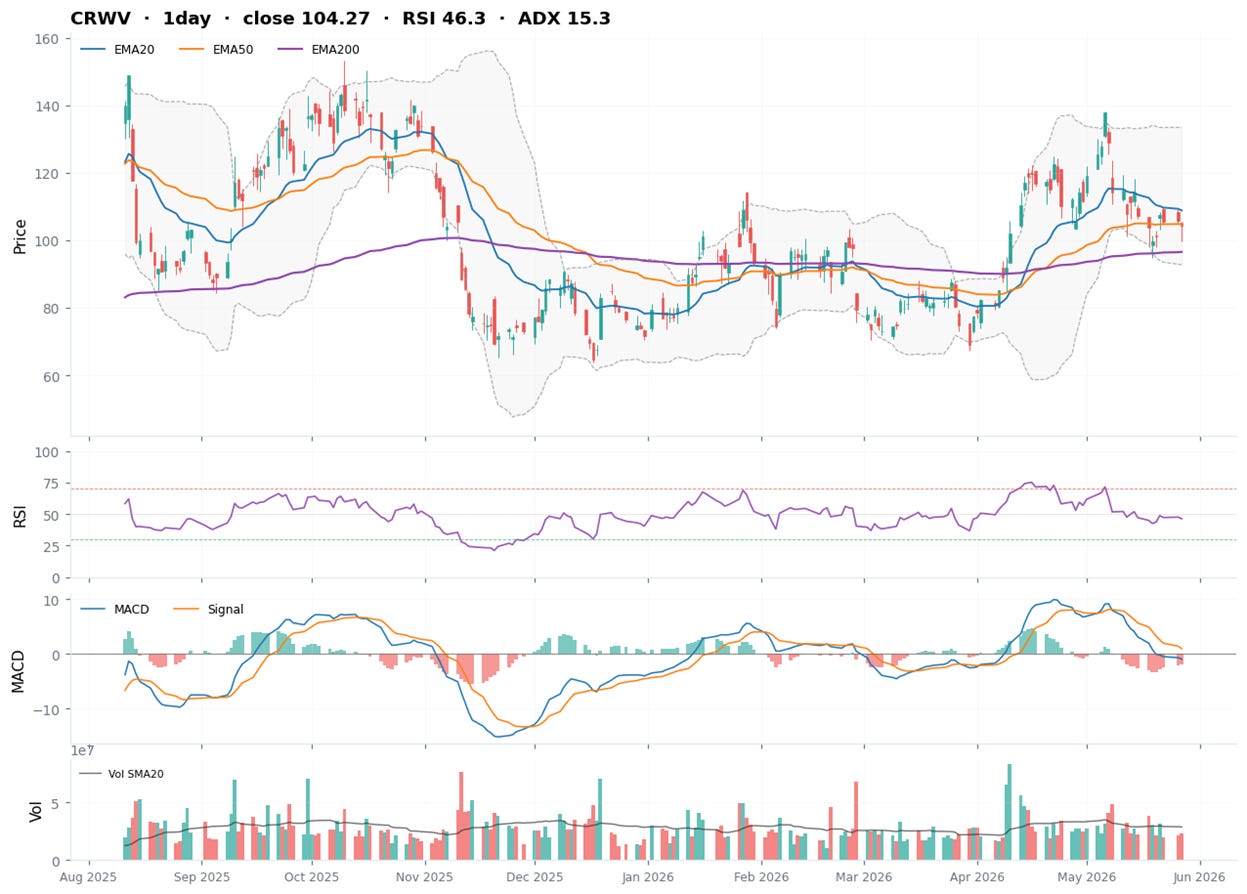
Net read: CoreWeave gives you 7x the revenue at a sixth of the sales multiple, and it’s already EBITDA-positive. But that debt load is real, the bottom-line losses are widening, and the trend is corrective. This is a value-and-scale bet that needs the margin inflection to show up before the interest bill swamps it.
Our Trade Plan
These are 2 different setups, so treat them differently. Nebius is a trend-pullback name; CoreWeave is a support-and-confirm name.
