
Pinterest: The Overlooked Ad-Tech Platform With Real Upside
AI shopping tools, high-margin growth, and a 600M-user ecosystem are reshaping Pinterest’s long-term investment narrative.

PINS 0.00%↑ is in an attractive asymmetry window where outlook, fundamentals, valuation, and technical structure finally align. The company continues to deliver solid revenue growth, expanding ARPU and users, rising engagement, and more than $1 B in annual free cash flow.
After a long year of underperforming on earnings, Pinterest has taken a beating. That’s why today, the stock trades at a low multiple after conservative guidance reset expectations.
But, with a net-cash balance sheet, high-margin ad model, and accelerating adoption of AI-powered shopping and performance ads, the underlying business is significantly stronger than the recent drawdown suggests, and it could be an attractive time to enter.
Full trade plan below.

Key Takeaways
Company Positioning: Pinterest is evolving from a visual discovery app into an AI-powered shopping and performance-advertising platform, with a strategic niche built around high-intent users.
Growth Outlook: The company’s pivot toward AI-led recommendations, automated ad products (Performance+), and deeper commerce integrations positions it for multi-year improvement in monetization efficiency.
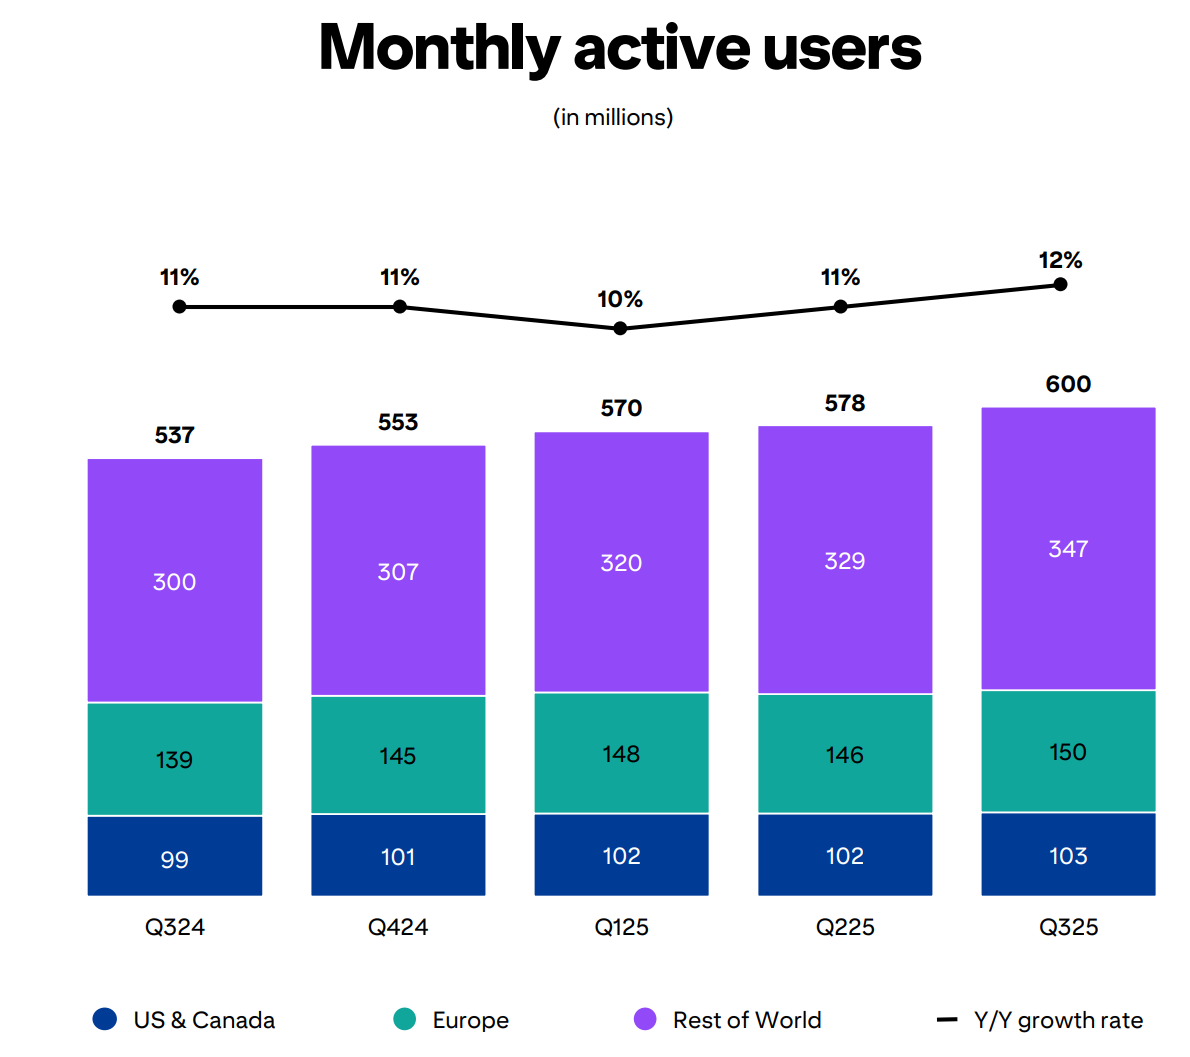
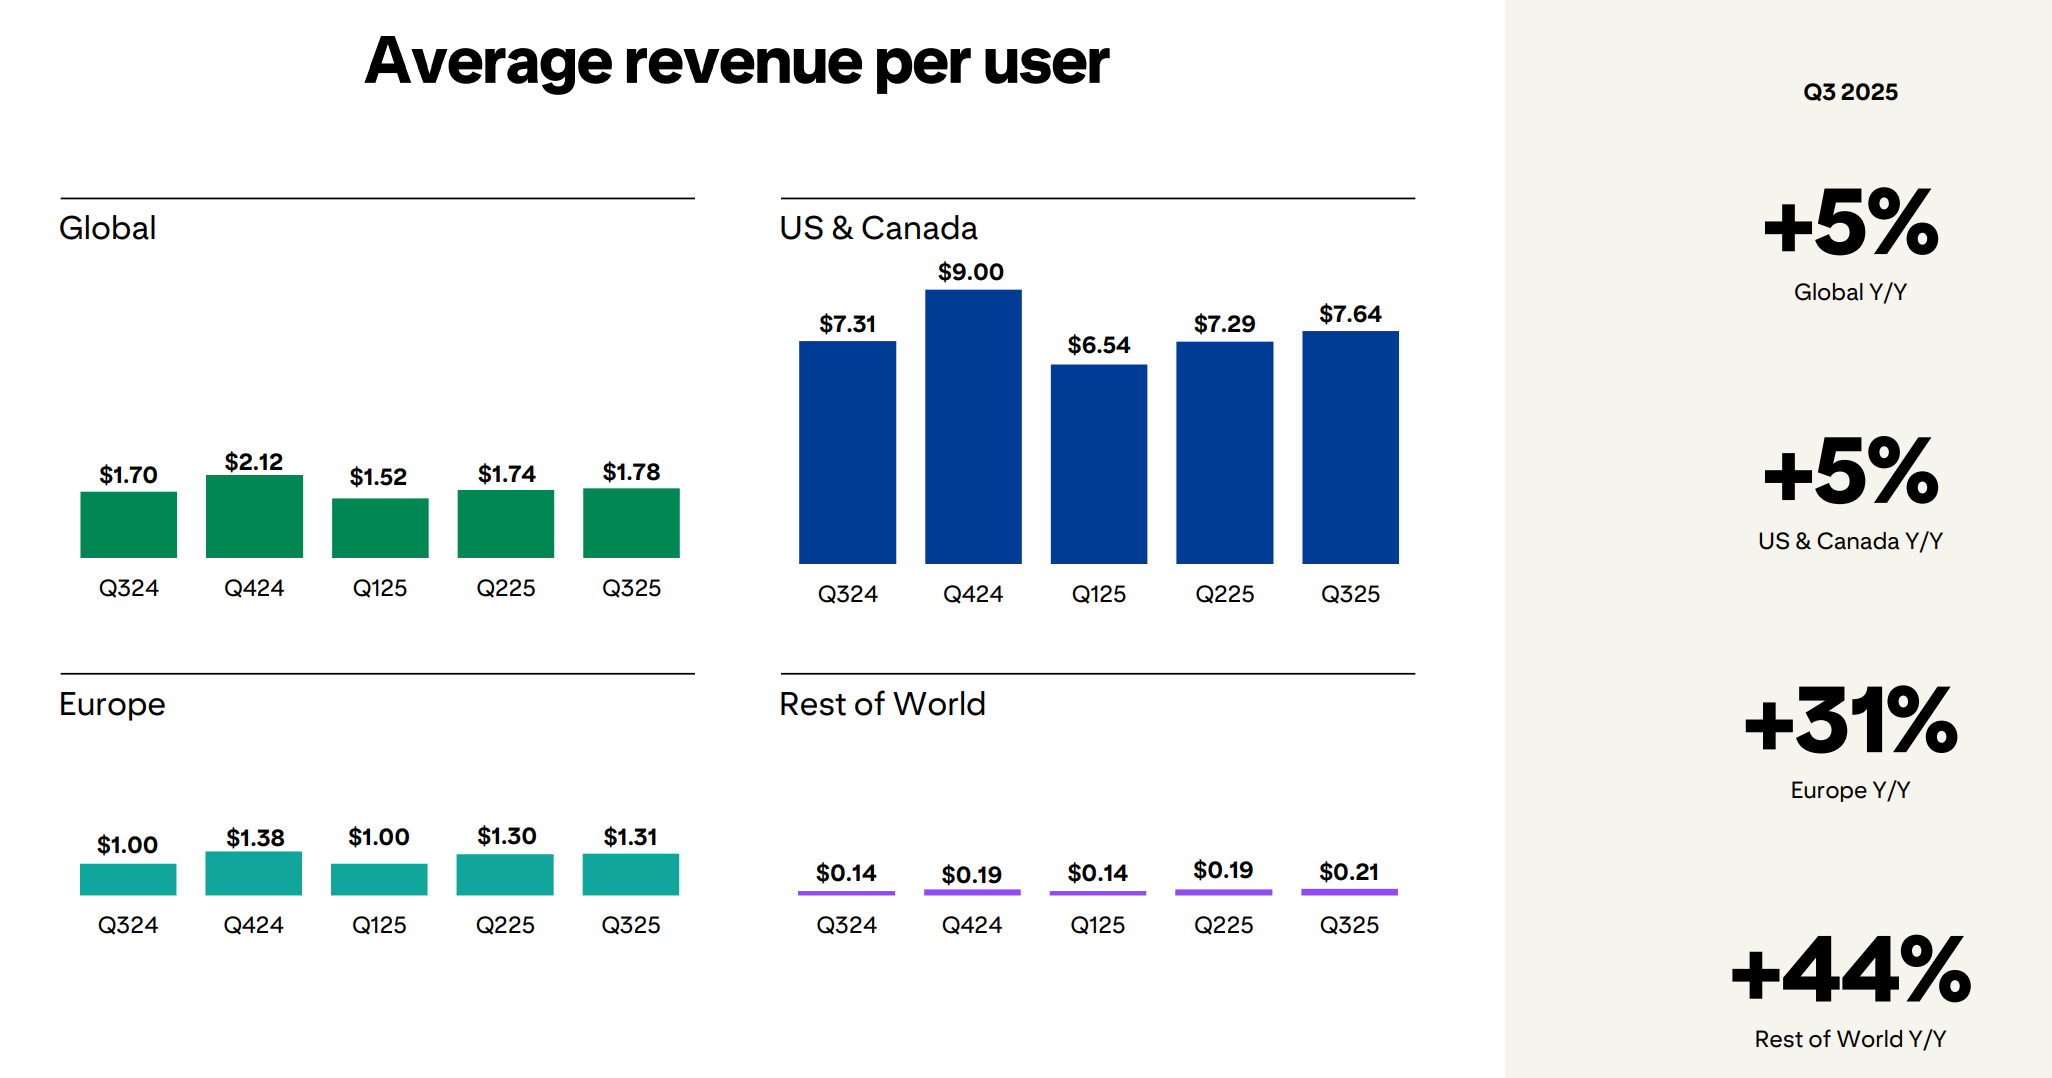
Users & ARPU: With 600M MAUs and strong growth in Europe and Rest of World, Pinterest’s largest runway lies in lifting international ARPU, where monetization is still a fraction of U.S. levels.
Financial Profile: Mid-teens revenue growth, expanding margins, and >$1B in annual free cash flow give Pinterest a high-quality financial base that contrasts with its “prove-it” valuation.
Valuation: At ~9x P/E and ~14x EV/FCF, PINS trades well below peers despite a net-cash balance sheet and improving profitability, creating meaningful long-term upside potential.
Technical Structure: A completed correction, rising higher lows, and a multi-timeframe bullish impulse suggest the stock has formed a durable support line in the $23–26 zone.
Sentiment Reset: Post-earnings volatility has reset expectations, leaving the stock in a position where incremental execution on AI shopping, ARPU expansion, or advertiser spend can trigger a significant rerating.
Trade Appeal: With defined risk below $25.2 and natural upside above $30, the setup offers a favorable risk/reward profile supported by both fundamentals and technical confirmation.
Company Overview
Pinterest PINS 0.00%↑ is a visual discovery and shopping platform. Users come to plan their lives (home, fashion, beauty, travel, food) and increasingly to act on those ideas with a purchase. That planning intent is the core of the business model: PINS 0.00%↑ monetizes via ad units embedded in the feed and search results, where advertisers pay for high-intent clicks and conversions rather than passive impressions.
The monetization engine is still heavily skewed to mature markets. In Q3 2025, almost 80% of it’s > $1 B revenue came from U.S. & Canada, around 90% from Europe, and 1% from Rest of World. Global MAUs reached 600 million (+12% YoY), with the largest incremental growth from Rest of World (+16% MAUs), where ARPU is only $0.21 vs $7.64 in U.S./Canada. Europe sits in the middle at $1.31 ARPU but is growing fastest on a % basis (+31% YoY).
Strategically, management is repositioning Pinterest from a static mood board into an AI-powered shopping assistant. That means three things for the model:
More intent-driven search and recommendations (80B+ quarterly queries per external coverage) feeding performance ads
Deeper commerce integrations (e.g., Amazon and retail partners) to tighten the loop from inspiration to checkout
A heavier mix of automated, goal-based ad products (Performance+) that reward conversion rather than raw reach
Competitive positioning sits between classic social (Meta, TikTok, Snap) and commerce-first platforms (Amazon, Shopify’s ecosystem). Pinterest’s edge is its “lean-in” planning use case and a user base that skews female and Gen Z, with high propensity to spend in home, fashion, and beauty categories. The risk is obvious: platforms with larger scale and more mature ad stacks are chasing the same commerce budgets.
Major News
Q3 2025 print: growth + profitability, but guidance discipline
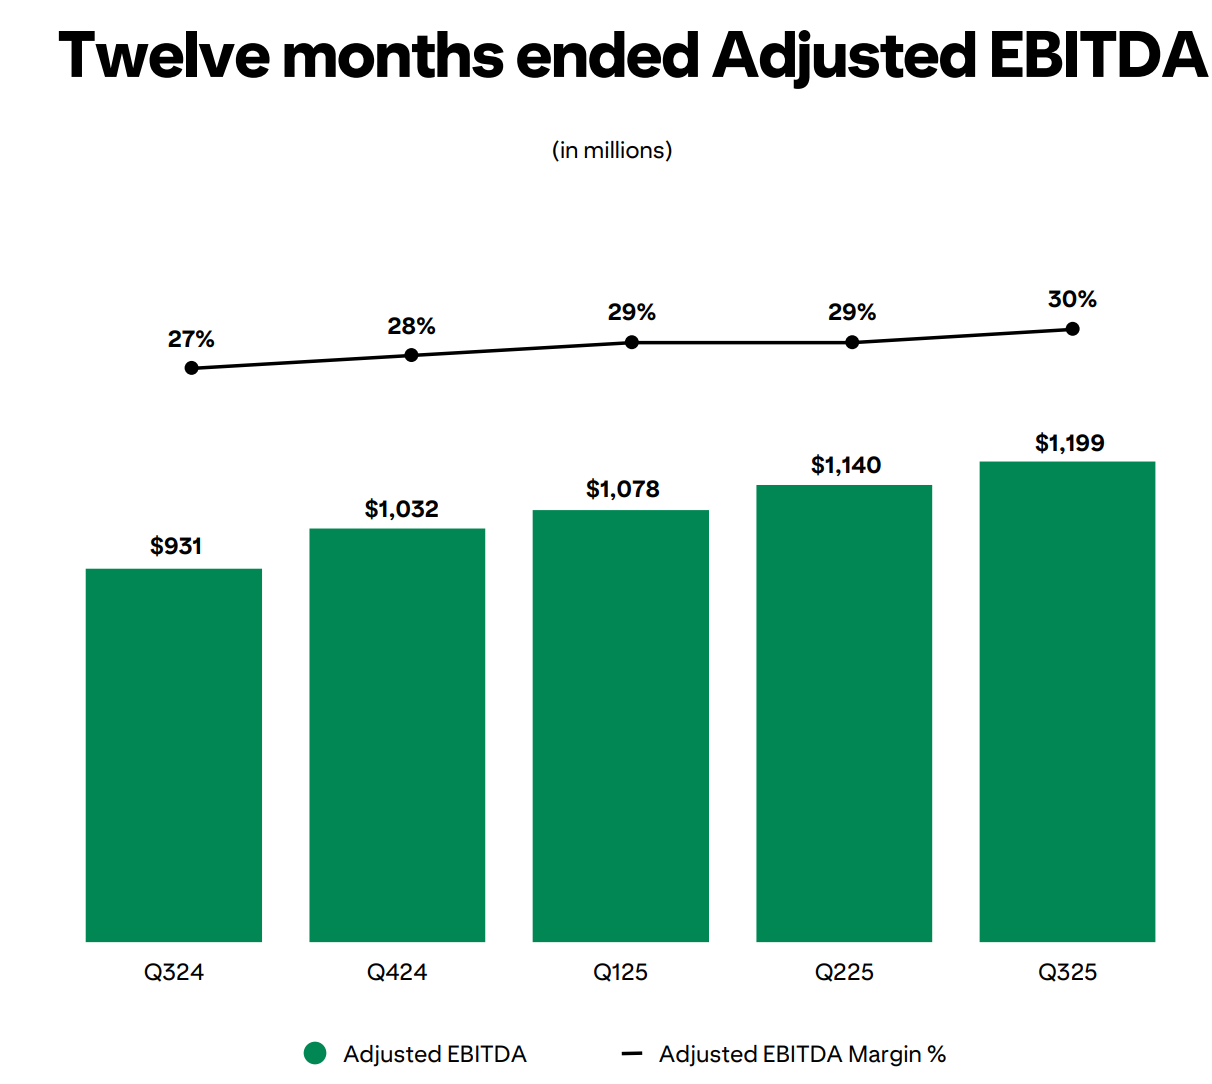
Q3 2025 revenue grew 17% YoY to $1.05 B, with global MAUs at a record 600 million and global ARPU up 5%. Adjusted EBITDA came in at $306 M, a 29% margin vs 27% a year ago. Free cash flow was $318 M, up 30% YoY, confirming the model’s ability to print cash even while Pinterest invests aggressively in AI and product.
On the outlook side, Q4 2025 guidance calls for $1.313 - $1.338 B in revenue (+14 to16% YoY) and Adjusted EBITDA of $533 - $558 M. That’s still healthy double-digit top-line growth with very strong profitability, but it came in below a market that was positioned for a more aggressive acceleration post-AI pivot. The result: a strong fundamental quarter that nonetheless triggered a de-rating as investors refocused on EPS delivery and ad-pricing pressure rather than just MAU and FCF strength.
AI shopping assistant and ad stack upgrades
Management is leaning into the AI-powered visual shopping assistant narrative. Product work here includes: smarter search and recommendations, auto-generated idea feeds when users open the app, and the Performance+ ad suite which simplifies campaign setup and pushes more spend into automated, conversion-optimized formats. Externally reported metrics such as a ~40% increase in outbound clicks and rising adoption of Performance+ suggest the stack is working for both users and advertisers, even as ad pricing compresses due to mix shift toward international markets.
Institutional and insider flow
Recent filings show incremental institutional accumulation, with large asset managers adding PINS 0.00%↑ on weakness, while insiders have been modest net sellers over the last 90 days.
The latest earnings confirm Pinterest as a high-growth, high-margin, cash-generative platform, but softer-than-hoped guidance and ad-pricing pressure have put the stock in the penalty box just as it leans hardest into AI shopping. The forward pipeline is less about splashy new products and more about proving that the AI assistant, Performance+ ads, and international rollout can translate record engagement into durable ARPU and EPS growth.
Fundamental Analysis
Revenue and earnings trends
PINS 0.00%↑ has become a steady growth performer. TTM revenue sits at roughly $4.06 B vs $3.65 B in 2024, $3.06 B in 2023 and $2.80 B in 2022, a ~12% CAGR since 2021. The step-up from 2023 to 2025 reflects both MAU growth and better monetization of shopping and performance ad surfaces.
Operating income flipped from losses in 2022–23 to $180 M in 2024 and ~$280 M TTM.
Margins and profitability
GAAP gross profit TTM is ~$3.24 B on $4.06 B revenue, an ~80% gross margin profile that has held steady over time. That confirms the underlying ad/commerce model is structurally high-margin.
Operating expenses remain the swing factor. TTM opex is ~$2.96 B, yielding an operating margin of ~7% vs about 5% in 2024 and negative in 2022–23. On a management-defined basis, Adjusted EBITDA margins run much higher (high-20s in recent quarters) once stock-based comp and certain R&D/AI investments are backed out, which aligns better with the 27–28% free-cash-flow margin discussed below.
PINS 0.00%↑ already runs like a high-gross-margin software asset with improving operating leverage. The gap between GAAP and economic margins is wide, but the direction is positive and supports a rerate if management can hold Adjusted EBITDA margins in the high-20s while sustaining mid-teens growth.
Balance sheet health and leverage
The balance sheet is a clear strength. As of 9/30/25:
Total assets: ~$5.52 B
Cash and equivalents: ~$2.67 B
Total liabilities: only ~$0.69 B
Total debt (largely lease obligations): ~$205 M
Common equity: ~$4.82 B
Working capital: just over $3.1 B
Net cash is roughly $2.47 B, and tangible book value is ~$4.72 B, very close to total equity, which means minimal goodwill/intangibles. The firm is effectively unlevered, with no need for external funding to support AI or commerce initiatives.
Balance sheet risk is minimal. PINS 0.00%↑ runs a net-cash, asset-light model with ample liquidity and room to keep buying back stock while investing in AI, which supports a higher risk tolerance on the long side.
Cash flow quality and guidance
On a cash basis, the story is cleaner than GAAP earnings:
TTM operating cash flow: ~$1.15 B
TTM capex: only ~$25 M
TTM free cash flow: ~$1.12 B
That is a FCF margin of ~28% on $4.06 B of revenue. The gap between GAAP net income and CFO is almost entirely non-cash.
Q4 revenue guidance of $1.31–$1.34 B implies 14 to 16% YoY growth with strong Adjusted EBITDA.
Free cash flow is real, recurring and growing. GAAP noise aside, Pinterest converts a high share of revenue into cash, which is the core underpinning of any long thesis here.
Valuation vs peers
At a share price in the mid-$20s, the market is paying roughly:
P/E (TTM) ~9x
Forward P/E ~16x
Price/sales (TTM) ~4.5x
EV/EBITDA ~51x
EV/FCF ~14x
The optics are important. On a simple P/E screen, PINS 0.00%↑ looks cheap: 9x vs a U.S. interactive media average around 18x and tech sector averages above 30x. On EV/Revenue and EV/FCF, the stock trades at a modest premium to slower-growth ad names but a discount to high-growth commerce platforms.
The outlier is EV/EBITDA, which screens expensive because GAAP EBITDA is suppressed by stock comp and heavy investment. For a model that is already generating nearly $1.2 B of FCF, EV/FCF in the mid-teens anchored to low- to mid-teens revenue growth and expanding margins looks more relevant than the GAAP EBITDA multiple.
Technical Analysis
Weekly chart
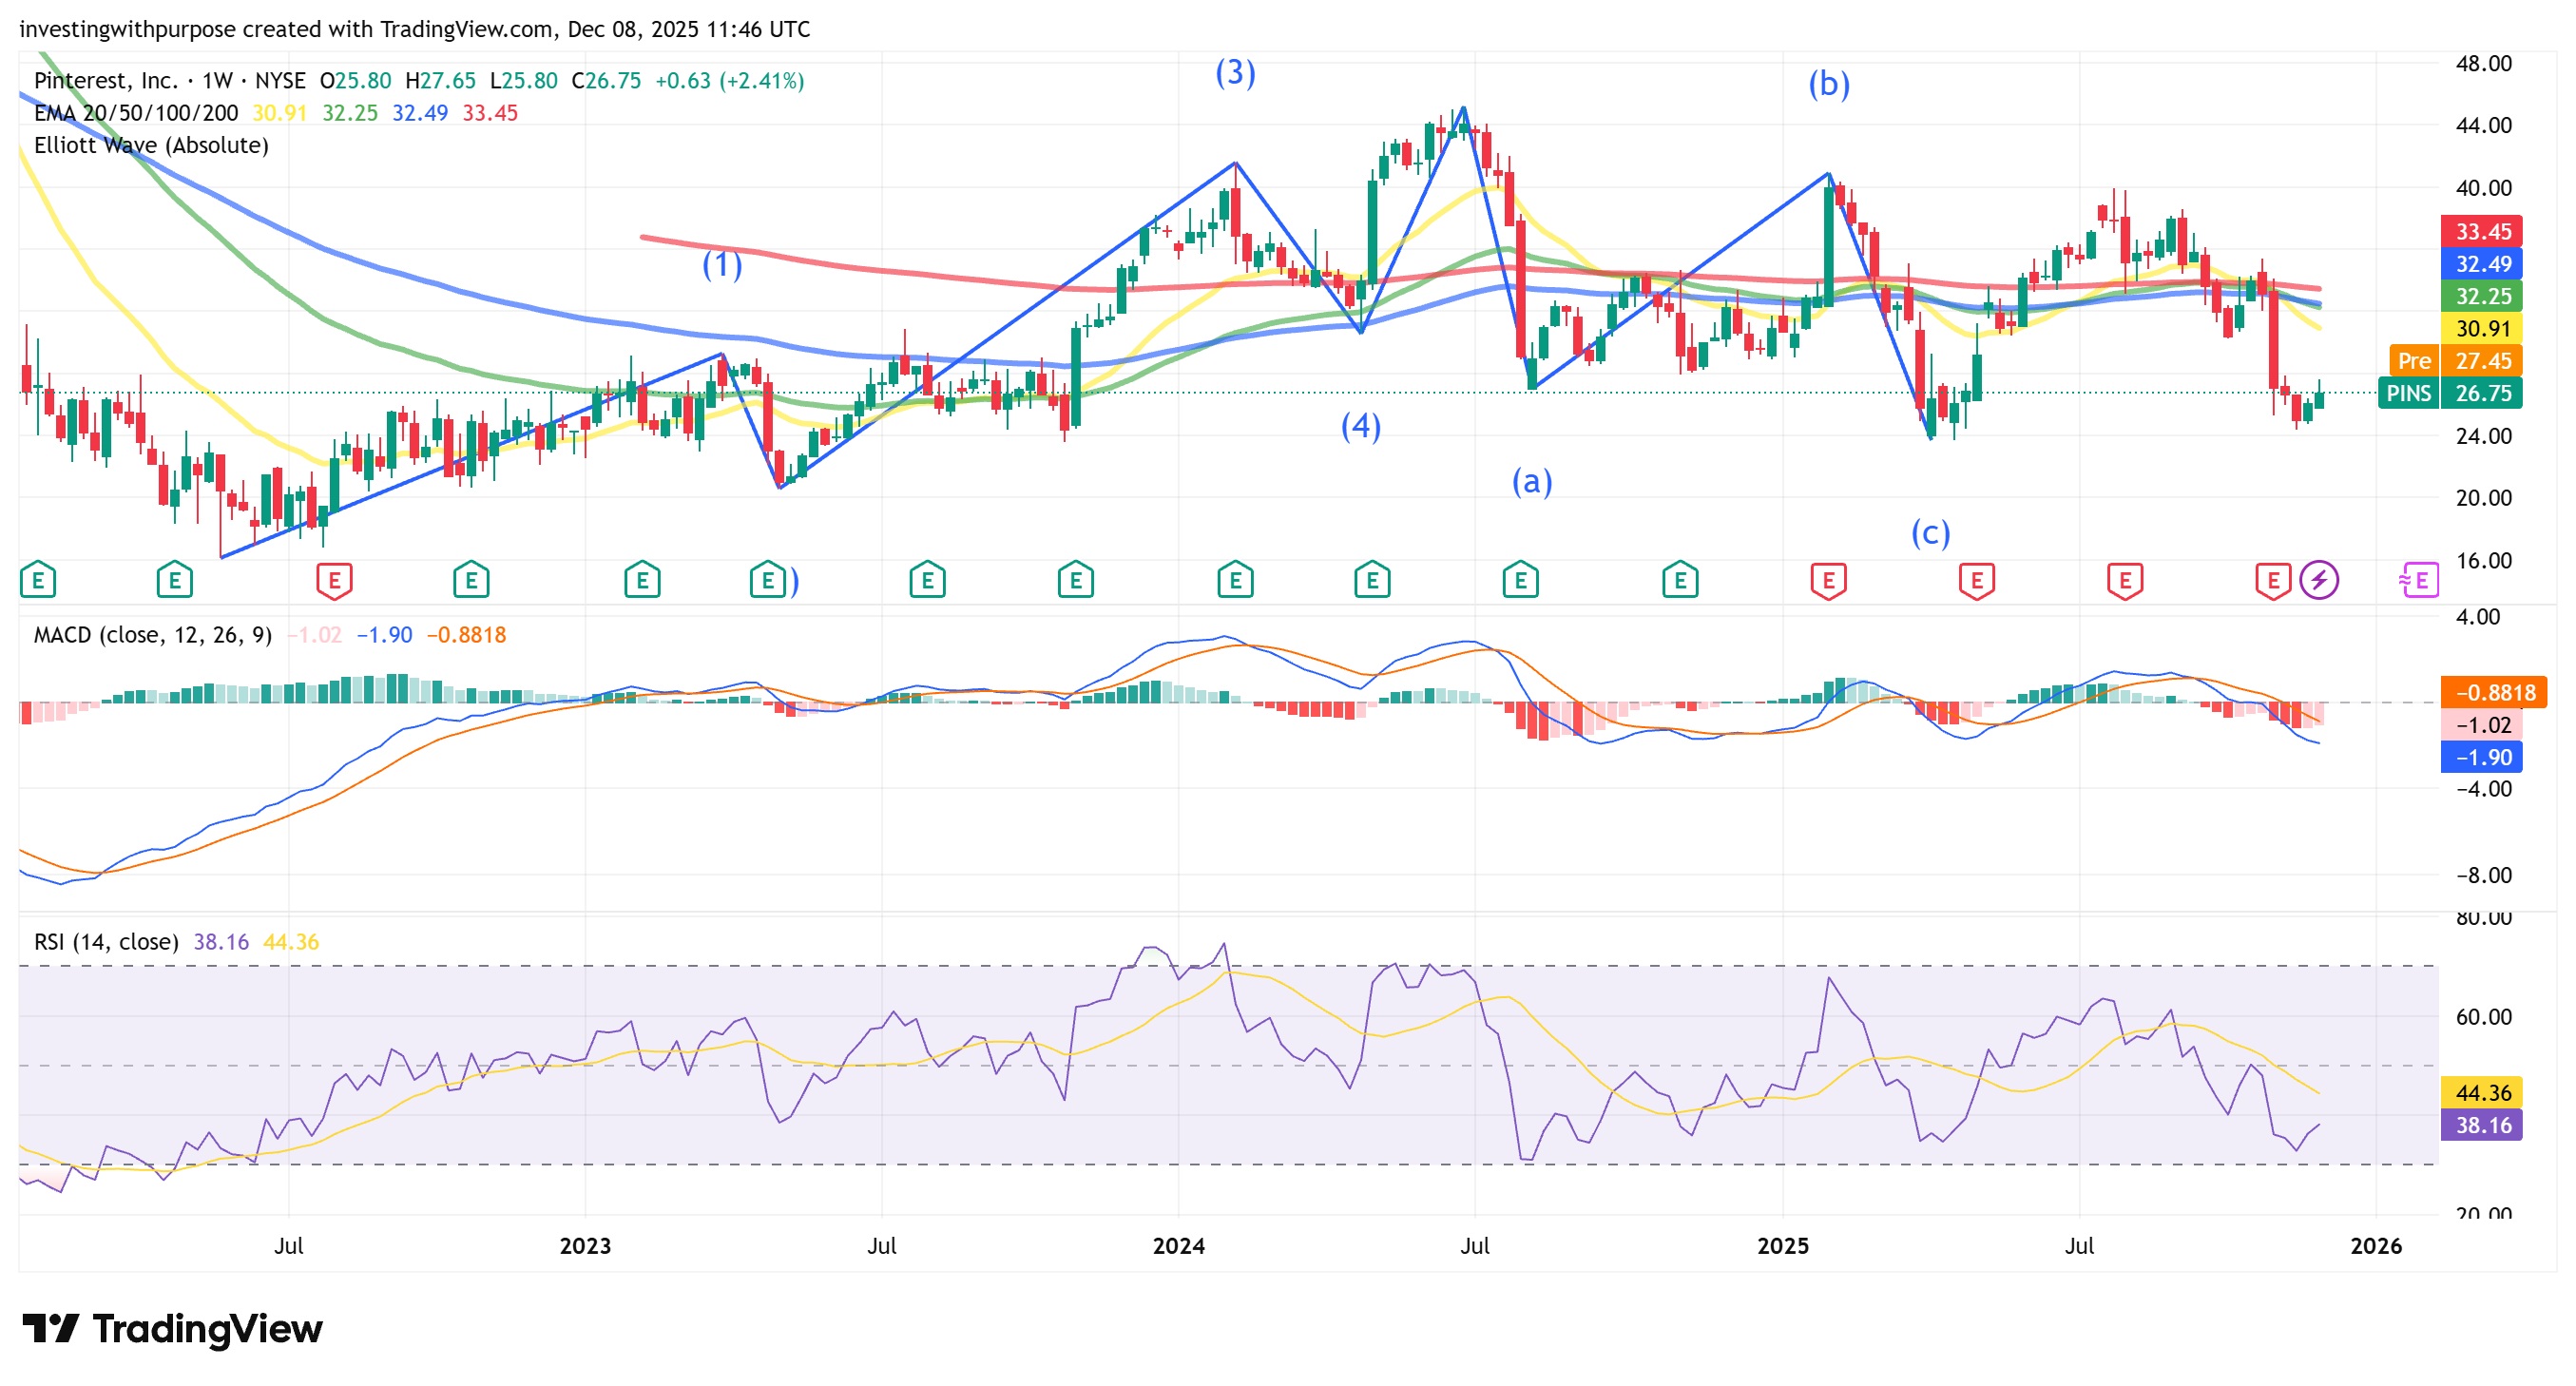
Price sits in the mid-$20s after a violent post-earnings flush from the high-$30s. The weekly chart shows a completed 5-wave advance into the 2024 peak around $40, followed by an ABC corrective structure that bottomed near $23.7. That $23–24 zone is now the cycle low and the key structural support.
All moving averages (20/50/100/200-week) are still gently down-sloping and clustered in the low-$30s ($31-33). Price is below that, which keeps the long-term trend technically down but late in the cycle. Weekly RSI has bounced from oversold low-30s back to the high-30s, while MACD is deeply negative but starting to flatten.
There is also a prior swing high / resistance band around $39–40. On the downside, a 0.618 extension of the last leg down comes in near $23, matching the recent low and reinforcing that area as the line in the sand for the long thesis.
Weekly bias: Long-term trend still technically bearish but late-stage, with evidence of a capitulation low at $23–24 and room for a mean-reversion rally back into the high-$20s / low-$30s if fundamentals stay intact.
Daily chart: Mid-term setup
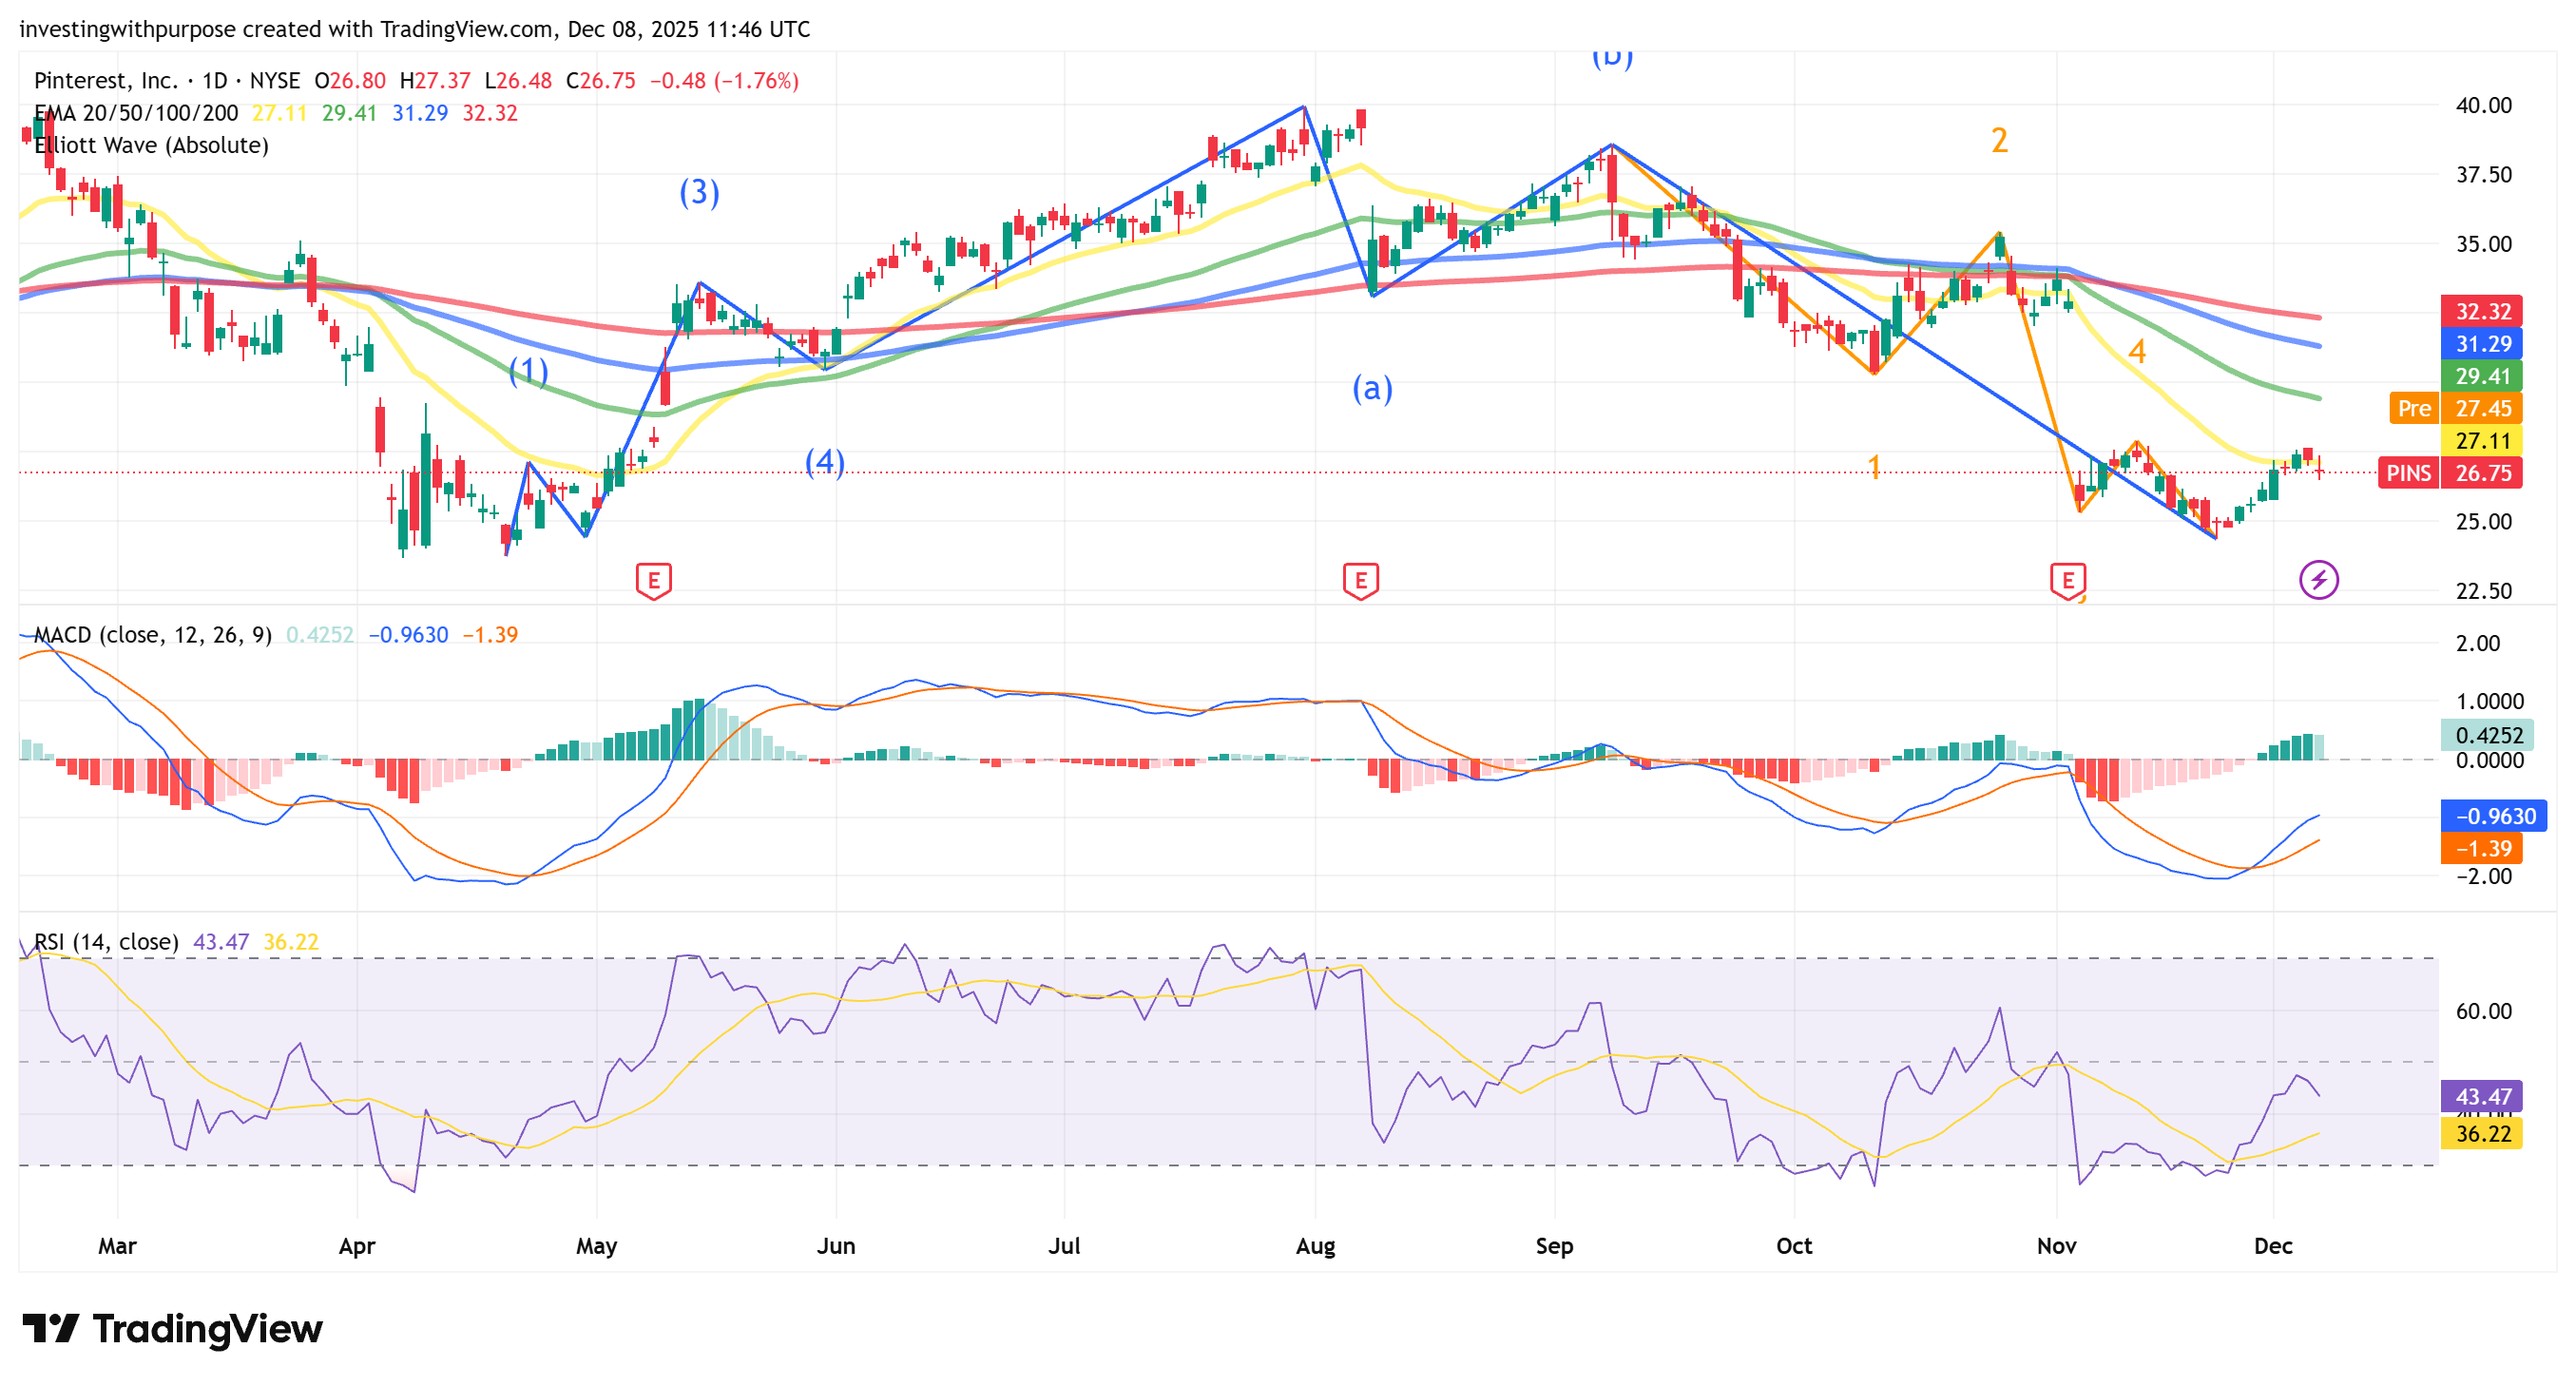
On the daily, PINS 0.00%↑ sold off from ~$38 in early autumn to the post-earnings low near $24, then staged a sharp counter-trend bounce to ~$28. Price has since pulled back to ~ $26-27range, roughly the 78.6% retrace of that first impulse up.
The 20-day EMA started to curl higher around $27-27.1, while the 50/100/200-day EMAs sit overhead near $29.4, $31.3 and $32.3 respectively, all still trending lower. That creates a clear overhead supply zone in the low-$30s where many trapped longs are likely to sell into strength.
Momentum has transitioned from outright oversold to early recovery. RSI bounced from sub-30 to low-40s, consistent with a developing base rather than a fresh down-leg. MACD is still below zero but has crossed bullishly, with the histogram positive – classic early-stage mean-reversion behavior after a capitulation low.
Daily bias: Short- to mid-term bullish within a broader downtrend: price is trying to build a base above $24–25, with a constructive 5-wave recovery sequence and room toward $29–31 if the 20-day EMA holds as support.
Across timeframes, PINS 0.00%↑ looks like a late-stage downtrend transitioning into a base. Weekly still says the trend is damaged, with heavy resistance in the low-$30s, but daily and intraday charts point to a constructive 5-wave bounce off the $23–24 low, now in consolidation above key Fib support. As long as price holds the $25.5–26.0 area, the path of least resistance is a push toward $28.5–29 initially and potentially $31–32 on a 1–3 month view, where the declining 100/200-day EMAs and major Fibs converge.
Trade Plan
Position bias: Long, tactically, with potential to grow into a core if the base above $24–25 holds and the macro environment cooperates.
Time horizon: 3–6 months for full target range; 2–6 weeks for the first leg.
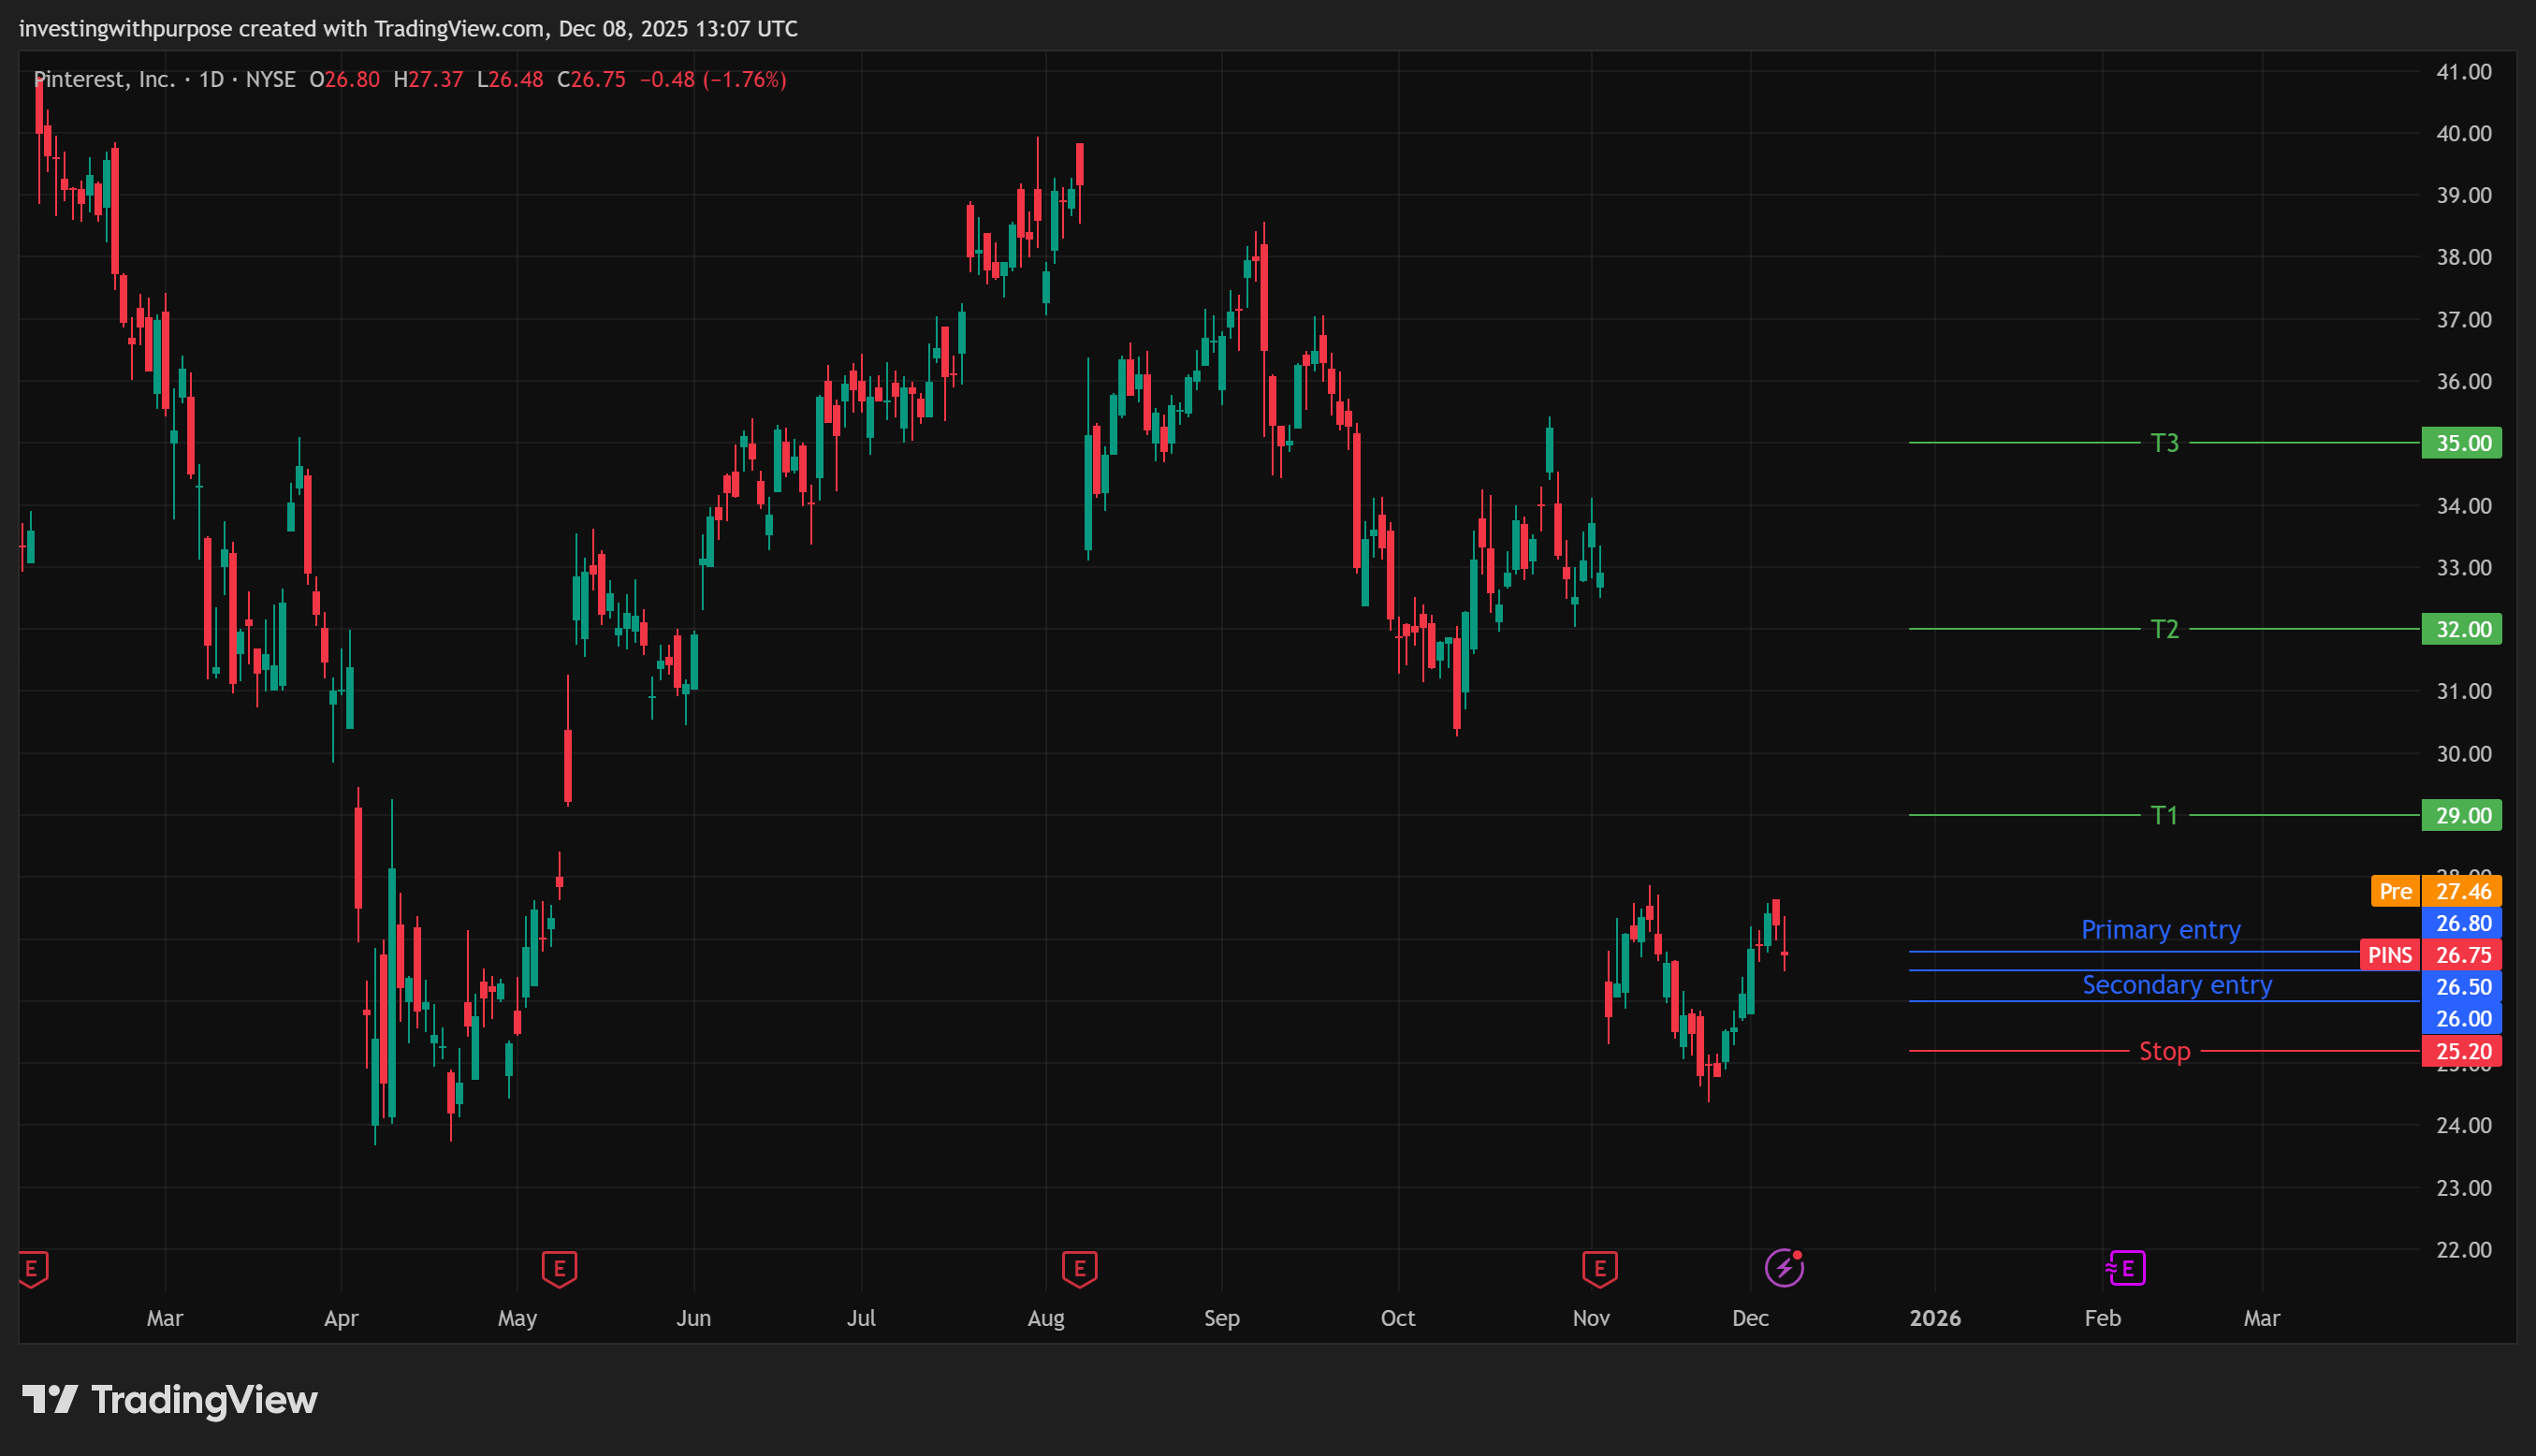
Primary entry zone: $26.5–26.8
Top of zone = current price area near the 0.786 retrace and 2h EMA cluster.
Bottom of zone = just above the 1.272–1.414 intraday extensions and prior micro support.
Secondary entry if opportunity develops: $26.0-26.2
Stops/Invalidation:
Structural stop: Below $25.2
Sits under the 1.272 intraday Fib (~$26.2), the recent micro lows, and the rising 2h support band.
Still well above the $23.7 low.
Targets:
Target 1 (T1): $28.5–29.0
Lines up with the 1.0–1.618 intraday / hourly Fib extensions, the hourly 200-EMA, and prior gap area.
Also close to the weekly 23.6% retrace.
Target 2 (T2): $31.0–32.0
Captures the 38.2% daily retrace (~$31.2), the declining 100/200-day EMAs ($31–32), and a prior congestion zone.
Stretch Target (T3): $34–35
61.8% daily retrace and a logical level for the first major lower-high if this is only a bear-market rally.
Only realistic if the broader market is risk-on and PINS executes another strong quarter.
If price breaks below $25.2 with conviction, the trade is wrong and should be exited. That would signal the November low is at risk and the downtrend is reasserting, at which point the next buy zone would only emerge closer to the $23–24 structural support with a fresh pattern.
Conclusion
Pinterest is not trading like a platform with growing MAUs, strengthening ARPU, and a highly profitable performance-ad engine. It’s trading like a company still waiting to prove its model, despite the fact that free cash flow, margins, and advertiser ROI are all moving in the right direction. That mismatch between fundamentals and price creates meaningful upside optionality.
With a likely cycle low established, a cleaner technical structure emerging, and valuation still anchored at low multiples, PINS 0.00%↑ is positioned for a multi-month mean-reversion toward the low-30s and maybe further. If AI-driven shopping and international monetization continue to deliver, the stock has room to rerate higher from both a growth and cash-flow perspective.
Disclaimer: This content is for educational and informational purposes only. It is not investment advice, a recommendation to buy or sell securities, or a promotion of any investment opinion.
See the latest from IWP:

AST SpaceMobile: The Bet That Could Rewrite Connectivity

Big vision, big capex, a chart that finally turned. Let’s see what is actually priced in.
Tags: Pinterest Stock, PINS, Investing, Growth Stocks, Ad-Tech, AI in Advertising, Digital Commerce, Social Media Platforms, Equity Research, Fundamental Analysis, Cash Flow, Valuation, Market Strategy, Tech Stocks, Long-Term Investing
Really solid breakdown of the ARPU arbitrage opportunity here. That $0.21 ROW ARPU vs $7.64 US/Canada gap is massive, but honestly I dunno if closing it is as straightforwad as it looks. The real challenge isn't just turning on ad units internationally, its that Pinterest's "high-intent shopping" thesis kinda depends on mature e-commerce infrastructure and payment rails that just dont exist in most fast-growing markets yet. Europe's 31% ARPU growth is probly the better leading indicator since the infrastructure is already there.