
Redwire (RDW): We Flagged It Early. The Next Phase Begins.
From a 6.30 setup to double-digit prices: how the thesis played out and what still matters now.

Back on Dec 09, we called RDW “mispriced” for one simple reason: the business was improving while the chart was still treated like it was broken.
Since that post, price did exactly what clean setups do when the crowd is late. Our pullback zone was 6.30 to 6.10, our breakout trigger was a daily close above 7.10, and the plan mapped targets at 7.0 to 7.1, 7.5 to 7.7, 8.6, then 9.10 to 10.00.
Fast forward to now, RDW is trading 11.71 on your latest charts, which means the stock is up 85.87% to 92.00% from that 6.30 to 6.10 zone, and up 64.93% from the 7.10 breakout level. Not luck. Levels first, price second.
If this intro feels right, say “next” and we move to section 2: business news updates and what they actually mean for the future.

Key takeaways
RDW moved exactly as outlined in the original plan, validating both the thesis and the process.
The business backdrop continues to improve, supporting the trend.
Price is extended, but structure remains bullish above 9.02.
Pullbacks, not breakouts, now offer the best risk-reward.
Preparation and patience mattered more than prediction, and still do.
We Buy Businesses, Not Just Their Stock.
Since our first post, the story behind the price has kept improving, not deteriorating.
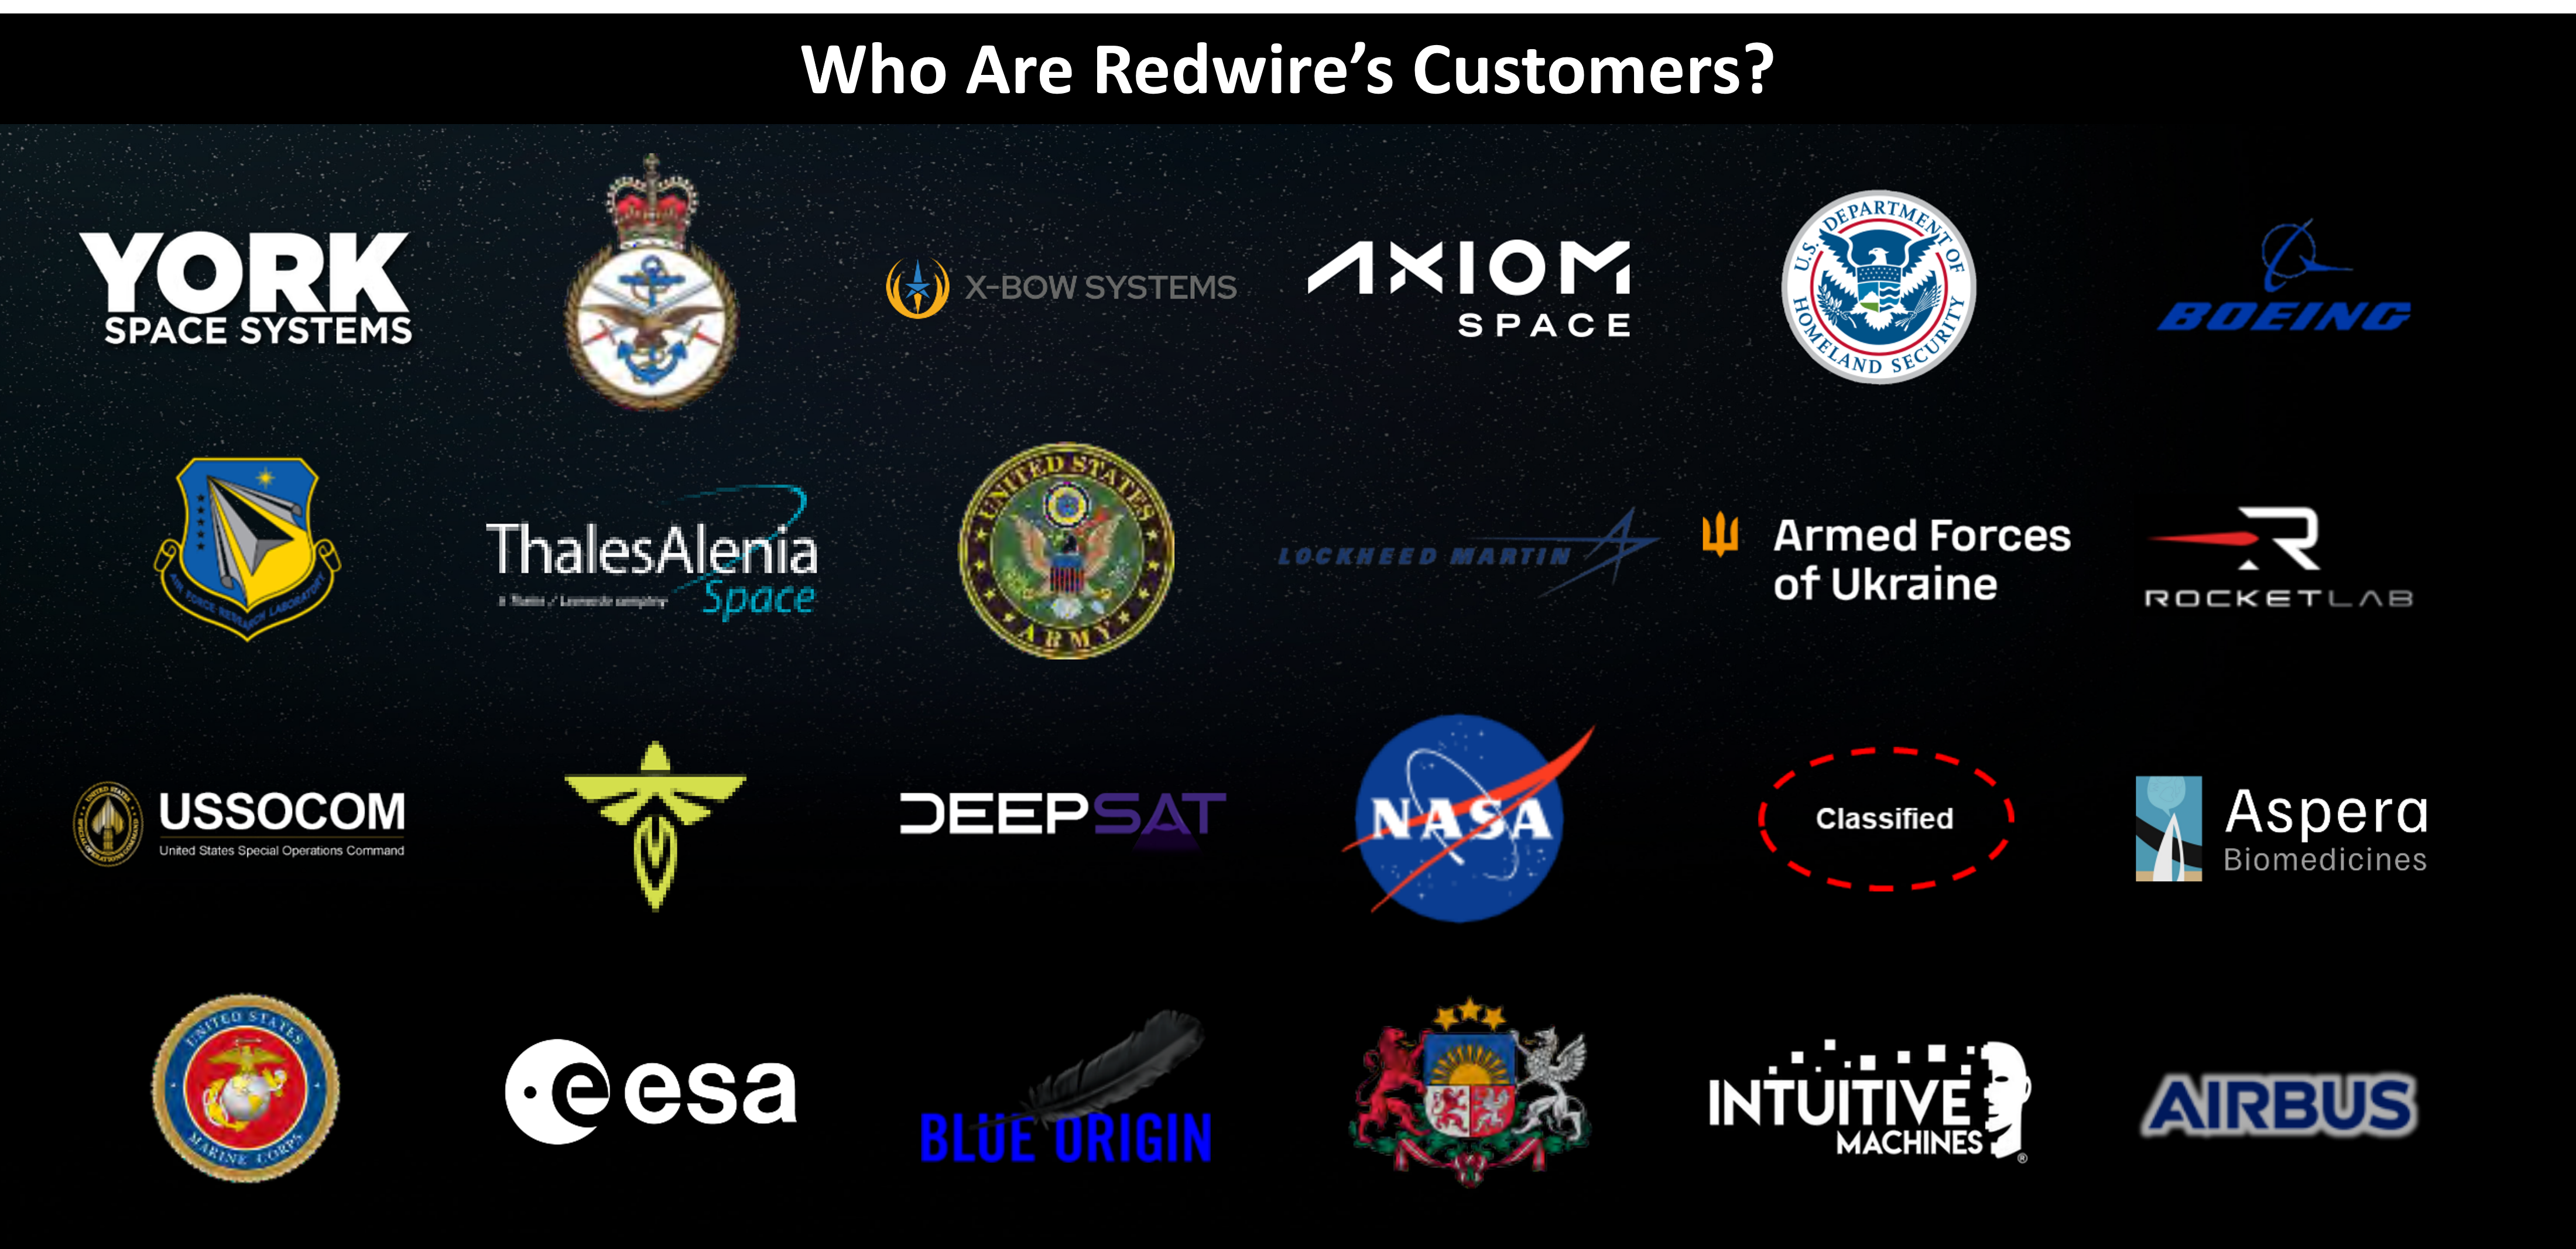
Redwire is no longer just a “space supplier hoping budgets show up.” It is turning into a repeat-order hardware business with real scale.
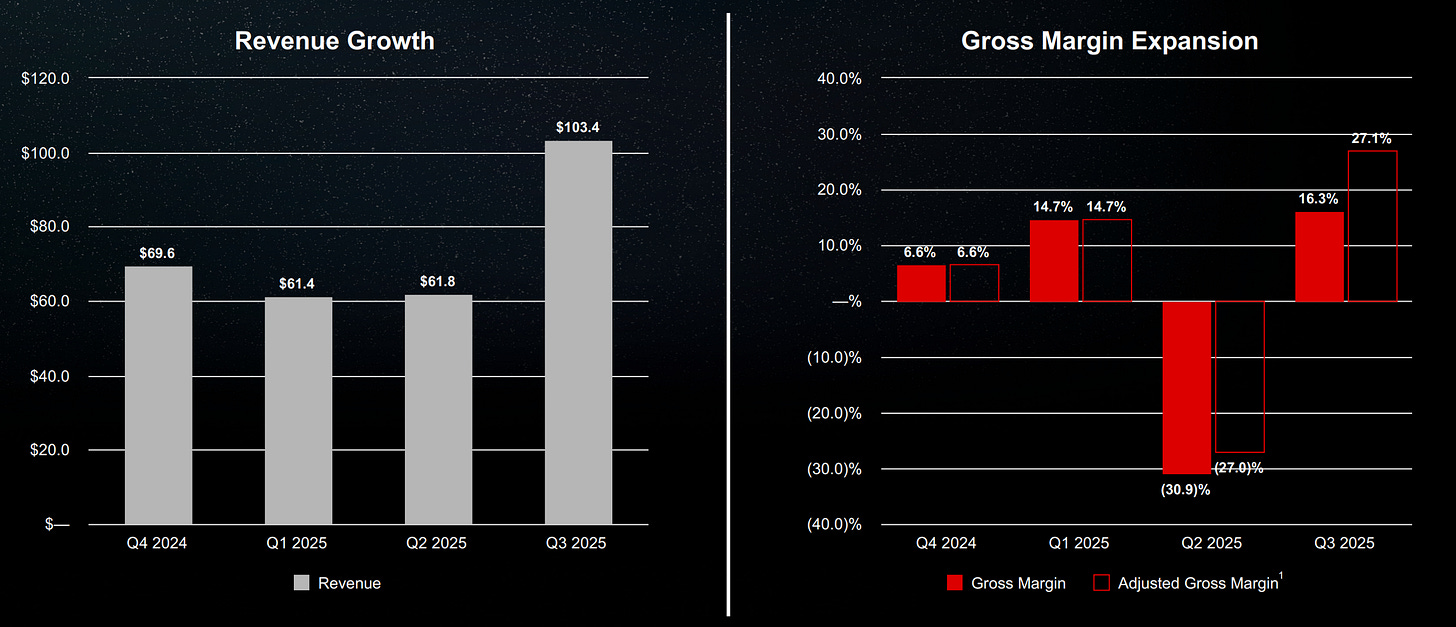
Backlog is now 355 million, and more importantly, book-to-bill moved above 1 at 1.25. That matters because it tells us demand is not just stable, it is growing faster than revenue is being recognized. In simple terms, work is coming in quicker than it is going out.
Contract wins have also shifted in quality. The recent eight-figure docking systems deal in Europe is not a one-off science project. It is standardized hardware tied to future missions and stations. Same story with the DARPA VLEO award. These are programs that tend to expand, not disappear after one launch.
On Artemis, Redwire already has flight-proven hardware on past missions and is working on Gateway-related docking systems. This is not headline hype. It is slow, boring, repeatable revenue tied to long programs with long budgets.
The Edge Autonomy acquisition also changed the shape of the business. It brought scale, defense exposure, and a steadier contract base. Yes, dilution came with it. But the trade-off is a company that is less fragile, less tied to one agency, and more relevant to defense and national security budgets.
Margins are still a work in progress, but direction matters. Gross margin has been improving, operating losses are narrowing, and the mix is shifting toward higher-value systems rather than custom one-off builds. That is how space companies survive the long run.
Put simply: this is no longer a “hope the next contract hits” story. It is a pipeline that is converting, slowly but consistently.
The technical setup and what it is really saying
The chart has been confirming the business, not fighting it.
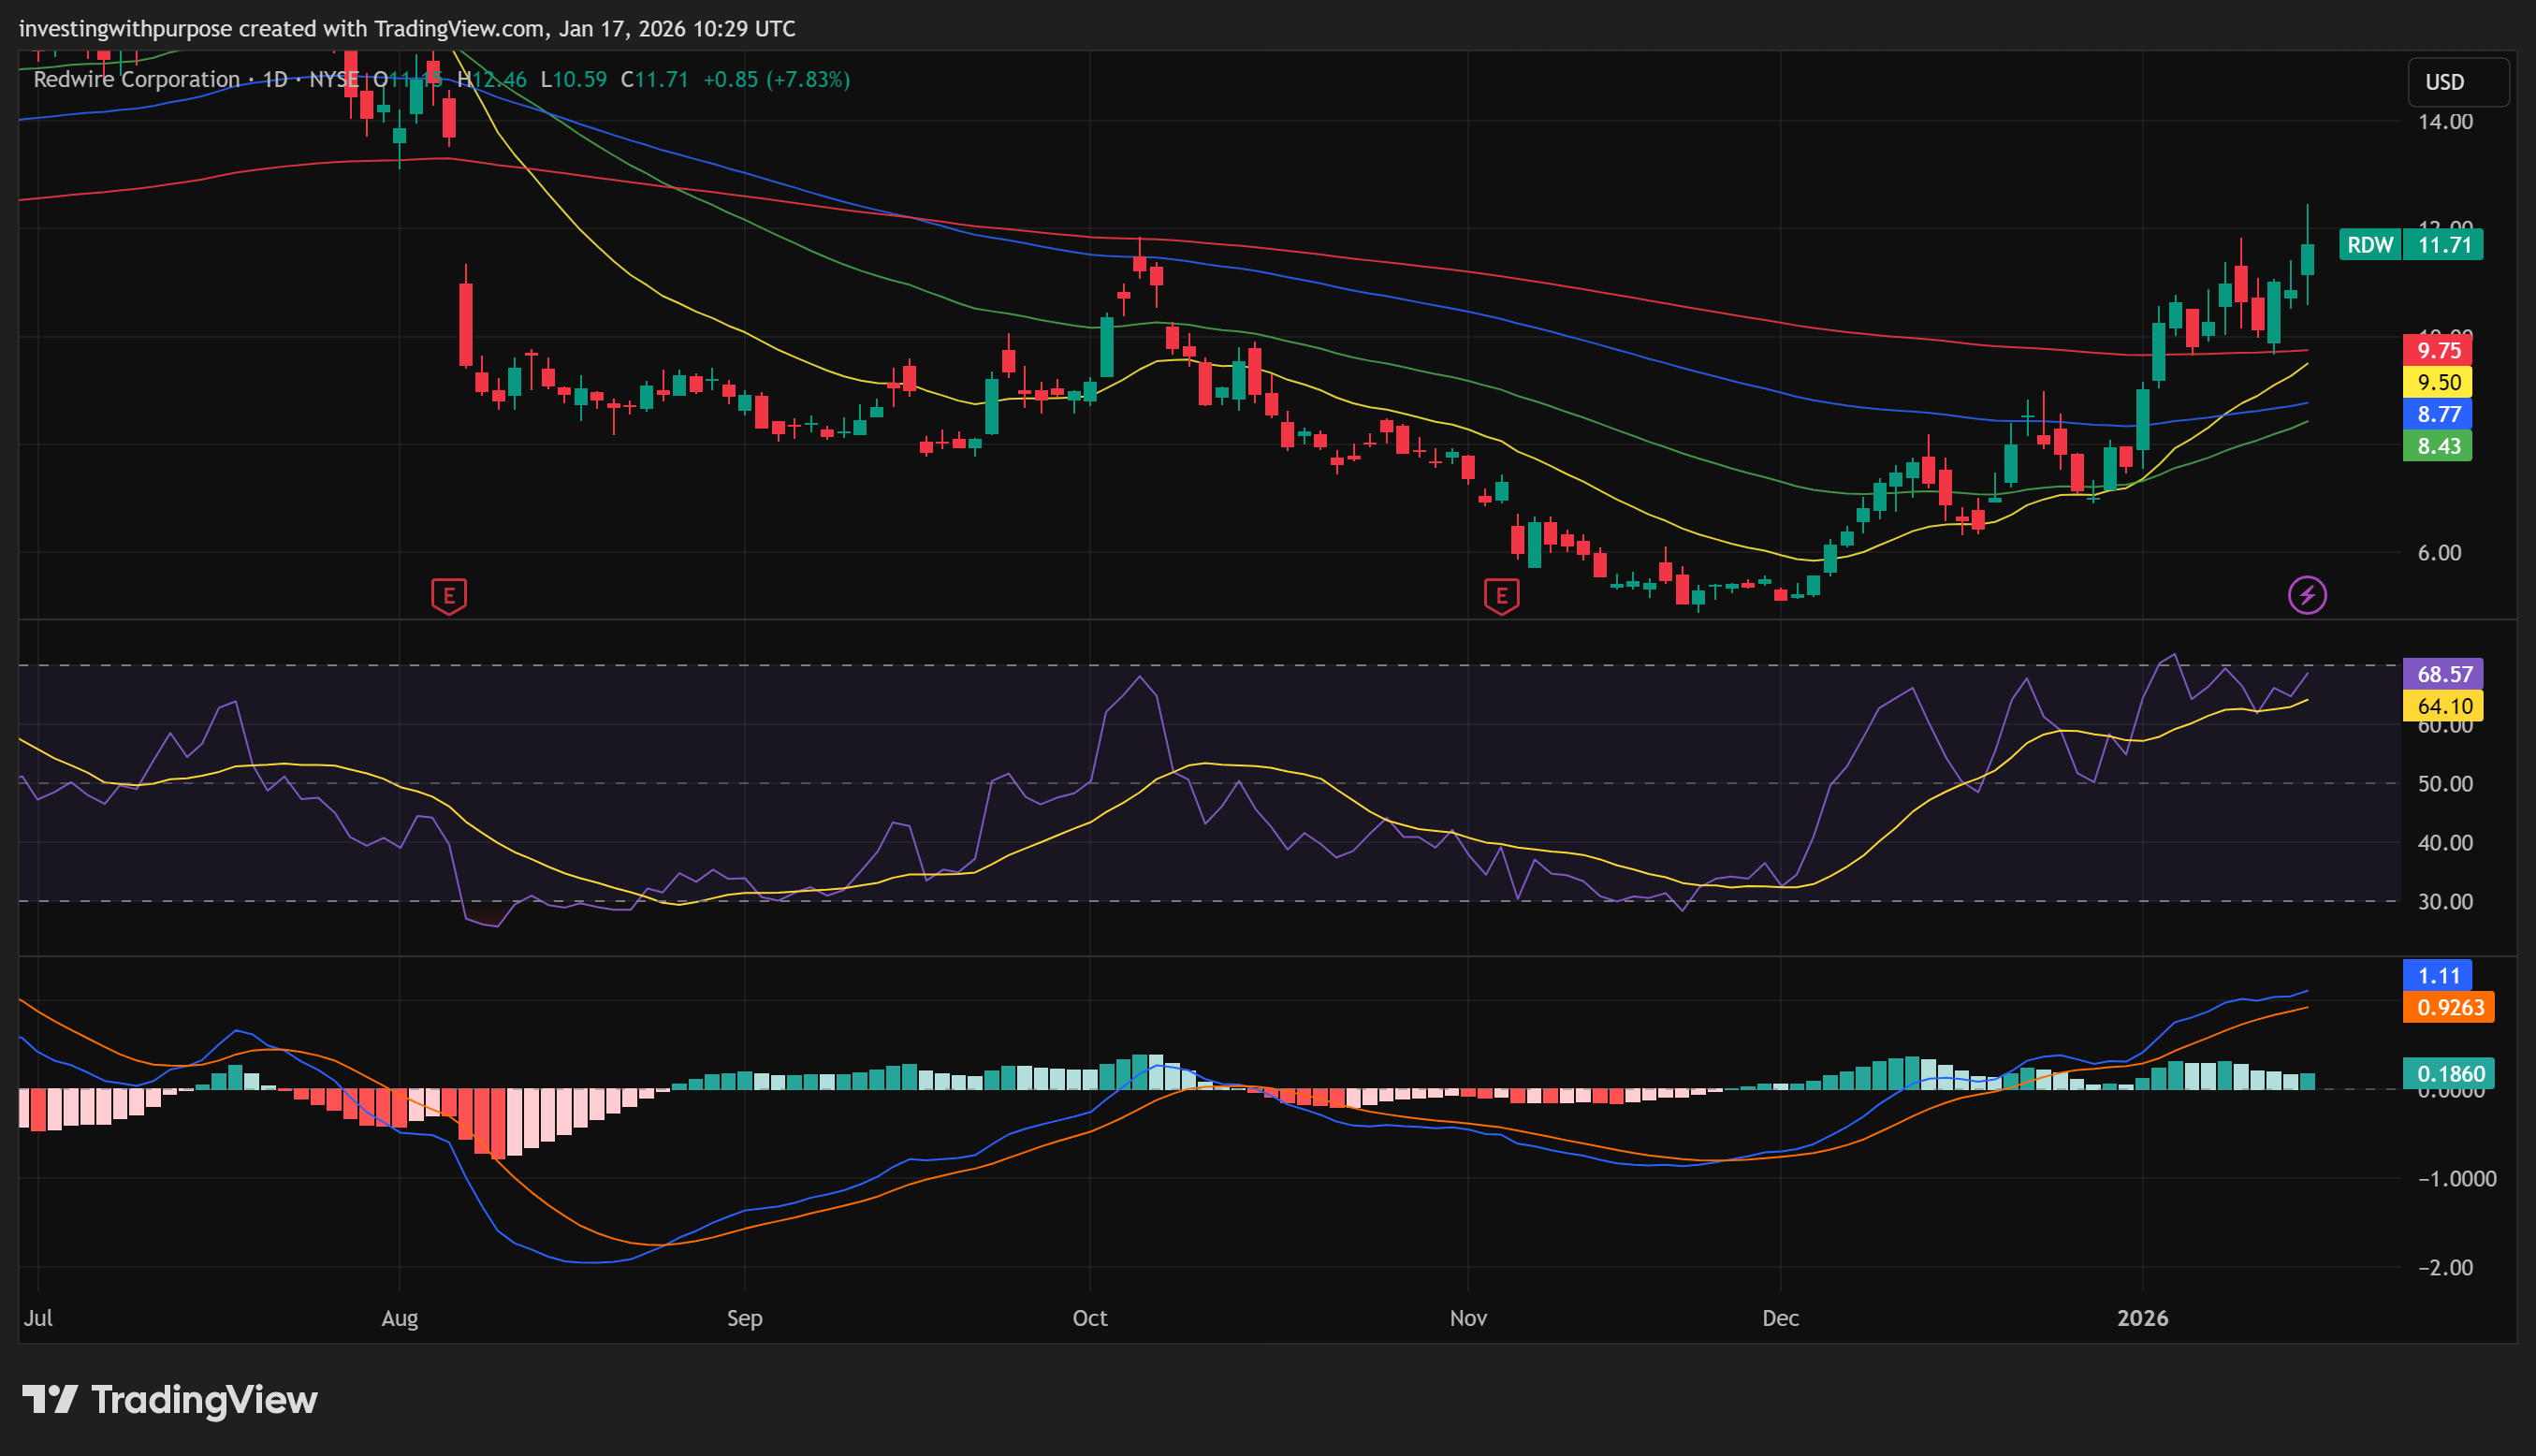
Starting from the November lows near 4.87, RDW built a clean impulsive structure. That low mattered because it marked the end of forced selling, not just a random bounce. From there, price reclaimed the 20, 50, and 200-day averages, and more importantly, it stayed above them on every pullback that mattered.
The first key signal was the daily close above 7.10. That was not just a line on a chart. It was the level where prior sellers were fully absorbed. Once that happened, momentum expanded fast, which is exactly what you expect when supply dries up.
Since then, RDW has respected structure almost perfectly:
Price held above 6.65, then built higher lows above 8.40, and now trades around 11.71 while sitting comfortably above the rising 50-day near 9.50 and the 100-day around 8.80.RSI staying in the 60 to 70 range is not a warning here. It is a trend signal. Strong stocks stay overbought longer than people expect. The same applies to momentum. MACD never meaningfully reset during the advance, telling us this move is driven by trend, not hype.

On the higher timeframe, the weekly chart reclaimed the 200-week area near 9.50 and held it. That is a big deal. Long-term downtrends do not usually survive that kind of reclaim. Once price gets above it and holds, the path shifts from defense to expansion.
Volatility has increased, but in the right way. Ranges are widening while price makes higher highs. That is what early trend expansion looks like, not exhaustion.
In short, nothing about the chart says “blow-off.” It says the market is repricing the stock faster than most are comfortable with.
Our Trade Plans
