Rhodium and Palladium ETFs: One Trend Digesting Gains, the Other Searching for a Floor
Two platinum-group metals at very different points in their cycles, and two very different ways to approach risk.

Precious and industrial metals rarely move in clean, straight lines. They move in cycles shaped by supply bottlenecks, industrial demand, and investor positioning. Right now, palladium PALL 0.00%↑ and rhodium $XRH0 are telling two very different stories.
Palladium has re-entered a constructive trend after years of compression. Rhodium, after an explosive surge, is working through a deep correction that is still unresolved. Treating them the same would be a mistake.
This is not about chasing headlines. It is about understanding structure, respecting levels, and aligning risk with where each metal actually sits in its cycle.
Key Takeaways
Palladium is in a confirmed medium to long-term uptrend, consolidating after a strong impulse.
Rhodium is in a corrective phase where bounces are possible, but trend repair is not yet complete.
Palladium favors patient pullback accumulation within structure.
Rhodium requires discipline, either buying defined support bounces or waiting for clear confirmation.
In both cases, risk management matters more than conviction.
Why These Metals Matter
Palladium and rhodium sit at the heart of global emissions control. Both are essential for catalytic converters, which reduce harmful exhaust gases in gasoline and hybrid vehicles. They also see growing use in chemical processing, electronics, and specialty applications.
What differentiates them is supply structure.
Palladium supply is relatively broader, with production spread across Russia, South Africa, and North America. Substitution between palladium and platinum has increased, smoothing extreme shortages.
Rhodium is far more constrained. It is produced almost entirely as a by-product of platinum mining, mainly in South Africa. When demand spikes, supply cannot respond quickly. When demand softens, price corrections are violent.
That asymmetry explains why palladium trends tend to be steadier, while rhodium cycles are sharper and more emotional.
Supply, Demand, and Cycle Position
Palladium
Demand remains tied to auto production and emissions standards, with stabilization after the post-pandemic slowdown.
Supply growth is limited, and substitution pressures have largely been absorbed.
The market has moved from surplus anxiety into balance, allowing price structure to rebuild.
Rhodium
Demand is still structurally important but cyclical.
Recent years saw extreme price spikes followed by normalization.
The market is now digesting excesses rather than pricing scarcity.
These fundamentals do not dictate day-to-day moves, but they explain why palladium can sustain trends while rhodium often retraces deeply before stabilizing.
Technical Analysis
Palladium ETF
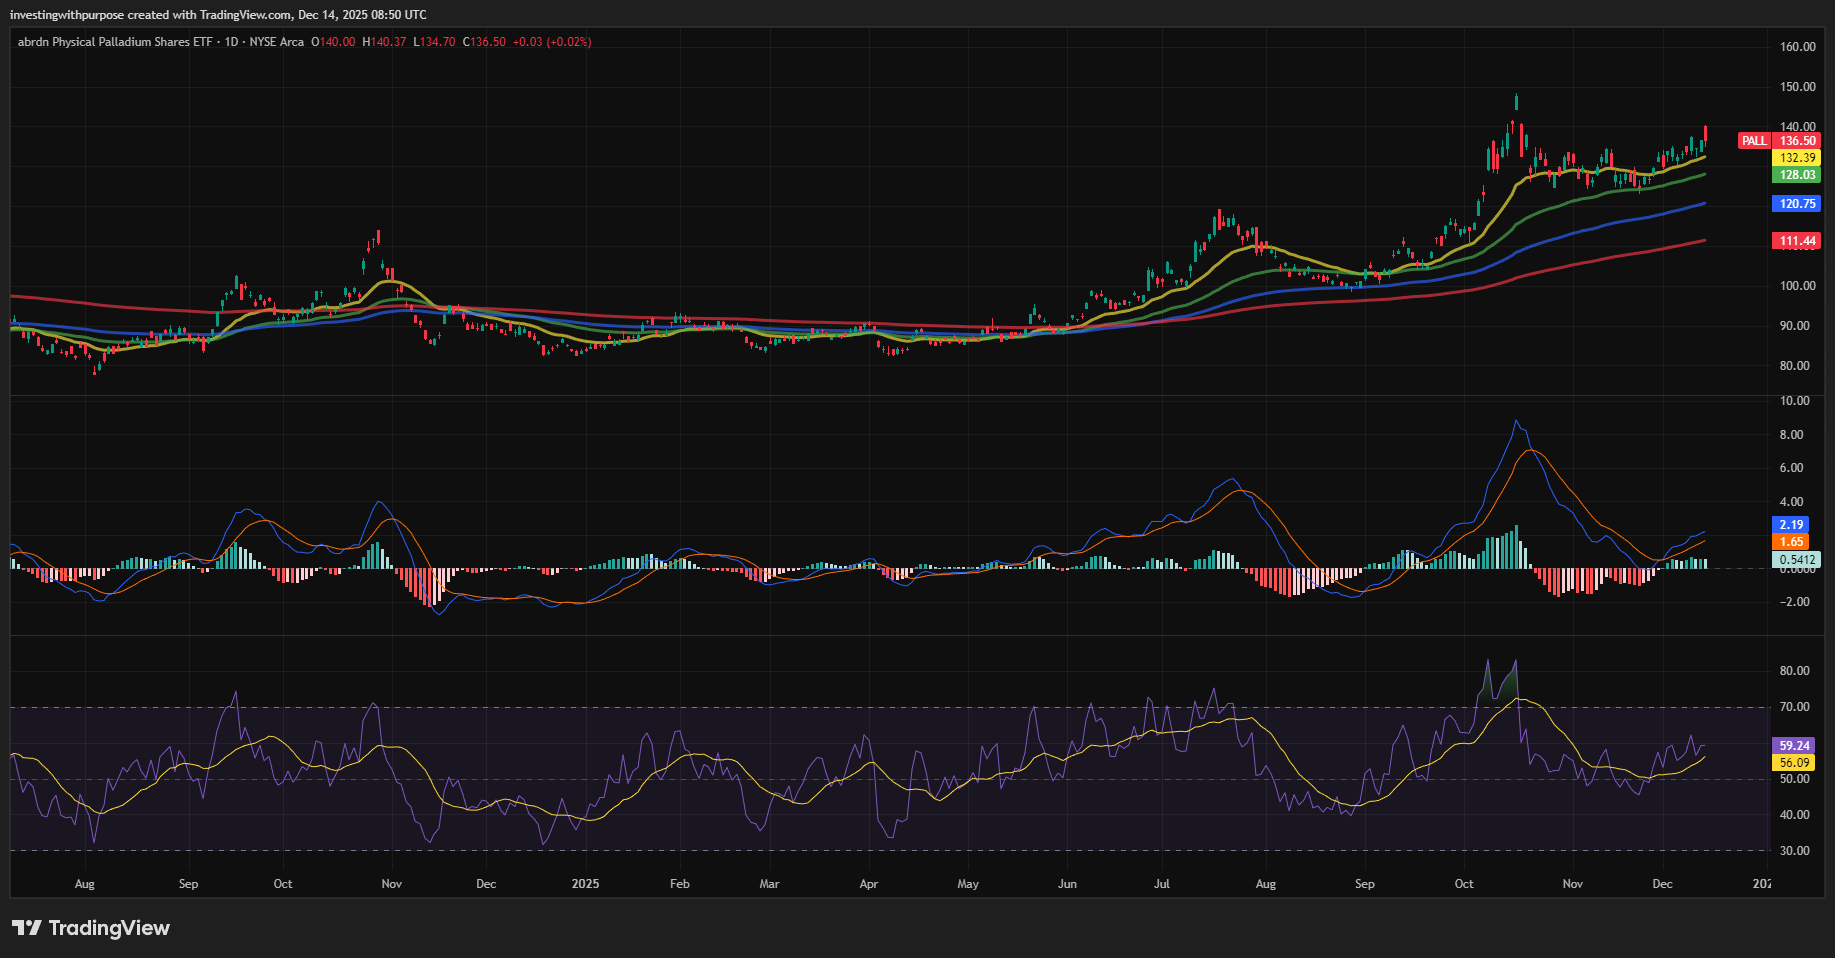
Palladium’s structure is remarkably clean across time horizons.
The long-term trend has flipped back to positive. Price sits comfortably above key long-term reference zones, confirming that the multi-year compression phase has ended. What followed was a strong advance, and the recent sideways action is digestion, not distribution.
On the intermediate horizon, price has paused while trend support rises underneath it. This is classic acceptance of higher prices. Pullbacks have been shallow and controlled, showing demand rather than fear.
On shorter horizons, momentum remains positive without signs of exhaustion. Strength is steady, not euphoric. This is consistent with a late-stage continuation phase where patience is required.
Key levels matter because they reflect where buyers have consistently stepped in.
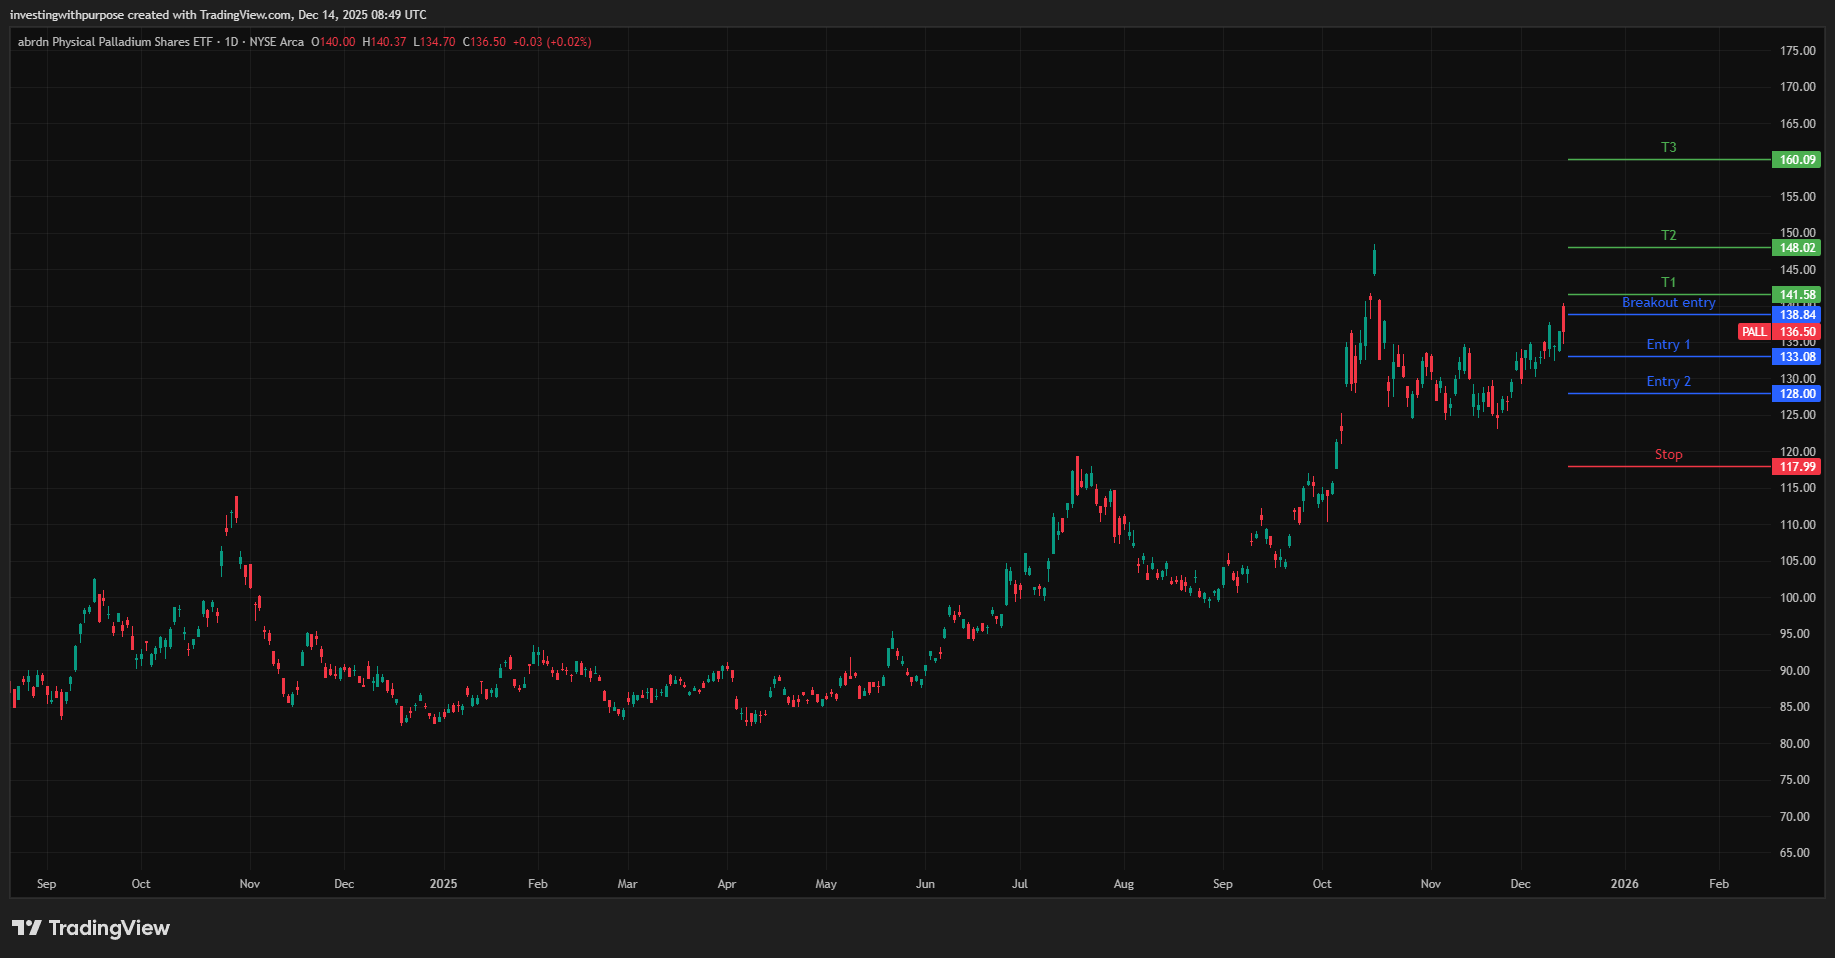
Support zones cluster around 133–132, then 131–128.
Near-term resistance sits at 139–140.
Above 140, structural resistance thins out significantly, opening room toward the mid-150s and beyond.
As long as price holds above 120–121, the broader bullish structure remains intact.
Technical conclusion for palladium: This is a trend continuation asset, currently consolidating within strength.
Rhodium ETF
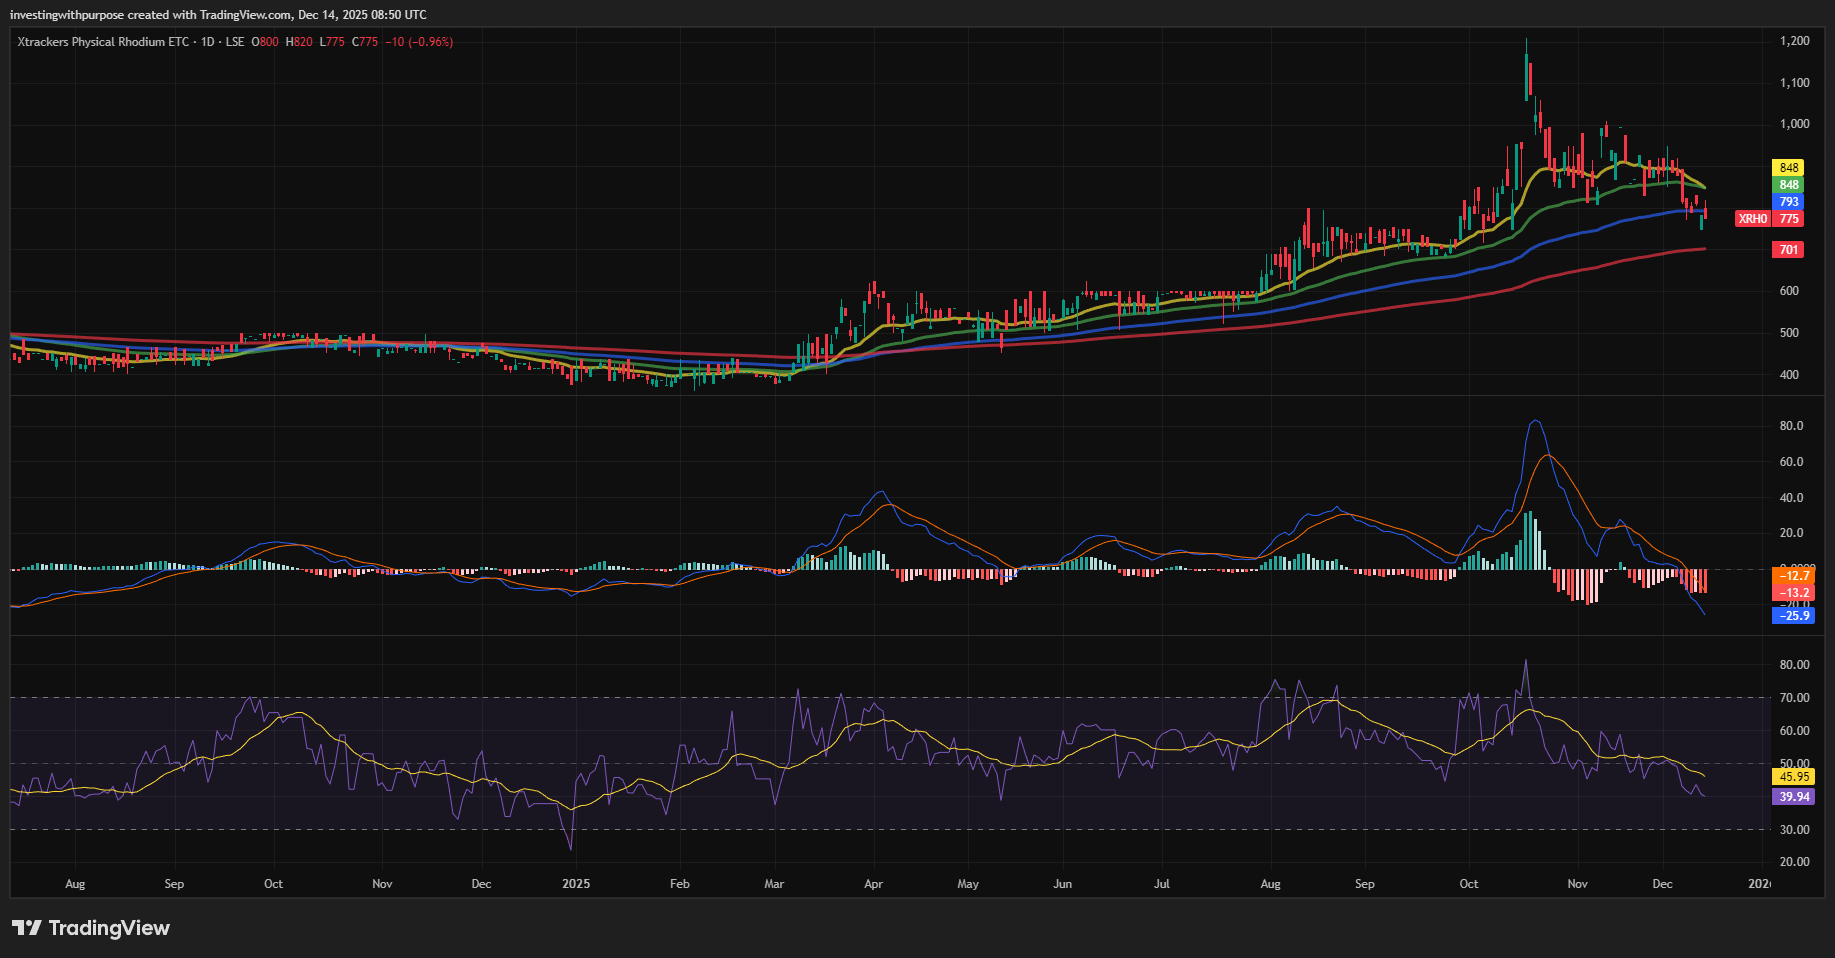
Rhodium’s structure is far more fragile.
The longer-term trend is still technically up relative to earlier cycles, but the metal is firmly in a corrective phase following a blow-off peak. Price sits below a critical pivot zone around 800–810, which now defines the difference between bounce and repair.
Momentum on longer horizons is weak but stretched. That combination often precedes relief rallies, not trend reversals.
On the intermediate horizon, the breakdown from a prior range is clear. Momentum remains negative, and rallies have struggled to sustain themselves. Overhead resistance is thick, meaning price must work hard to reclaim lost ground.
Shorter-term structure confirms this weakness. Momentum is bearish but not panicked, suggesting a grinding correction rather than a capitulation.
Key decision levels define the entire setup.
Major support sits at 750. Below that, downside opens toward 700, then 636–610.
Resistance begins at 800–810, then intensifies at 848–865 and 880–905.
True trend repair only begins if price can reclaim and hold above 810 and then 850–865.
Technical conclusion for rhodium: This is not an uptrend. It is a support test inside a correction.
Trade Plan
Palladium ETF
Primary approach: pullback continuation
Pullback entries: 133–132 and 131–128, where rising support has repeatedly absorbed selling.
Breakout entry: Daily acceptance above 140 confirms continuation.
Invalidation level: Sustained trade below 120 breaks the long-term structure.
Targets
Short term: 139–140 for partial trimming.
Medium term: 143 to 153 as momentum expands.
Long term: 160+ if the trend continues to mature.
Stops and risk
Tactical stop below 128 for active positions.
Structural stop near 120 for longer-term allocations.
Position size should shrink as stop distance widens. Risk a fixed % of capital per trade, not a fixed number of units.
Rolling stop logic
As price makes higher highs, stops can trail beneath rising support zones rather than price itself.