
Richtech Robotics (RR): Riding the Robot Revolution
How to approach one of the market’s hottest micro-cap automation names before the next move.

Small company, big automation story. Handle with care.
Service robots are moving from pilot to production across restaurants, hospitals, and logistics. Richtech Robotics sits right in that current. The stock has sprinted on AI-automation enthusiasm while the business is still proving repeatable deployments. We rebuilt the financials, lined that up with the technicals, and layered in sector context to answer one question: is RR 0.00%↑ investable for a medium-to-long horizon, or just a high-beta trade?

Key Takeaways
Revenue remains tiny and lumpy; losses are wide, but cash is solid and leverage is minimal.
Trend is up, momentum is hot, and price is extended; expect shakeouts before the next leg.
Sector demand is real, but public comps show ugly margins at this stage of adoption.
If you play it, think venture-style sizing and milestone-based adds; otherwise sit tight and wait for two clean quarters of execution.
Pipelines and business
Richtech’s “pipeline” is a product roadmap, not an FDA-gated clinical path. The company builds autonomous service robots for hospitality and adjacent verticals: waiter/delivery units, beverage robots like ADAM/Scorpion, and logistics/healthcare delivery bots. Coverage and filings suggest active pilots and deployments, with a shift toward service/rental revenue for better visibility. This is the right direction for unit economics, but we still need time-series proof of retention and scale.
Fundamental analysis Where the Business Stands
Revenue base is tiny (~$1.2m): Sales remain in early commercial stages, indicating the company is still validating product-market fit.
Margins distorted by scale: Gross margin (~75%) is inflated by negative COGS in the latest period; a sign of small base effects or adjustments rather than sustainable profitability.
Heavy operating losses (-$4.5m) and net losses (-$4.1m): Reflect a business still investing heavily in growth, with no near-term path to break-even.
Cash position strong (~$32.9m) with minimal debt (~$0.8m): Gives management a runway to fund R&D and sales efforts, lowering near-term dilution risk.
Liabilities extremely low (~1.3% of assets): Healthy balance sheet with minimal leverage, but equity still being used to fund operations.
Free cash flow deeply negative (~-7.5m, -625% margin): Reinforces that the business is burning cash, and profitability is dependent on significant scaling.
Sector comps show similar pain: Competitor Knightscope (~$11m revenue) also operates at heavy losses, a reminder this is a category risk, not just a company one.
Richtech is an early-stage robotics story with solid liquidity and virtually no leverage, but revenue scale, unit economics, and cash generation are unproven. Its success depends on converting pilot deployments into recurring revenue and improving margins over time. Until then, this remains a high-risk, high-optional upside play.
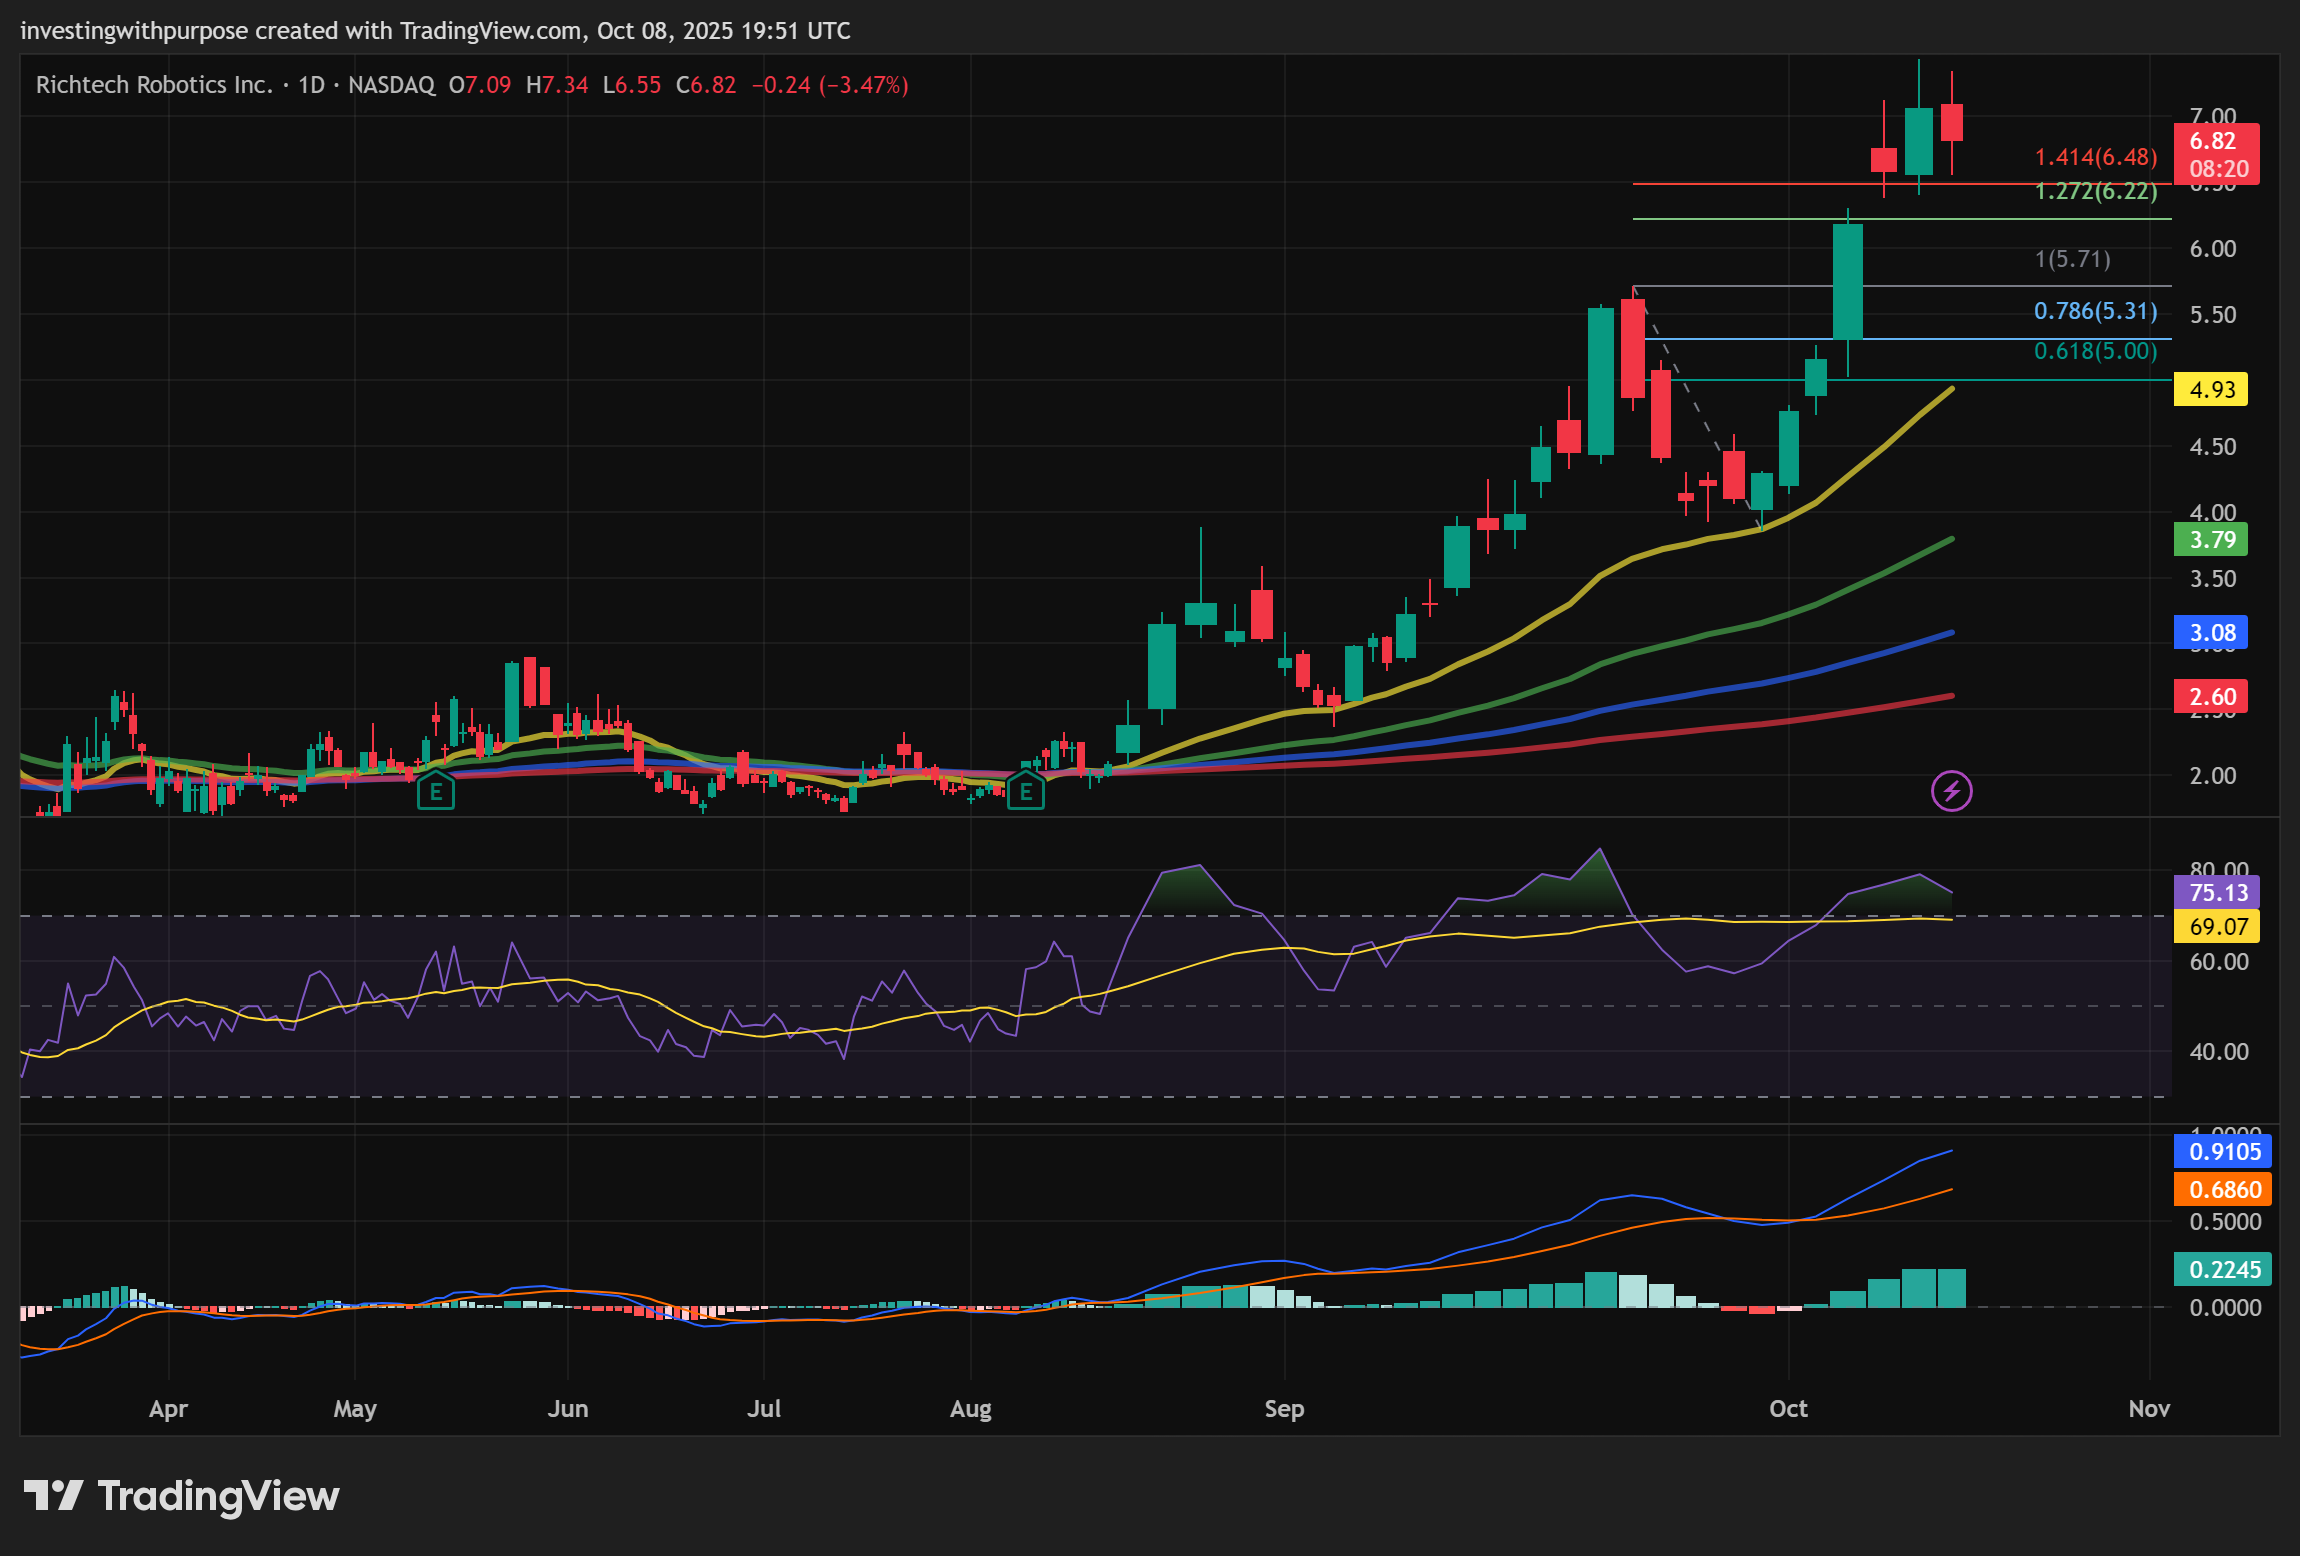
Technicals What the Charts Are Telling Us
Trend is strongly bullish: Price is trending above all major moving averages on both daily and weekly timeframes, confirming buyers are in control.
Momentum is overheated: Weekly RSI (~79) and daily RSI (~73) are deep in overbought territory, increasing risk of near-term pullbacks.
MACD supports strength: Rising histograms and bullish crossovers confirm trend momentum but also highlight the need for a consolidation phase.
Price stretched above support: Current levels (~6.7) are ~30–40% above the 20-day EMA (~4.9), a technical overextension that often leads to mean reversion.
Fib levels show key zones:
Support: 6.22–6.48 (1.272/0.786), 5.91 (0.618), 5.13 (0.382)
Resistance: 7.20 (recent high), 8.10 (1.272 ext), 9.25 (1.618 ext)
Volume and volatility rising: Expanding Bollinger Bands and strong breakout volume confirm momentum, but also suggest larger swings ahead.

The market clearly wants to own RR 0.00%↑ ; momentum, breadth, and volume all point bullish. But with the stock extended and overbought, disciplined entries on pullbacks are key. Short-term risk is a healthy correction, while long-term trend structure remains intact as long as price holds above ~5.9.
A simple trade approach
Entry zone: 6.2–6.5 for starters, 4.9–5.2 for deeper pullback.
Add confirmation: Above 7.2 on a weekly close.
Stops: 5.1 (tight) or 4.5 (loose swing).
Targets: 8.10 and 9.25 with scaling.
Review: Reassess if two quarters pass without revenue acceleration or improving gross margins.
Bottom line
RR 0.00%↑ can work if deployments compound and unit economics hold. The technical support continuation, but the stock is extended and the business is still pre-proof. For medium-to-long investors, this is a small, speculative position, managed with rules and reviewed every quarter. If you’re not comfortable with that profile, wait for two consecutive quarters of growth + improving cash flow before getting involved.
This content is for informational purposes only and is not financial advice.