
Riding the Bull: S&P 500 Technical & Fundamental Outlook
Why Breakouts, Golden Crosses, and Solid Earnings Keep the Uptrend Intact

We’ve just witnessed the S&P 500 punch through its June highs, carving out fresh all-time peaks as quarterly earnings season heats up. From a technical standpoint, momentum indicators flash strength, but also hint at a near-term breather. On the fundamental front, heavyweight tech stocks continue to deliver, while the Federal Reserve signals a patient stance on rates. In this deep-dive, we’ll unpack both angles and lay out a pragmatic trade plan.
Ket Takeaways
Fundamentals: Big Tech earnings beat estimates, forward guidance steady; inflation easing but still above target; Fed on hold → supportive backdrop.
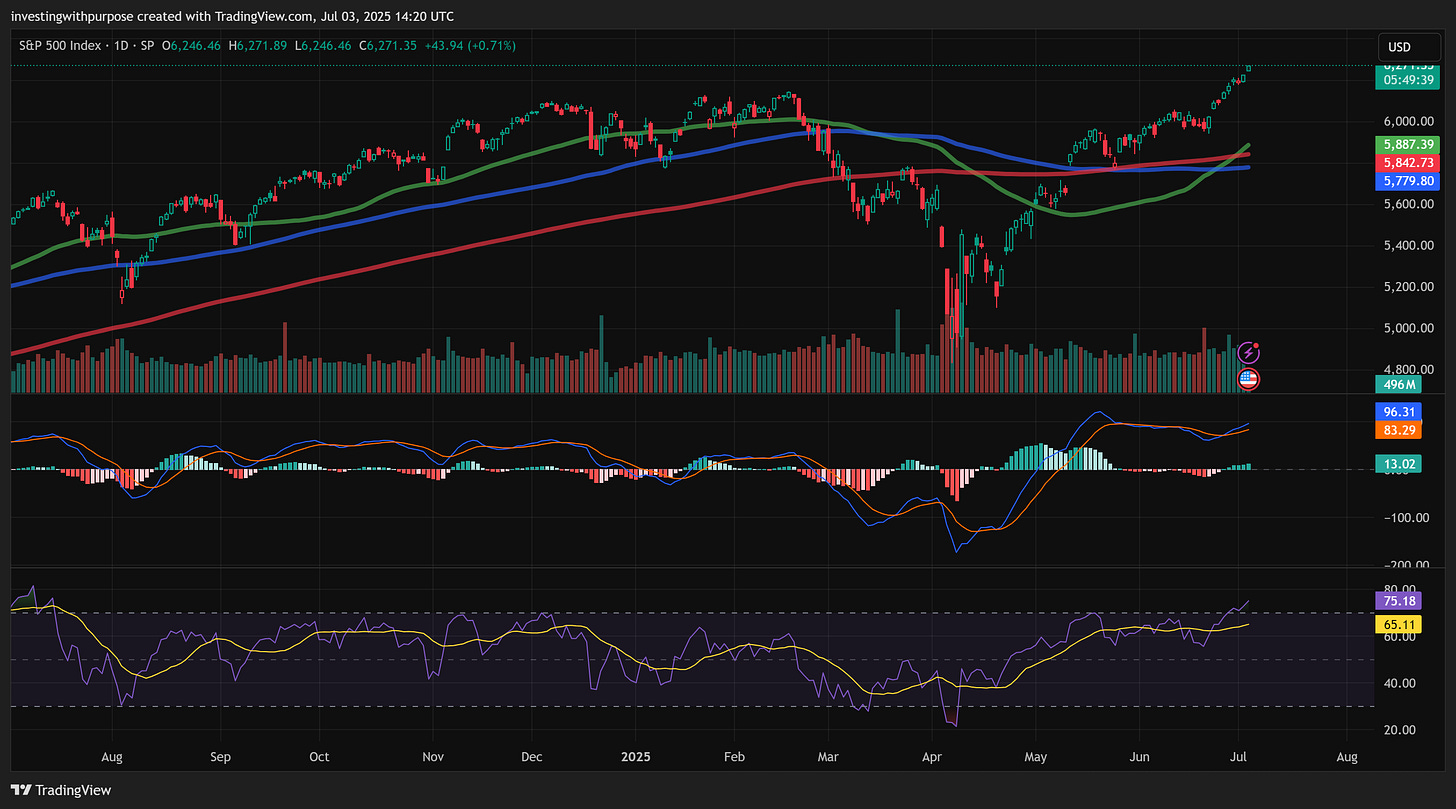
Technicals: Daily/weekly golden cross in place; price atop upper Bollinger Band; RSI overbought on 2-hour and daily, but weekly RSI still healthy.
Key Levels:
Support: 6,150–6,110 (23.6%–38.2% retracements), 6,080–6,047 (50%–61.8% zones)
Resistance: 1.618 fib ext at ~6,416 → then 2.618 at ~6,707
Trade Approach: Look to add on shallow dips into 6,110–6,150, with protective stops below 6,000.
When the Tape Speaks, Listen Closely
Fundamental Analysis
Earnings Pulse: Through half of the S&P 500’s Q2 reports, 75% of companies have topped EPS estimates, led by mega-caps (Apple, Microsoft, Google). Forward guidance remains cautious but not alarmingly weak.
Valuation & Multiples: The forward P/E sits near 20–21× above the long-term average but justified by strong free-cash-flow and low actual borrowing costs.
Macroeconomic Backdrop:
Inflation: Core CPI is cooling toward 3–3.5%, yet still double the Fed’s 2% target.
Fed Stance: The Fed held rates at 5.25–5.50% and signaled “patient for now,” implying no hike until inflation convincingly retreats.
Growth Indicators: ISM manufacturing at 50.5 (flat), services at 53, labor market loosening slightly, an environment for steady corporate profits.
Fundamentals keep the wind at our back; strong earnings + a not-too-hot economy = runway for higher prices.
Charts Tell the Tale of the Tape.
Technical Analysis
Golden Cross Confirmed
On the daily, the 50-day SMA (≈5,887) crossed above the 200-day SMA (≈5,843) in mid-June—a classic bullish signal.
On the weekly, the 50-week (≈5,793) is comfortably above the 200-week (≈4,767), reinforcing long-term uptrend.
Fibonacci in Focus
Retracements off the June 18 low (5,943) → June 30 high (6,215):
23.6% → 6,150
38.2% → 6,111
50.0% → 6,079
61.8% → 6,047
Extensions point to:
1.618 → 6,416
2.618 → 6,707
Momentum & Volatility
RSI:
2-hour ~80 (overbought)—suggests a pause or consolidation.
Daily ~74 (overbought) vs. Weekly ~63 (room to run).
MACD: Positive crossover on daily; histogram modestly rising.
Bollinger Bands: Price hugging the upper band—strong trend, but edges are thin.
ADX (Weekly): ~22—trend is present but not yet “strong” (>25).
ATR & OBV: ATR elevated but moderating; OBV steady upward → volume confirms advances.

Technically, the chart is bullish but due for a shallow breath, look for dips into confluence zones to reload.
Where to Plant the Flag.
Key Levels & Trade Plan
ETF Option: For direct S&P 500 exposure→SPDR S&P 500 ETF SPY 0.00%↑
Primary Support Zones:
6,150–6,110 (23.6%–38.2% retracements)
6,080–6,047 (50%–61.8% retracements + mid-BB)
Upside Targets:
Short-term: 6,416 (1.618 fib extension)
Medium-term: 6,707 (2.618 extension), then ~7,000 (3.618)
Trade Approach:
Buy the Dip: Scale in on pullbacks to 6,110–6,150 with staggered entries.
Stops: Place protective stops just below 6,000 (just under the 78.6% retracement).
Take-Profits: Partial at 6,416; trail the rest toward 6,700+.
When the market pauses, that’s your cue to step in, backed by trend and fundamentals.
Bottom Line
Fundamental Pulse: Earnings resilience + Fed patience = supportive environment.
Technical Alignment: Golden crosses, clean fib structure, strong momentum, bullish outlook, albeit overbought on shorter frames.
Actionable Plan: Buy shallow dips into fib retracement confluence, target 6,416 then 6,707, with prudent risk management.
In the dance of price and value, the S&P 500 is leading, and we’re ready to follow its steps.