


A good business the market stopped paying for is often the most interesting setup on the screen.
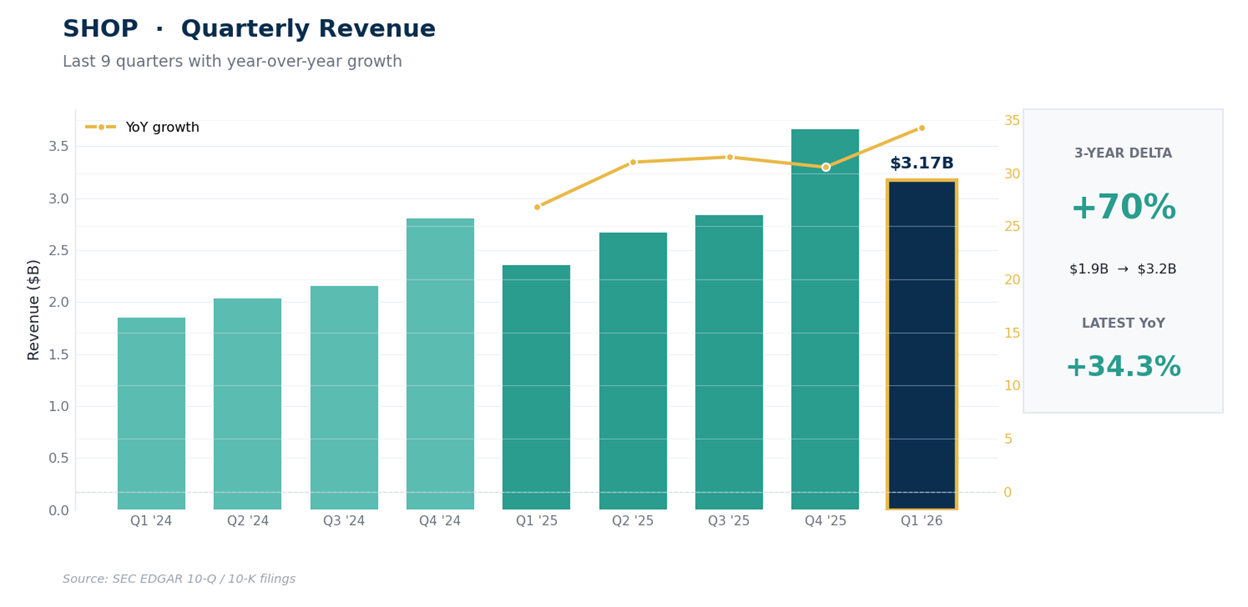
Shopify closed at $103.00 on 2026-05-22, almost exactly where it traded a year ago. Over those same 12 months the S&P 500 climbed 26%. That gap is the whole setup. Underneath it, the business did the opposite of stall: revenue grew 34.3% YoY in the March quarter to $3.17B, operating income stayed firmly positive, and operating margins have been climbing for most of the past year.
The company also reported a GAAP net loss of $581M, and that loss tells you almost nothing about how the business is doing. When a stock gives back a full year while the market runs and the underlying numbers keep improving, it’s worth understanding what the market stopped paying for, and whether the price has fallen far enough to change the math.

Key Takeaways
Revenue is accelerating, not slowing. The March quarter put up $3.17B, up 34.3% YoY, with gross profit of $1.546B. Demand for Shopify’s merchant software isn’t the problem here.
The loss is investment noise, not operations. Operating income was a positive $498M at a 15.7% operating margin. A markdown on Shopify’s equity stakes pushed the GAAP bottom line to a $581M loss. The same thing happened a year ago.
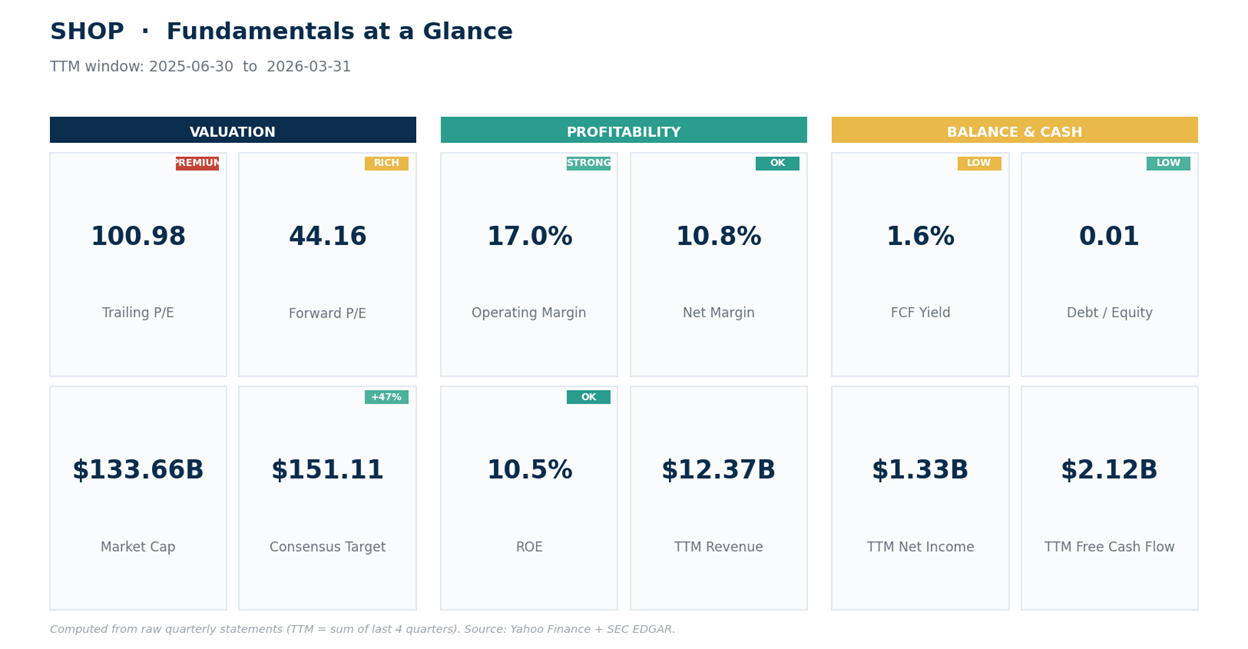
The balance sheet is pristine. Roughly $5.74B of cash against $179M of debt, a current ratio above 6, and trailing operating cash flow of $2.15B. This is a company that funds itself.
Valuation is still rich. Even after the slide, shares trade near 11x trailing sales and roughly 60x EV/EBITDA. The growth earns a premium, but not a cheap one.
One line frames everything. Price sits right on the 200-week trend average near $103 and just above the $99.61 long-term retracement. Hold that zone and it’s a base. Lose it and the next shelf is well below.
Here’s what the numbers actually say.
SHOP: The Operating Engine Quietly Turned
Step back 3 years and Shopify looks like a different company. Fiscal 2023 revenue was $7.06B against an operating loss of $1.418B, the hangover from overbuilding through the pandemic boom.
Then management cut hard, sold off the money-losing logistics arm, and the operating line flipped: fiscal 2025 delivered $11.556B of revenue and $1.468B of operating income.
The March quarter did $3.17B, up 34.3% YoY, at a 48.8% gross margin. The margin trend is the tell. Across the past 5 quarters the operating margin ran 11.8%, 13.8%, 17.3%, 20.3%, then 15.7% into the seasonally lighter spring period.
That’s a business getting structurally more profitable as it scales.
So why the reported loss? Shopify carries equity stakes in other companies, and accounting rules force it to mark those stakes to market through the income statement every quarter.
When those holdings fall, the company books a paper loss even though nothing was sold and the core business kept humming. That’s exactly what produced the $581M GAAP net loss against $498M of real operating income.
The prior-year spring period showed the same shape: positive operating income, a large investment markdown, a headline loss. The figure to anchor on is operating income and cash generation, not the GAAP bottom line, which will swing with markets from one period to the next.
The balance sheet is why none of this is fragile. Shopify holds about $5.74B in cash against just $179M of debt and threw off $2.15B of operating cash over the past year. This is a company that funds itself and then some.
Valuation is the catch. Even after the slide the stock trades near 11x trailing sales and about 60x EV/EBITDA (enterprise value against operating earnings before depreciation), so the market is still paying a premium that growth has to keep earning. For context, the analyst desk leans positive and its lowest published target sits a touch above today’s price, but that’s supporting color, not the reason to act. The trend and the tape decide that.
The price action tells a more sober story. On the weekly trend the stock ran from below $50 in 2023 to above $180 late last year, then rolled over and gave most of it back. The last weekly close at $103.00 sits below the weekly EMA20 ($122.92) and EMA50 ($126.47), the trend lines that weight recent prices more, but right on the weekly EMA200 near $103.25, the 2-year average that has held as the floor through prior pullbacks.
Momentum confirms the fatigue: weekly RSI is 39.6, a 0-to-100 gauge where readings under 40 mark a tired tape. The 61.8% retracement of the whole $48-to-$182 run sits just beneath at $99.61, so price is wedged between its long-term trend line and that deeper support.
The daily picture is a downtrend trying to find a floor. Price sits below all 4 daily moving averages, stacked in the bearish order that defines a downtrend, with the nearest overhead at $108 and $116. Daily MACD, which tracks the spread between a fast and a slow trend average, is barely negative now with its histogram near flat, so the selling has eased even if buyers haven’t taken over.
Drop to the 4-hour and a small bounce is underway, though it’s already short-term overbought, which usually means it needs to rest before it can do more. Net of the detail, the read is simple: below the short-term averages, sitting on long-term support, momentum weak but stabilizing. First resistance is $108 to $110, then $115 to $116. Support is $99 to $100, then the lower volatility band near $91.
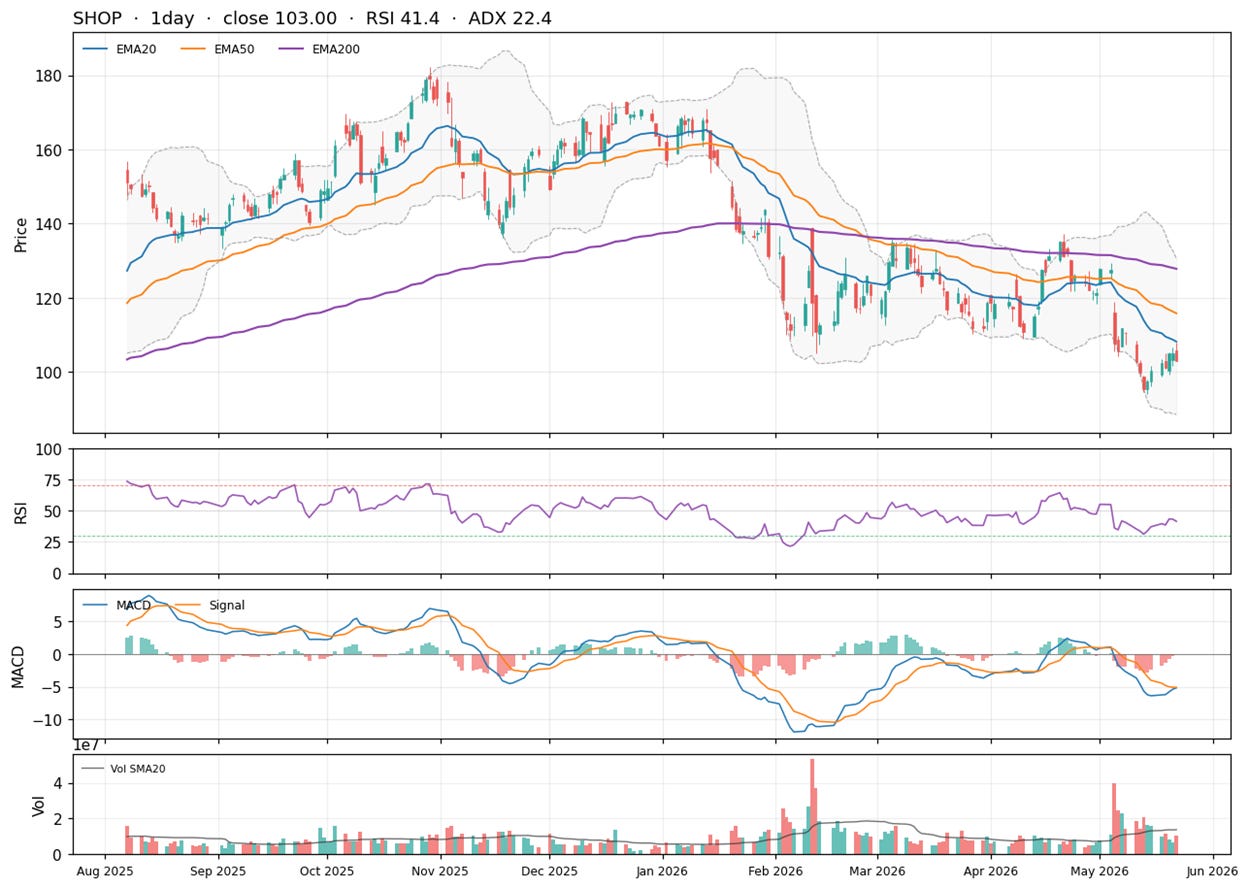
Net read: the business is compounding and the balance sheet is bulletproof, but the tape is still in a medium-term downtrend that has only just reached major support. Price is sitting on the 200-week trend line with the $99.61 retracement right below, and momentum is weak but no longer falling apart. This isn’t a breakout to chase. It’s a base that either forms here or breaks, and the $99 to $100 zone is where you’ll find out. Patience earns a better entry than the open does. The next print lands Wednesday 2026-08-05, 72 days out, so there’s time to let it come to you.
Here’s how to act on it.
