


Silver’s next move is hiding in plain sight, and it could hand early readers their best entry point in years. In the weeks ahead, a quiet convergence of technical levels and macro forces is lining up a dip that serious silver bulls have been waiting for. Want to know exactly where to buy and why the timing couldn’t be more perfect? Read on..
Silver TL;DR
Current Pullback: Likely to fall toward $35.50–35.60 first, then $33.50–34.00 (converging SMAs + fibs) before resuming its uptrend.
Key Bull Thesis:
Techs: Weekly/daily MACD & RSI rolling over, short-term oversold (Stoch RSI), strong trend (ADX), BB squeeze.
Fundamentals: Negative real U.S. rates, weaker dollar, booming industrial demand vs. flat mine supply, record ETF holdings, high silver/gold ratio.
Watch For:
Bounce triggers: Stoch RSI >20 (2h), daily MACD turn up.
Support holds at $33.50–34.00, break below negates bull case.
ETF inflows or USD weakness to reignite leg to $38+.
Fundamentals: A Bullish Backdrop
Negative Real U.S. Rates
Fed funds near 5.5% vs. inflation running 3–4% means real rates are effectively negative. That environment favors non-yielding assets like silver as a hedge.U.S. Dollar Trends
The DXY has eased off its highs on growing Fed-pause bets, making dollar-priced silver more attractive to global buyers.Industrial Demand Surge
– Solar panels & electronics: Silver use in photovoltaics and 5G continues growing 7–10% annually.
– EV components: As electric vehicle production ramps, silver consumption underpins a looming supply deficit.Constrained Mine Supply
Global silver production is barely growing (~2% at best) with few large projects coming online, setting the stage for tighter markets.Record Investment Flows
– SLV & similar ETFs hold over 1.1 billion ounces.
– Retail coin and bar demand have surged, driven by a gold-to-silver ratio near 75:1 (well above the long-term ~60:1 average).Inflation & Fiscal Policy
Persistent core CPI above 2% and pending green-energy subsidies/infrastructure bills add fuel to the inflation-hedge narrative.Central Bank Interest
Some emerging-market banks are modestly increasing silver reserves—offering low-key but steady support.
Technical Analysis: Mapping the Pullback
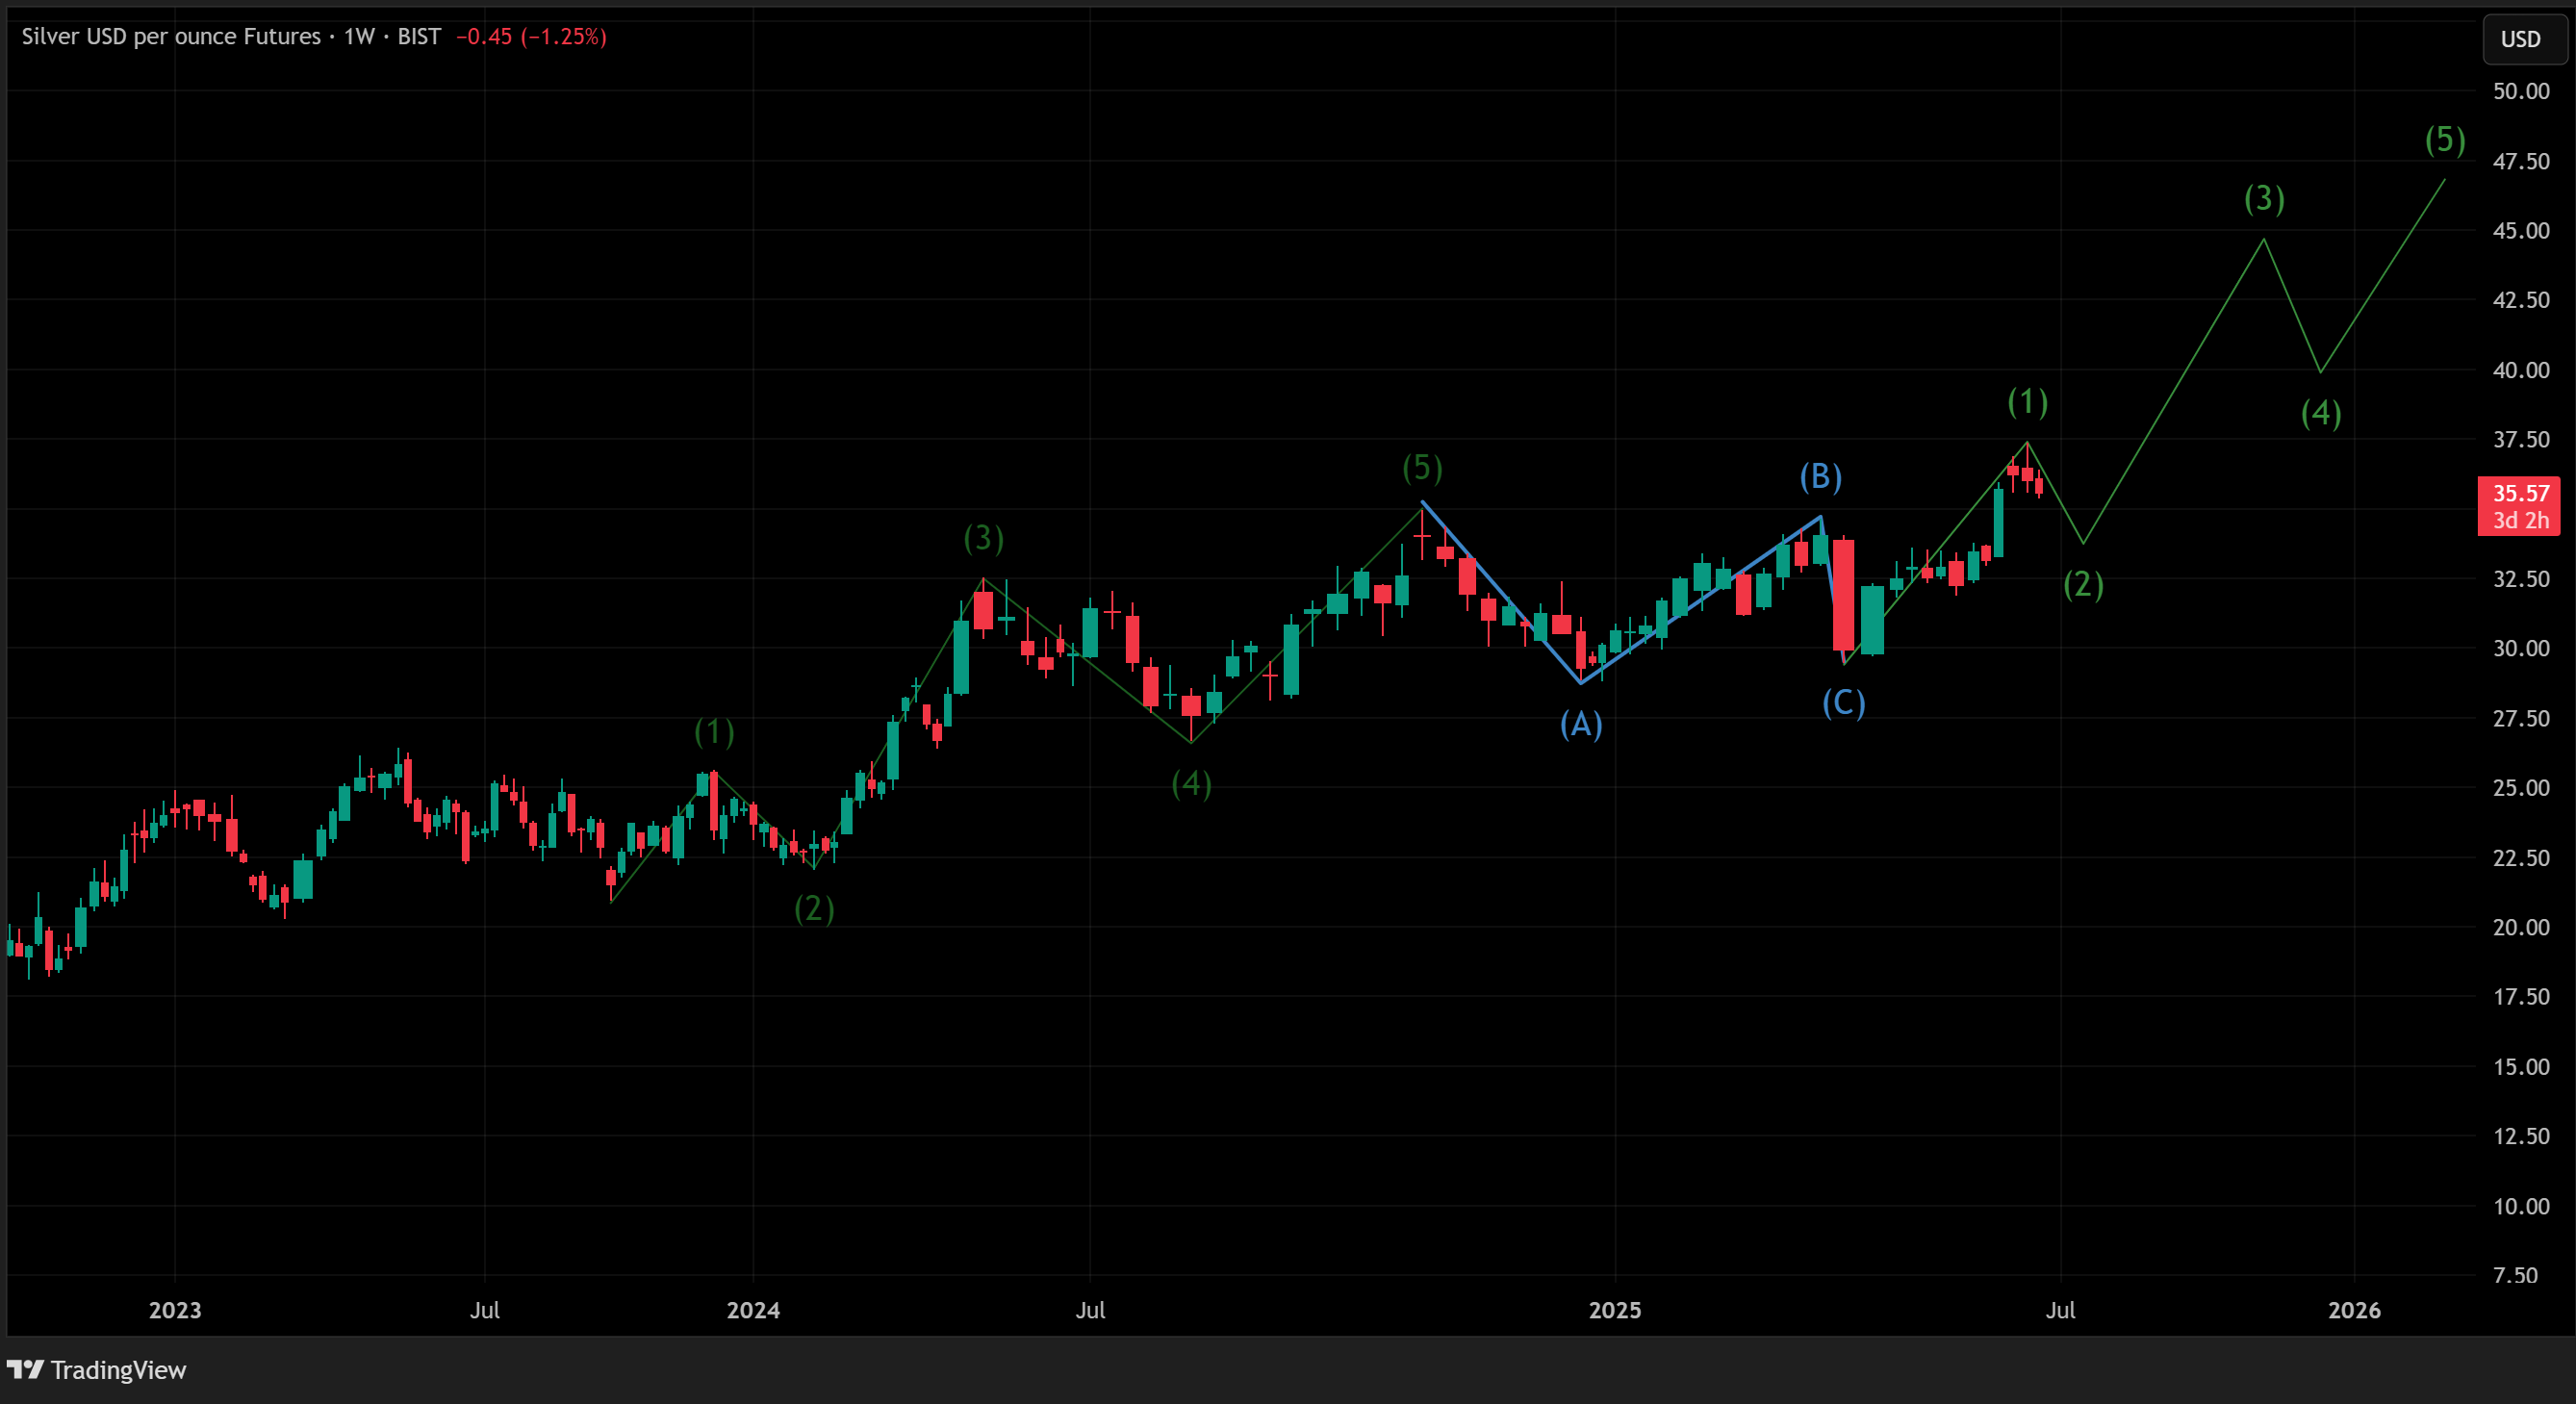
Weekly Trend:
Completed a 5-wave advance into the mid-$38s, now in an A–B–C correction.
Key support lies between $30–31.50 from prior congestion.
Daily Chart:
Price retracing into the 50-, 100- & 200-day SMAs cluster at $33.00–33.75.
1.618 fib extension sits at $33.52, reinforcing that zone.
Daily RSI is rolling off overbought territory; MACD is cresting downward.
Short-Term (2-Hour):
Bollinger Bands have snapped in from an extended squeeze; Stochastic RSI is deeply oversold.
Expect an initial bounce toward $36.00–36.50 (mid-BB & prior swing high) before sellers reassert.
Trend & Volatility Indicators:
ADX (14) on the 2-hour is above 45, signaling a strong trend and a potentially swift pullback.
ATR (14) contraction hints at a volatility pickup once the next directional move kicks in.
What to Watch For
Support Tests
First zone: $35.40–35.60 (daily Tenkan/Kijun & 0.786 fib)
Primary zone: $33.50–34.00 (50–100 SMAs & 1.618 fib)
Deep retrace: $31.70–31.80 (2.618 fib extension)
Resistance Rallies
$36.00–36.50 (short EMA & BB mid)
$37.20–38.00 (prior swing highs)
Key Momentum Triggers
2-Hour Stoch RSI > 20 to mark the short-term low.
Daily MACD turning up off its zero line to confirm the next leg higher.
Macro & Flow Signals
DXY spikes: A sudden dollar rally that coincides with a break below $33.50 negates the bull case.
ETF inflows: Renewed SLV or global ETF buying is often the spark for a run toward and above $38.
Bottom Line:
The fundamentals remain supremely supportive, negative real rates, industrial deficits, record ETF hoarding, while the technicals are painting a textbook dip-and-rip setup into the low-$30s. Position around $33.50–34.00 and watch for your triggers: this could be the last great entry before silver’s next explosive rally.