Target, Walmart, and Costco: The Retail Power Map for 2026
From margins to momentum. All three players are fighting for the same shopper, but only one model is compounding the fastest.

Big-box retail looks boring until you remember what investors are actually buying: a scale-driven supply chain, pricing power during inflationary shocks, and (in the best cases) a flywheel where digital, membership, and logistics reinforce margins.
Target, Walmart, and Costco all operate in the same physical landscape of suburban parking lots and fluorescent aisles. But beneath the surface, their economic engines are fundamentally different.

Retail is not about selling goods. It is about inventory turns, cash conversion, balance sheet flexibility, and who captures the consumer when budgets tighten. In that competition, small differences in model design compound into very different outcomes for shareholders.
Key Takeaways
Big-box retail is about systems. Supply chain efficiency, pricing power, and capital discipline ultimately determine shareholder outcomes.
Target is stabilizing, not compounding. Revenue has flattened, margins recovered, and valuation is discounted, but growth momentum remains modest.
Walmart is the defensive scale machine. Consistent revenue growth, massive cash generation, and conservative leverage make it structurally resilient.
Costco monetizes loyalty. Membership economics create predictable cash flow, strong balance sheet flexibility, and the cleanest long-term compounding profile.
Valuation reflects business quality. Target trades at a discount, Walmart at a premium, Costco at a structural premium.
Technically, all three are in bullish structures. Pullbacks across the board look corrective, not distributive.
Check out the trade plan below to see which setup offers the strongest risk-adjusted entry right now.
Company Overviews
Target TGT 0.00%↑
A discretionary-leaning mass merchant with a differentiated mix (style, home, seasonal) and a meaningful owned-brand strategy. Strong store-level experience and omnichannel execution, but more exposed to consumer “trade-down” and category volatility than peers.
Walmart WMT 0.00%↑
The scale leader in everyday value. Grocery-heavy traffic base, world-class logistics, and a growing ecosystem (eCommerce, advertising, and services). Generally the most defensive earnings profile in the group because it wins share when consumers get stressed.
Costco COST 0.00%↑
A membership-led model where the “product” is trust + value. The fee stream supports aggressive pricing and very high inventory velocity. Typically the cleanest demand signal and one of the strongest long-term compounding profiles in global retail, but valuation is often the gating factor.
Fundamental Analysis
Target TGT 0.00%↑:
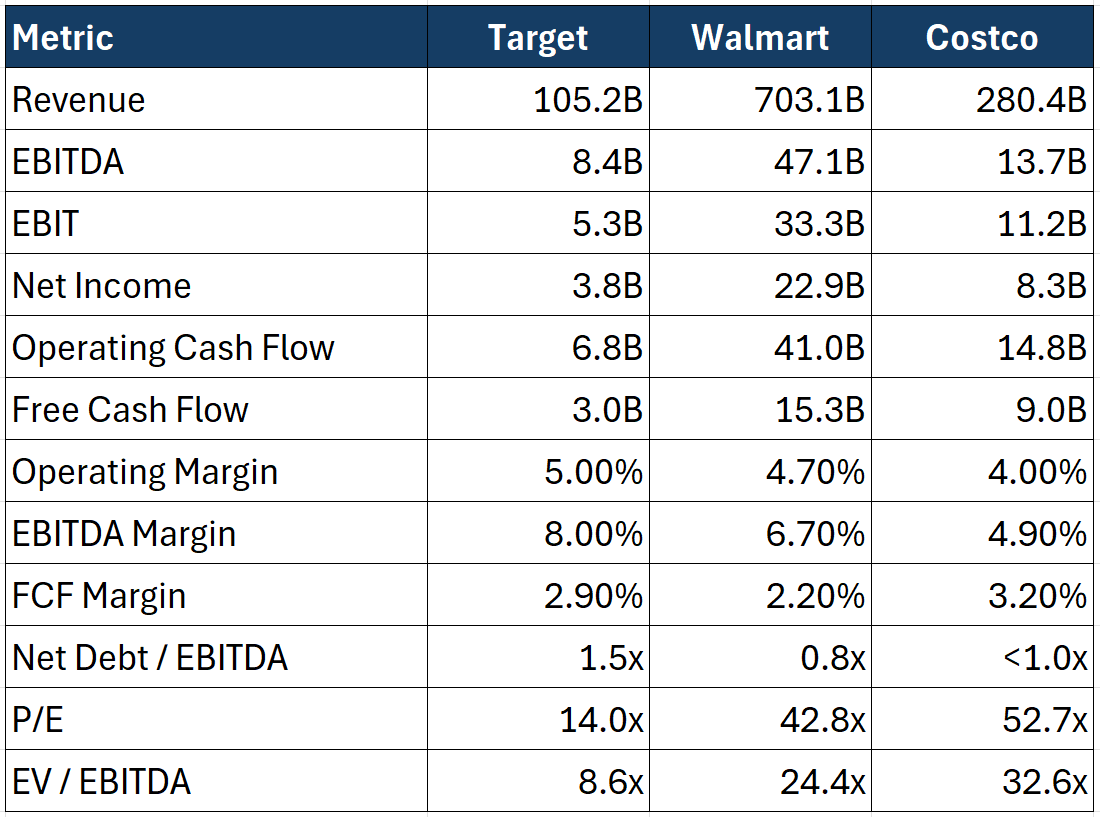
Revenue has been flat to slightly down over the last couple of years (FY2025 revenue $106.6B vs FY2024 $107.4B vs FY2023 $109.1B), signaling a slower top-line environment versus the broader industry.
Profitability stabilized vs the FY2023 trough, with EBITDA holding in the high-$8B range (FY2025 $8.7B; TTM $8.4B) after a much weaker FY2023.
Operating margin recovered to ~5.0% TTM, while EBITDA margin sits near 8.0%, reflecting improved cost discipline but not yet a full demand reacceleration.
Cash generation improved meaningfully from FY2023 (negative FCF) to positive FCF in FY2024 and FY2025 (FY2025 FCF $4.5B; TTM $3.0B), suggesting the model is normalizing after the post-pandemic inventory and mix reset.
Balance sheet posture: net debt about $12.7B and net debt/EBITDA about 1.5x (TTM), which is manageable but does reduce flexibility versus Walmart.
Valuation reflects skepticism: 14.0x P/E and 8.6x EV/EBITDA, positioning Target as the discounted recovery play in the group.
Walmart WMT 0.00%↑:
Steady top-line compounding: FY2025 revenue $681.0B vs FY2024 $648.1B vs FY2023 $611.3B. This is consistent, scale-driven growth.
Operating earnings power expanded, with EBITDA stepping up from FY2023 to FY2025 (FY2025 $42.0B; TTM $47.1B), pointing to improved mix and efficiency.
Operating margin ~4.7% TTM and EBITDA margin ~6.7%, slightly below Target structurally but significantly more stable across cycles.
FCF is positive but capex-heavy: TTM operating cash flow $41.0B vs capex $25.7B supports TTM FCF of $15.3B. This is a reinvest-at-scale story, not a harvest story.
Balance sheet posture: net debt about $35.8B but net debt/EBITDA about 0.8x (TTM), which is conservative for a business this stable.
Valuation commands a premium: 42.8x P/E and 24.4x EV/EBITDA, pricing in durability and earnings visibility.
Costco COST 0.00%↑:
Consistent revenue compounding from FY2022 $226.9B to FY2025 $275.2B (TTM $280.4B), reflecting steady warehouse expansion and strong renewal-driven traffic.
Profitability scaled steadily, with EBITDA reaching $13.7B TTM and EBIT $11.2B, without the volatility seen at Target.
Operating margin ~4.0% and EBITDA margin ~4.9% TTM, structurally lower due to the membership-led pricing model, but notably stable.
Strong and predictable cash generation: TTM operating cash flow $14.8B and free cash flow $9.0B, supported by disciplined capex and tight inventory management.
Balance sheet posture is exceptionally clean, with total debt roughly $8.1B and debt-to-capital just 1.8%, providing significant strategic flexibility.
Valuation reflects quality: 52.7x P/E and 32.6x EV/EBITDA, embedding high expectations for continued execution.
Technical Analysis
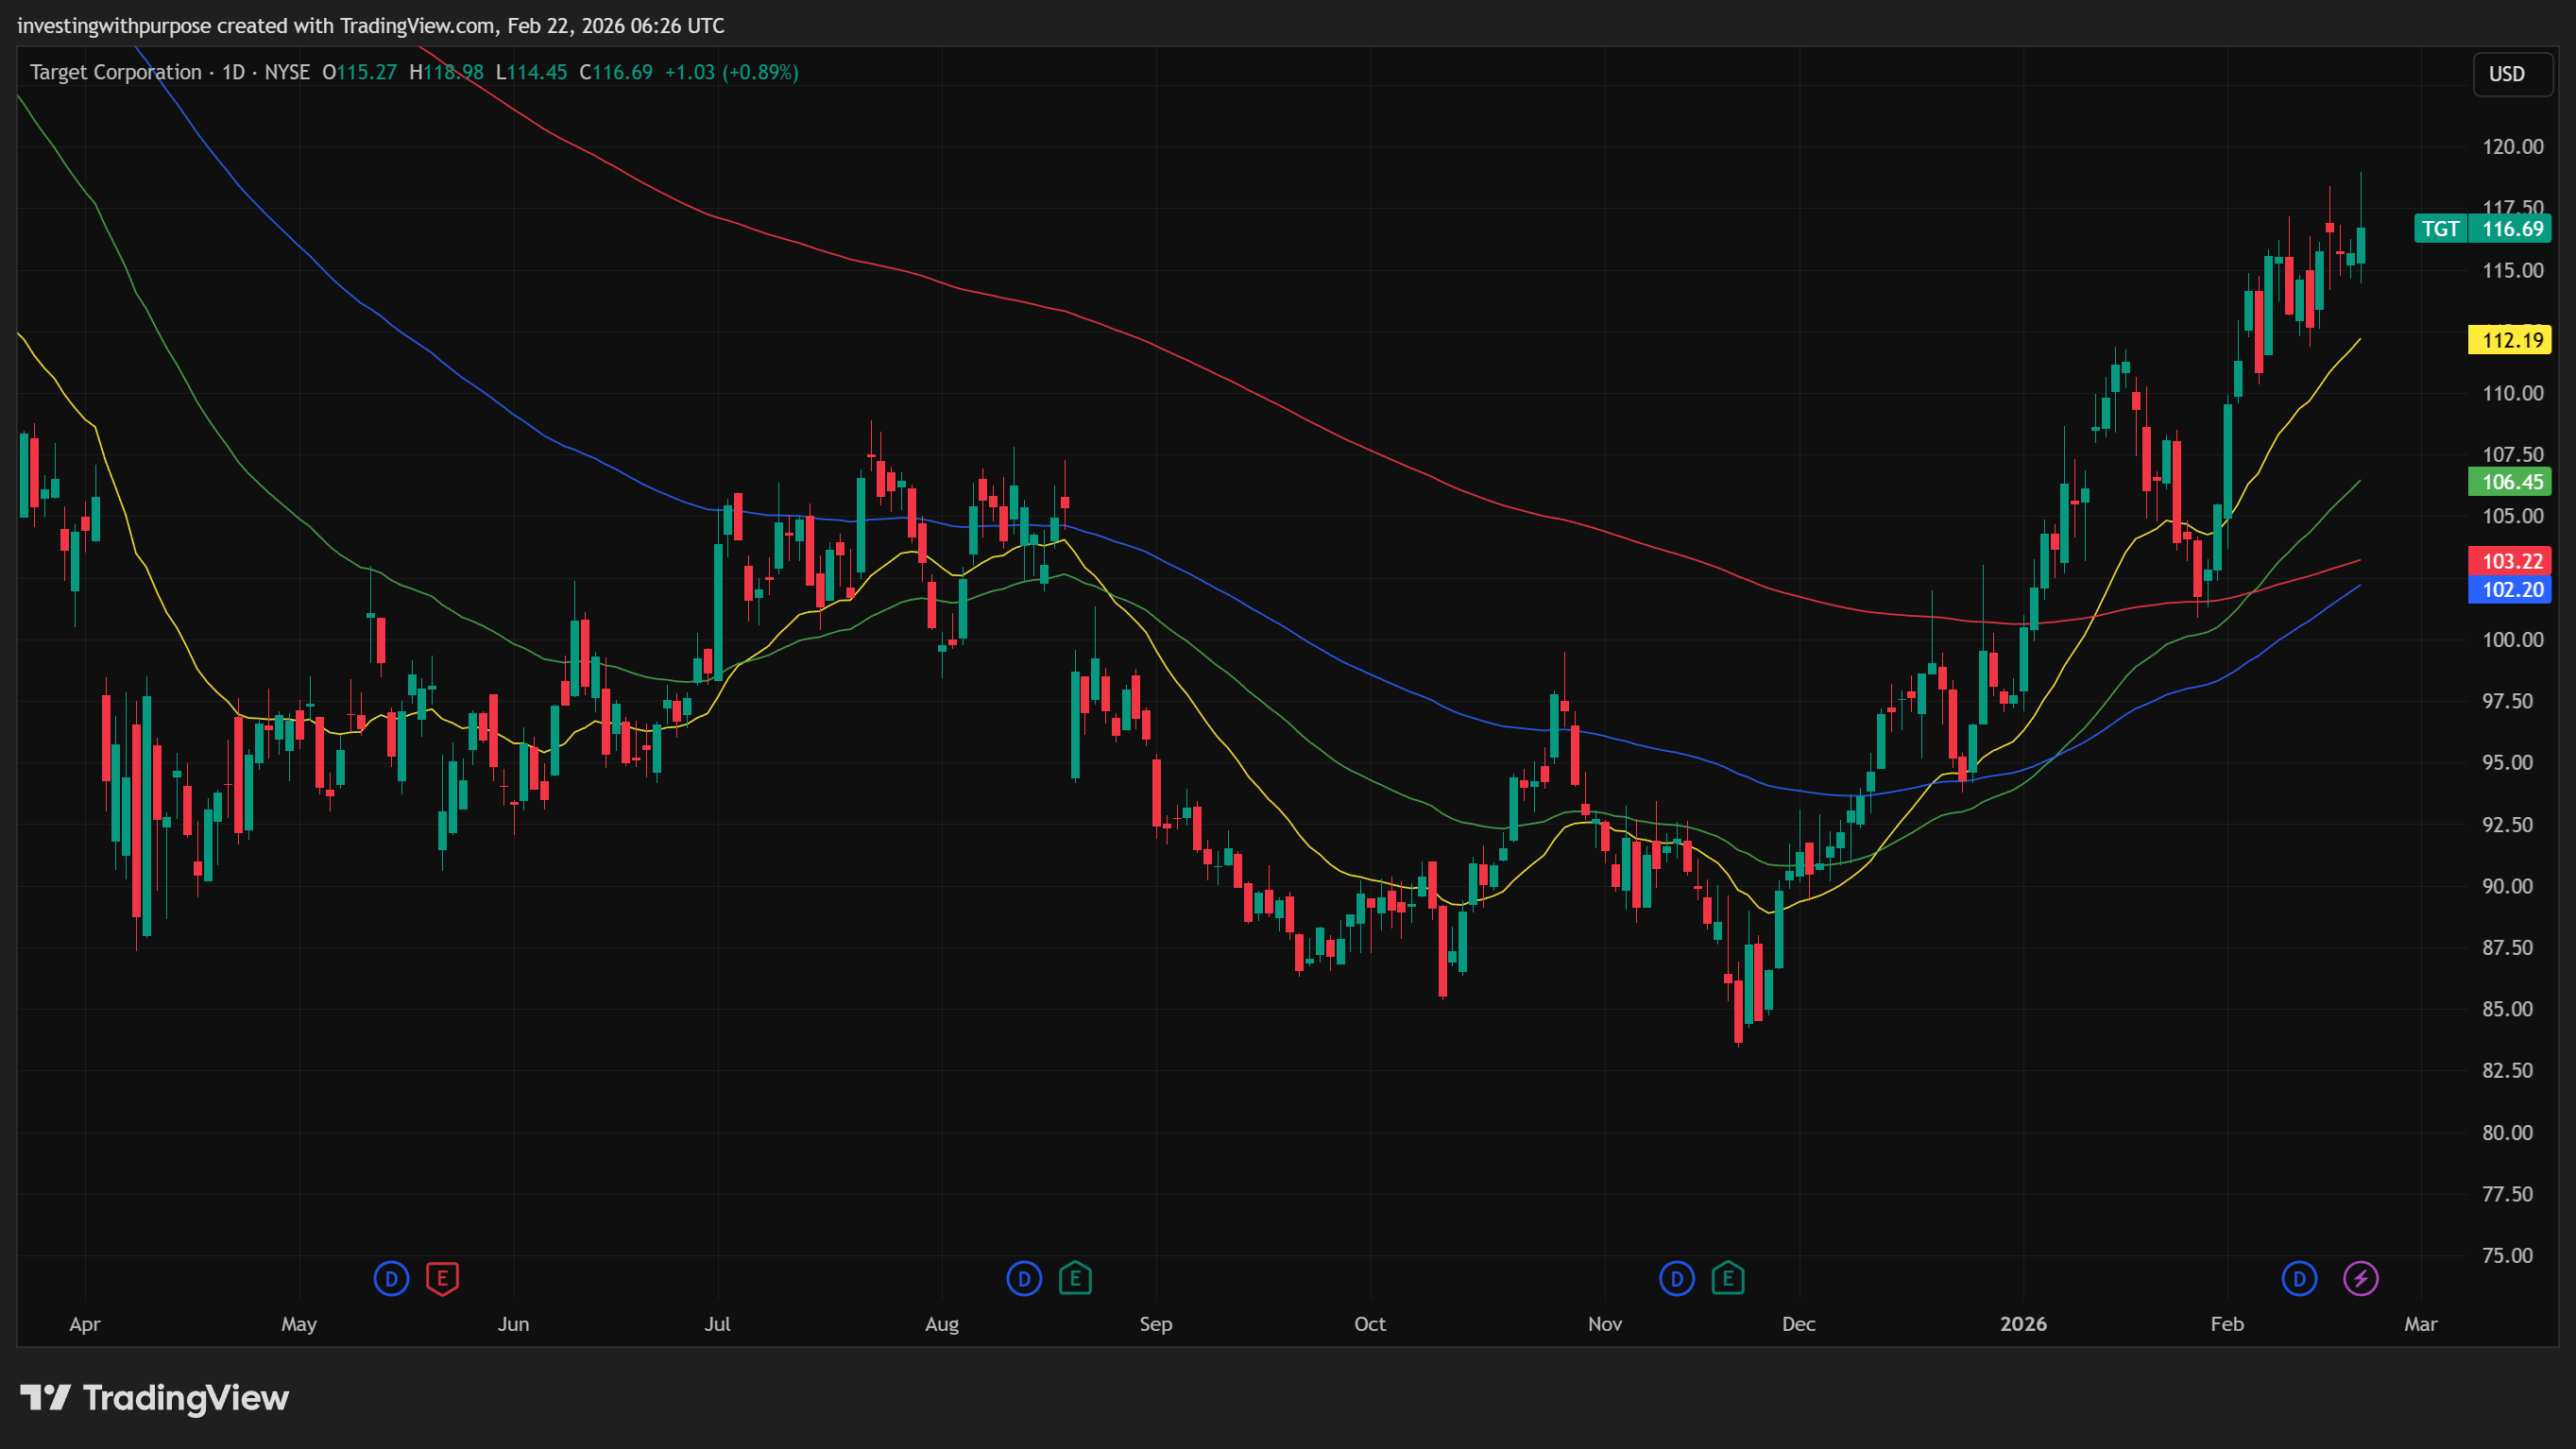
Target TGT 0.00%↑
Long-Term (Weekly/Daily)
The downtrend that dominated 2023 into early 2025 has resolved into a trend transition, with higher highs and higher lows now established.
200 EMA is turning up on the daily, and price respect of the EMA envelope shows participation from intermediate-term holders.
Weekly RSI is positive without being overbought (mid-60s), suggesting trend continuation potential.
Shorter-Term
After making a local higher high near ~$119, price corrected into the 0.618 retracement zone (~114.5), which aligns with the rising EMAs.
Momentum indicators (MACD, RSI) moderating but not bearish, implying a controlled pullback with room to reset before another leg higher.
EMAs on 1H are stacked bullish but tightening, which often precedes continuation.
After years of sideways distribution, Target finally broke higher, carving a new series of higher highs and higher lows. Long-term charts show the trend has shifted. Short-term pullbacks are normal, and momentum is cooling constructively rather than breaking down.
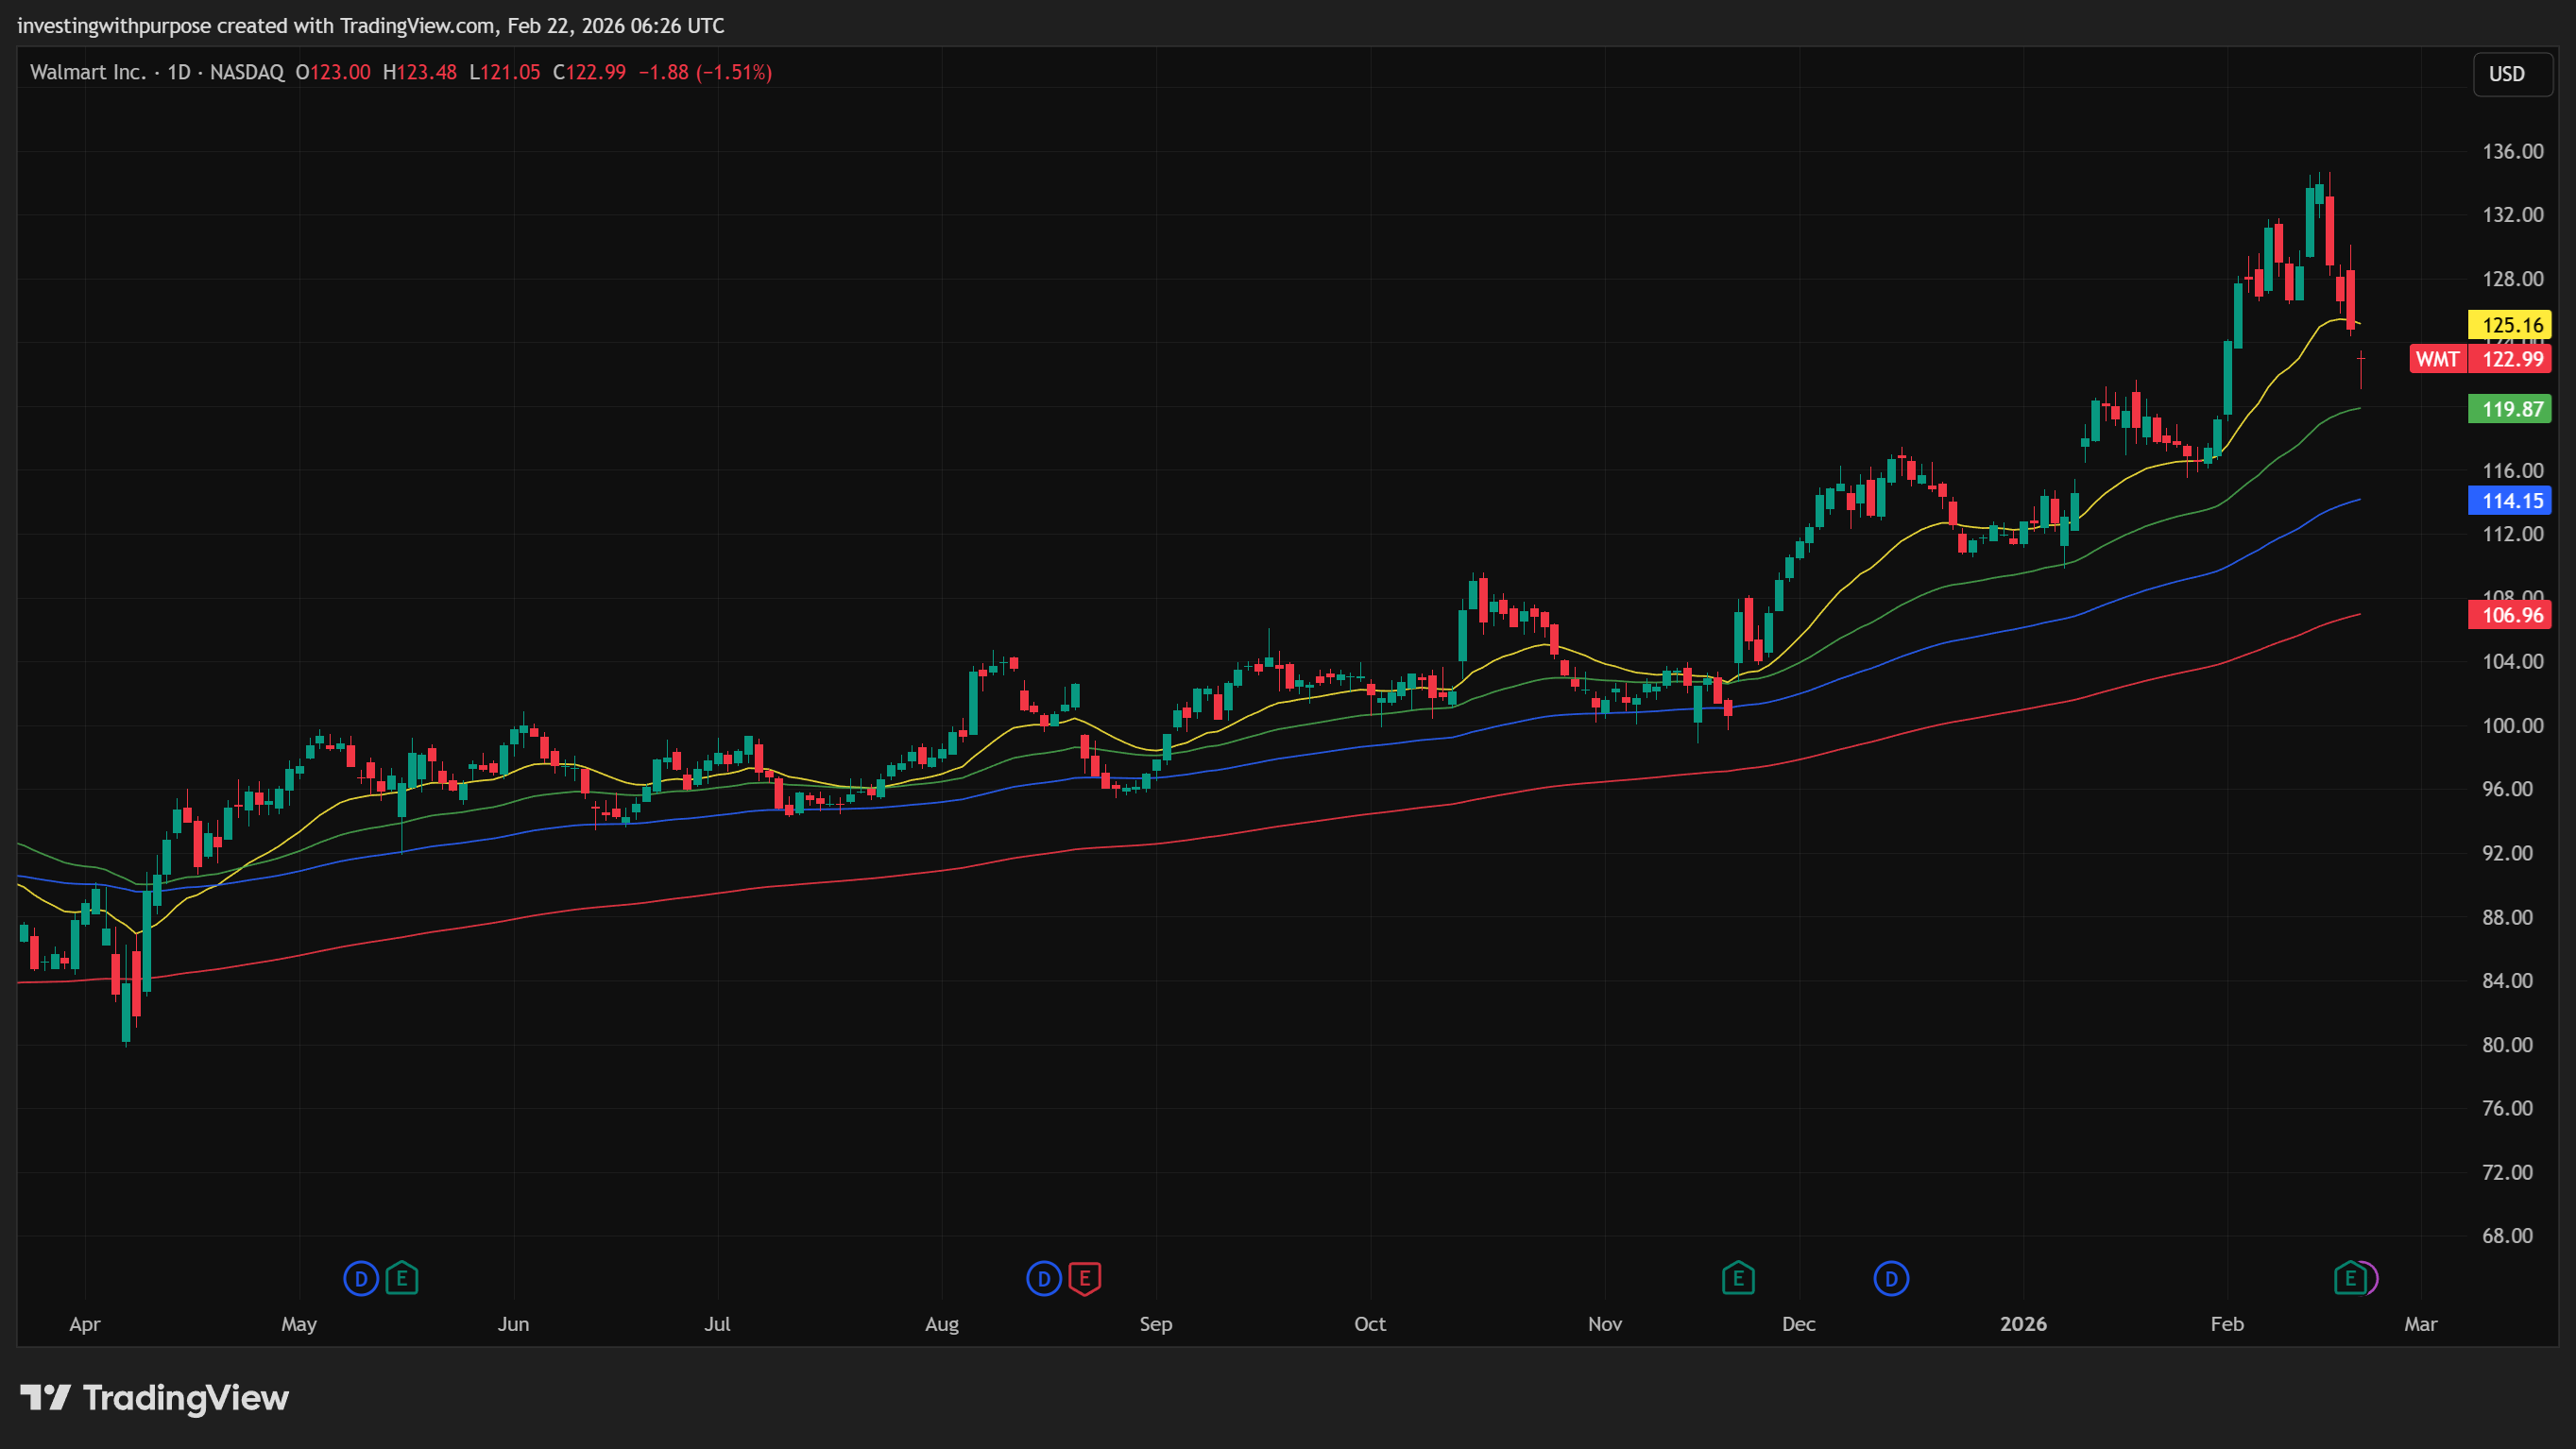
Walmart WMT 0.00%↑
Long-Term (Weekly/Daily)
Secular uptrend firmly intact — price above all major EMAs on weekly and daily.
Recent structure shows an impulsive move into late 2025 followed by a wave (4) retracement that remains shallow and orderly.
Daily MACD is flattening after a retracement — not rolling over deeply.
Shorter-Term
Pullback is testing key fib zones: 0.382 (~121) and 0.5 (~116.8). These are logical demand zones within a larger uptrend.
RSI on intraday charts is neutral, MACD is reducing bearish momentum.
1H EMAs flattening above price, indicating consolidation rather than breakdown.
Walmart’s ascent has been methodical. Its recent retracement has stayed within structural support levels. Trend remains intact across weekly, daily, and intraday timeframes, suggesting that the broader uptrend is still dominant.
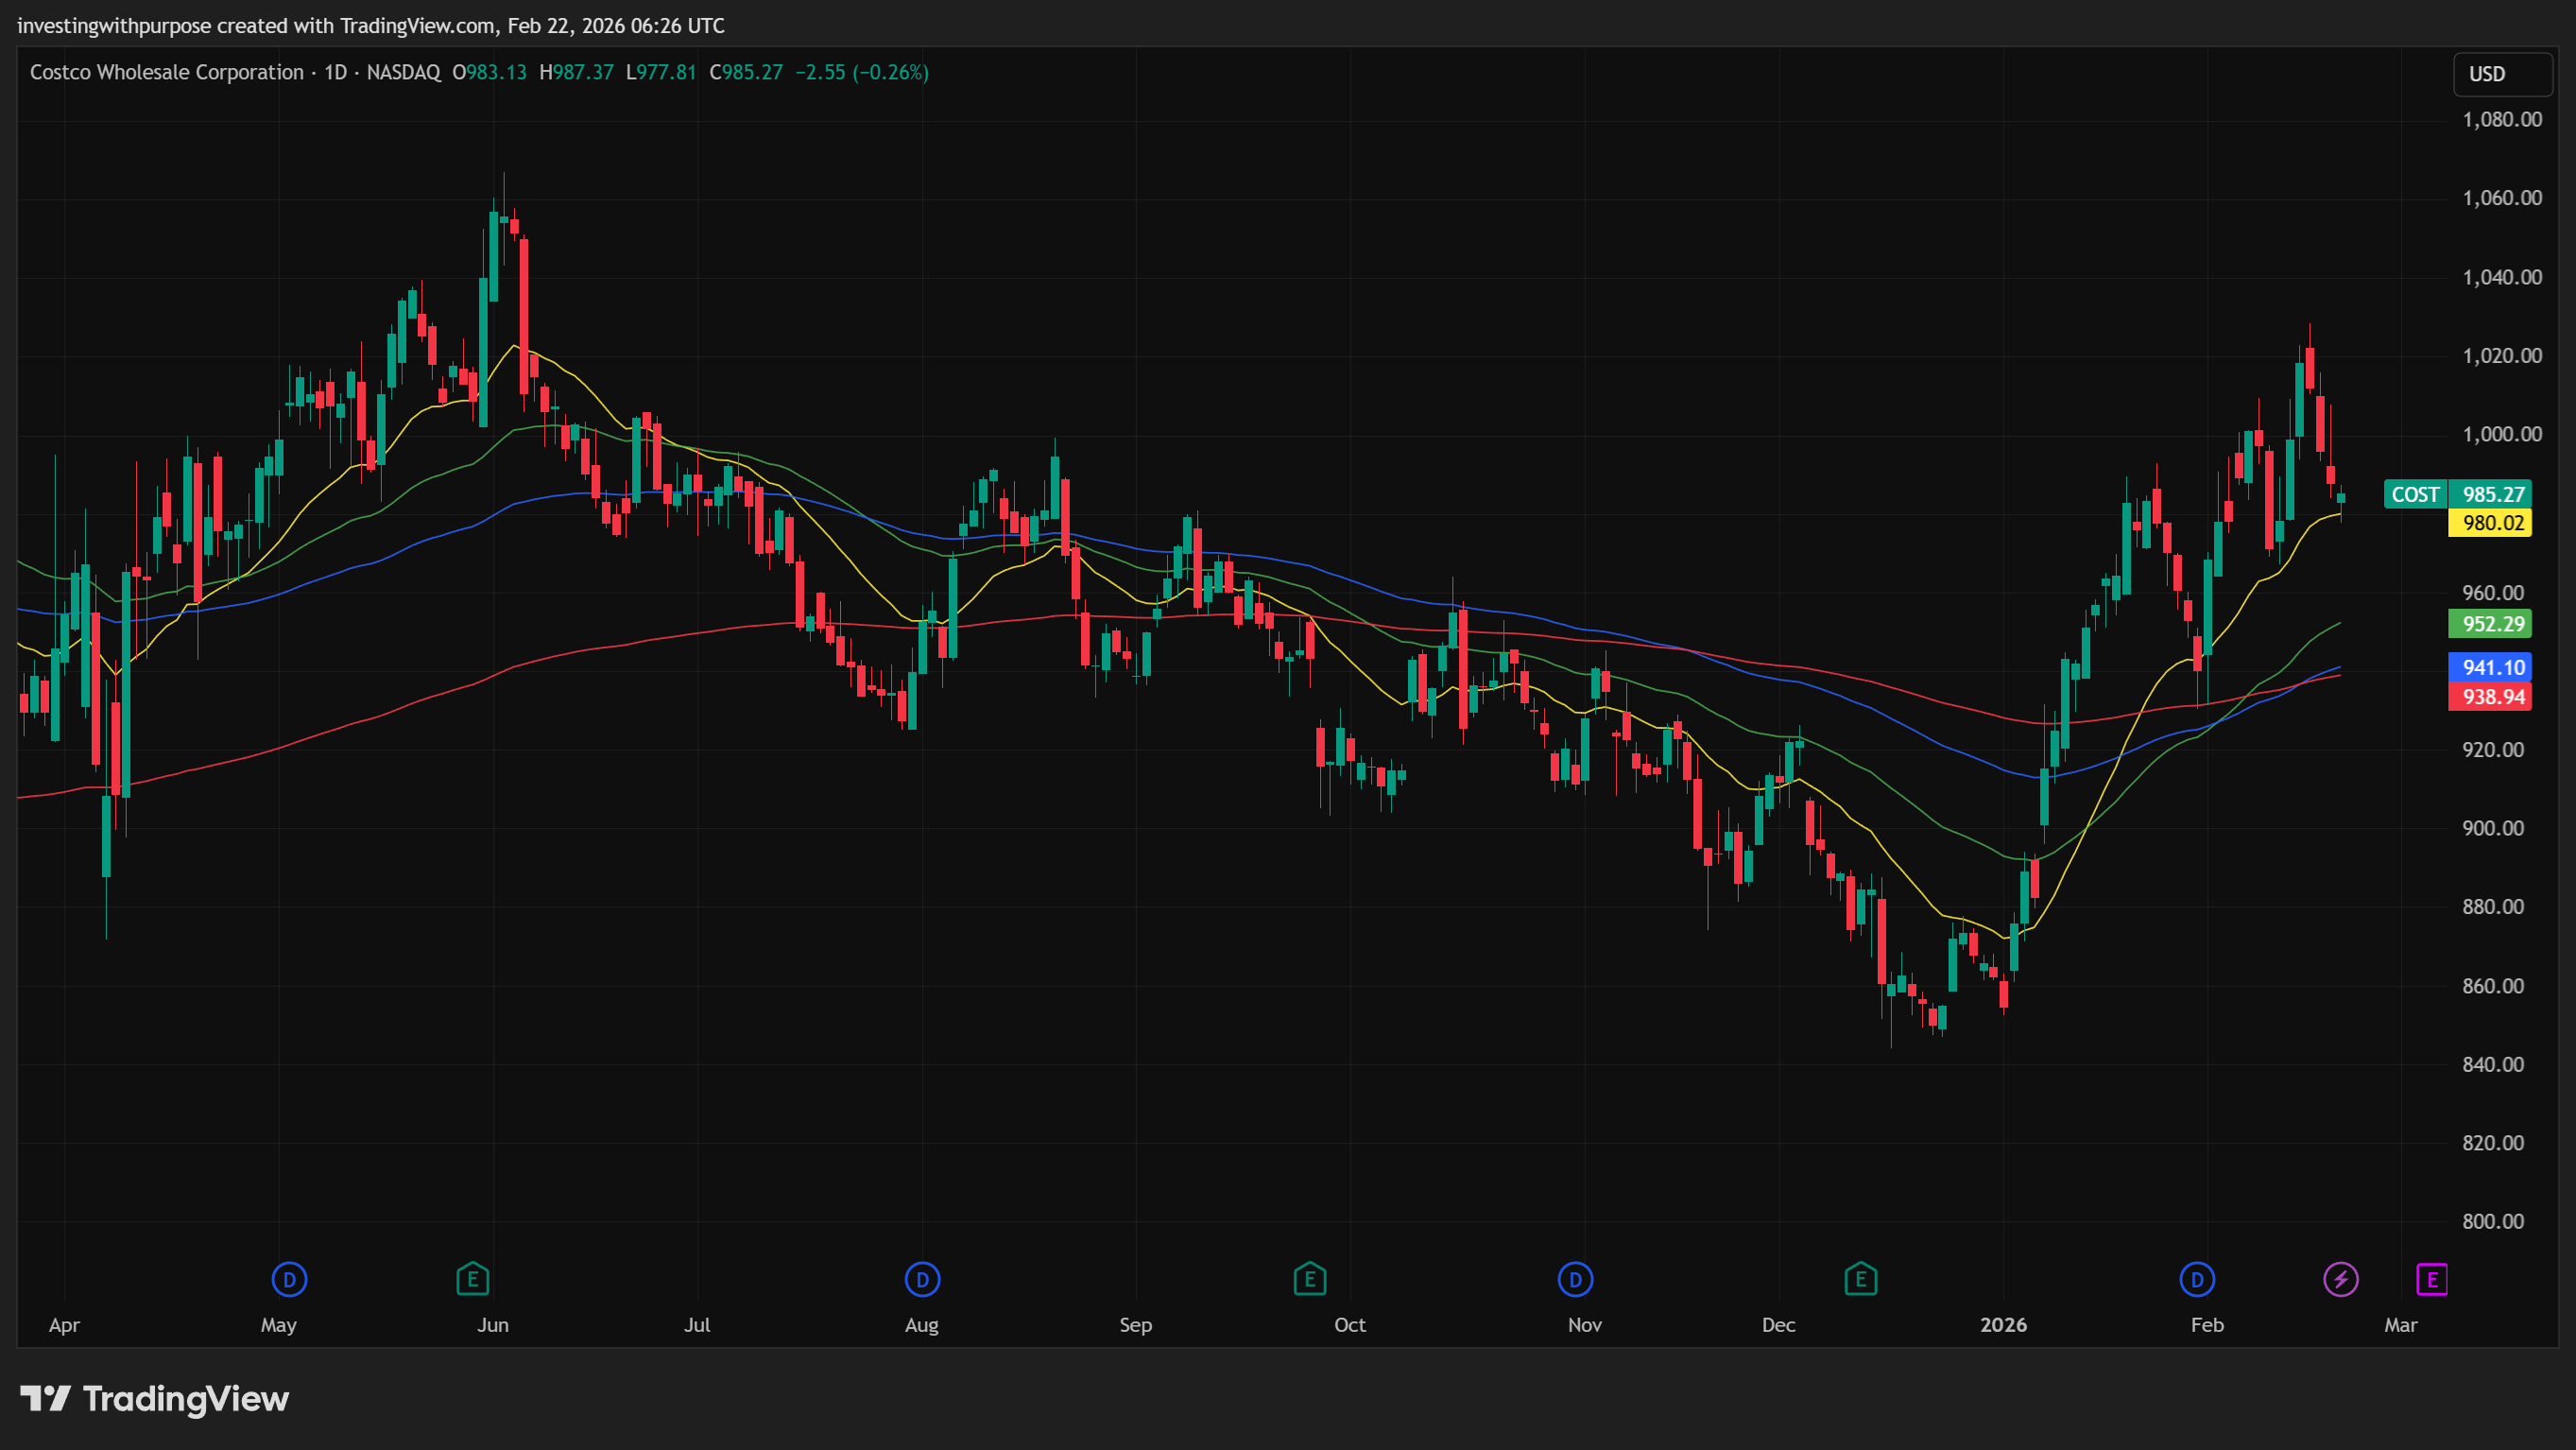
Costco COST 0.00%↑
Long-Term (Weekly/Daily)
Dominant secular bull trend from 2022 to early 2025; pullback remained shallow relative to trend.
Weekly MACD returned to positive and RSI is stabilizing above 50, indicating buyers returning.
Daily EMAs show a bullish stack with price respecting the 20 EMA on pullbacks.
Shorter-Term
After making a new local high near 1020+, price corrected into the ~977-967 demand zone (fib cluster).
Momentum on 4H/2H charts shows cooling momentum but not trend reversal.
Recent intraday lows near previous demand show support holding.
Among the three, Costco’s trend is the cleanest. After making a new high, price corrected into a high-probability demand zone and upheld support. Long-term momentum is resuming, and pullbacks are shallow, textbook trend behavior.