

TechnipFMC: The Trade Worked. Here's What's Next.
Original targets hit, 40%+ delivered, and $FTI's fundamentals just got stronger. Updated financials, technicals, and where to get back in.

A quick note before we dive in.
When we published our original TechnipFMC analysis on December 31, 2025, FTI 0.00%↑ was trading around $44–$45. The thesis was straightforward: a long-cycle offshore infrastructure business with improving fundamentals, a clean balance sheet, and a stock in a healthy consolidation before the next leg higher. Entry levels were identified in the $44.40–$45.50 zone, with a first target above $50 and a more ambitious swing target in the $55–$60 range.
Since then, the stock ran to a high of approximately $68.50 before pulling back to its current level of around $64. From the original entry zone, that represents a gain of roughly 40–45% at peak, with the current level still reflecting a ~40% return from the $45 entry. All original targets were hit. The trade worked, and it worked cleanly.
The question now is what comes next, and whether the structure supports staying involved or adding on the current pullback.

Key Takeaways
The original trade worked. FTI went from $45 to $68.50. All targets hit, 40%+ returned.
Fundamentals are stronger than they were in December. Record backlog, record pipeline, net cash, raised guidance.
The weekly trend is intact. Months of higher highs, price above every major EMA.
The daily chart is at a decision point. First MACD negative cross of the rally. The 20-day EMA is being tested for the first time.
Two setups. A breakout above $65.50 or a reset to $58–$60. Both work, neither should be rushed.
This is a level discipline story now, not a momentum story.
Company Overview
TechnipFMC remains what it was: an offshore energy infrastructure company with its economic engine concentrated in Subsea. When an oil company discovers a reservoir miles underwater, they need an entire system of pipes, connectors, and control equipment to get that oil flowing. TechnipFMC builds that infrastructure, installs it on the seabed, and then keeps it running for years. It is less a drilling company and more a specialized engineering and installation business. One whose revenues are tied to long, multi-year contracts rather than the day-to-day price of oil.
The iEPCI™ (integrated Engineering, Procurement, Construction and Installation) model remains the commercial differentiator. It compresses project risk, shortens cycle times, and makes FTI the counterparty of choice for complex deepwater developments. Over 80% of Subsea inbound in 2025 came through direct awards, iEPCI, and Subsea Services - a structural share of commercial activity that reflects genuine competitive positioning rather than opportunistic bidding.
Nothing about the business model has changed since December. What has changed is that the results have now confirmed what the thesis anticipated.
Fundamental Update: Q4 2025 Results
TechnipFMC reported Q4 2025 earnings on February 19, 2026. The results were strong across every metric that matters.
Full-Year 2025 Highlights
Revenue grew 9% year-over-year to $9.93 billion, driven by continued Subsea execution. Subsea alone contributed $8.67 billion, up significantly from the prior year.
Adjusted EBITDA came in at $1.82 billion, up 33% versus 2024, excluding foreign exchange. Subsea EBITDA margins improved 340 basis points year-over-year; Surface Technologies improved 170 basis points.
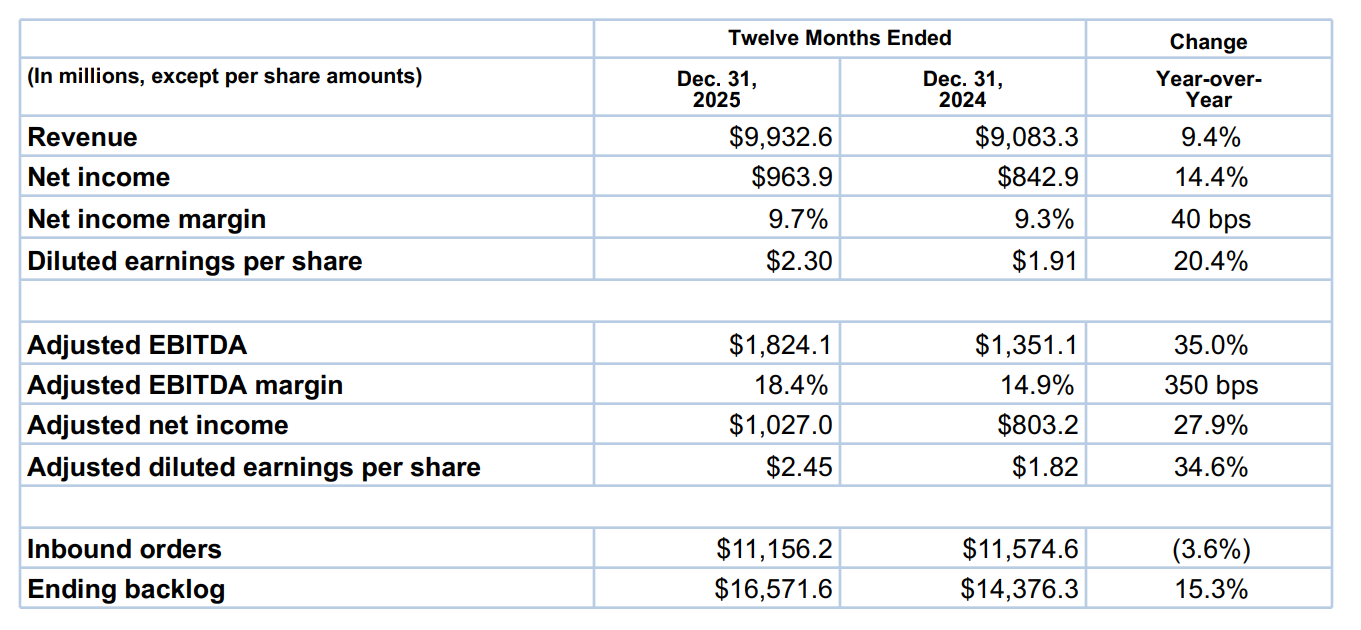
Free cash flow reached $1.45 billion for the full year, more than double 2024 levels. Cash provided by operations came in at $1.76 billion. Capital intensity remains manageable at $317 million in capex.
Capital returns totaled $1 billion returned to shareholders, more than double 2024 distributions, through a combination of share repurchases and dividends.
Balance sheet: Gross debt fell by $455 million over the year. The company ended 2025 in a net cash position of $602 million, with $1.03 billion in cash and only $430 million in total debt. This is a materially different credit profile than the FTI of prior cycles.
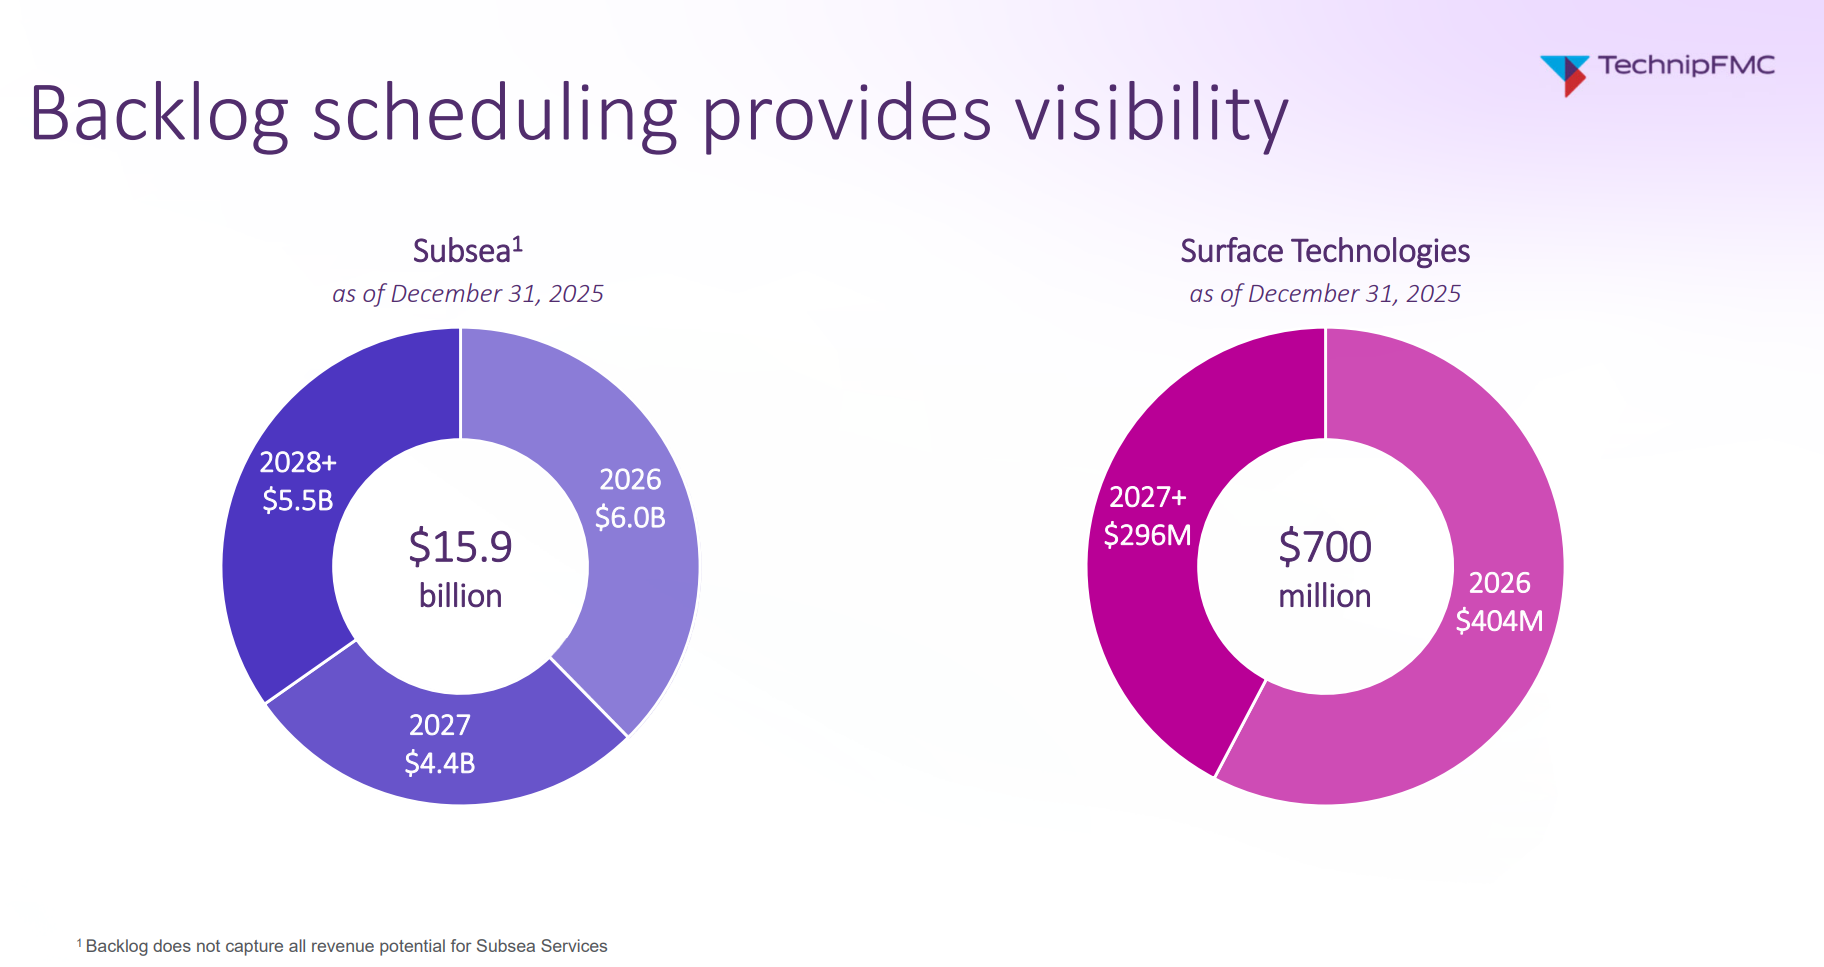
Backlog stood at $16.6 billion at year-end, up 15% year-over-year, providing multi-year revenue visibility that reduces exposure to short-term commodity volatility.
The Opportunity Pipeline
Perhaps the most compelling forward-looking data point: FTI’s Subsea Opportunities List, which are projects eligible for potential award over the next 24 months, stood at $29 billion in combined value at the Q4 update, up from $27.8 billion the prior quarter. This is a record. The pipeline spans every major offshore area (Brazil, West Africa, Norway, Asia Pacific, the Gulf of Mexico) and includes projects from Petrobras, Equinor, TotalEnergies, Shell, ExxonMobil, bp, Chevron, and others. Projects valued above $1 billion account for a significant portion of that total.
This is not an opportunity list padded with speculative items. These are defined projects at various stages of pre-FID and FID readiness, with FTI 0.00%↑ already engaged commercially on many of them.
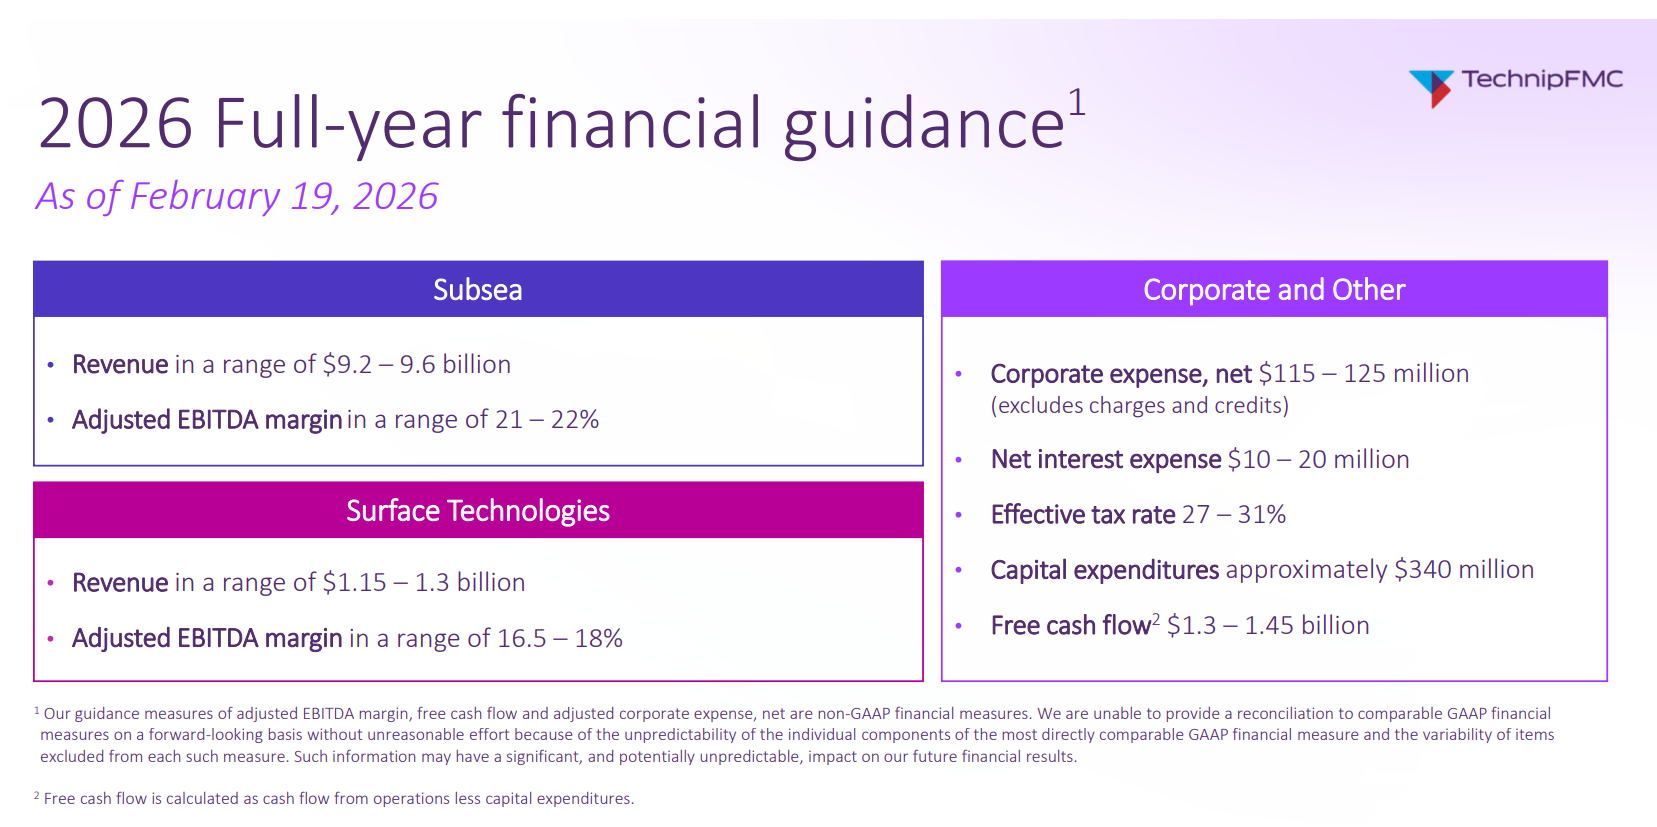
2026 Guidance
Subsea revenue: $9.2 – $9.6 billion
Subsea adjusted EBITDA margin: 21 – 22%
Surface Technologies revenue: $1.15 – $1.3 billion
Surface Technologies adjusted EBITDA margin: 16.5 – 18%
Free cash flow: $1.3 – $1.45 billion
Capital expenditures: ~$340 million
The Subsea margin guidance of 21–22% is a step up from the 20.1% achieved in 2025. Management increased this guidance specifically at the Q4 print, signaling continued confidence in mix and contract quality. If achieved, this would represent the highest sustained Subsea margin in the company’s history.
Fundamental takeaway: TechnipFMC’s Q4 2025 results validated the original thesis entirely. Revenue growth, margin expansion, cash generation, and balance sheet quality all moved in the right direction. The 2026 guidance implies another year of progress, with Subsea margins set to inflect higher and free cash flow remaining robust. The company is executing exactly as the thesis anticipated, and the forward pipeline suggests the cycle has further to run.
Technical Analysis
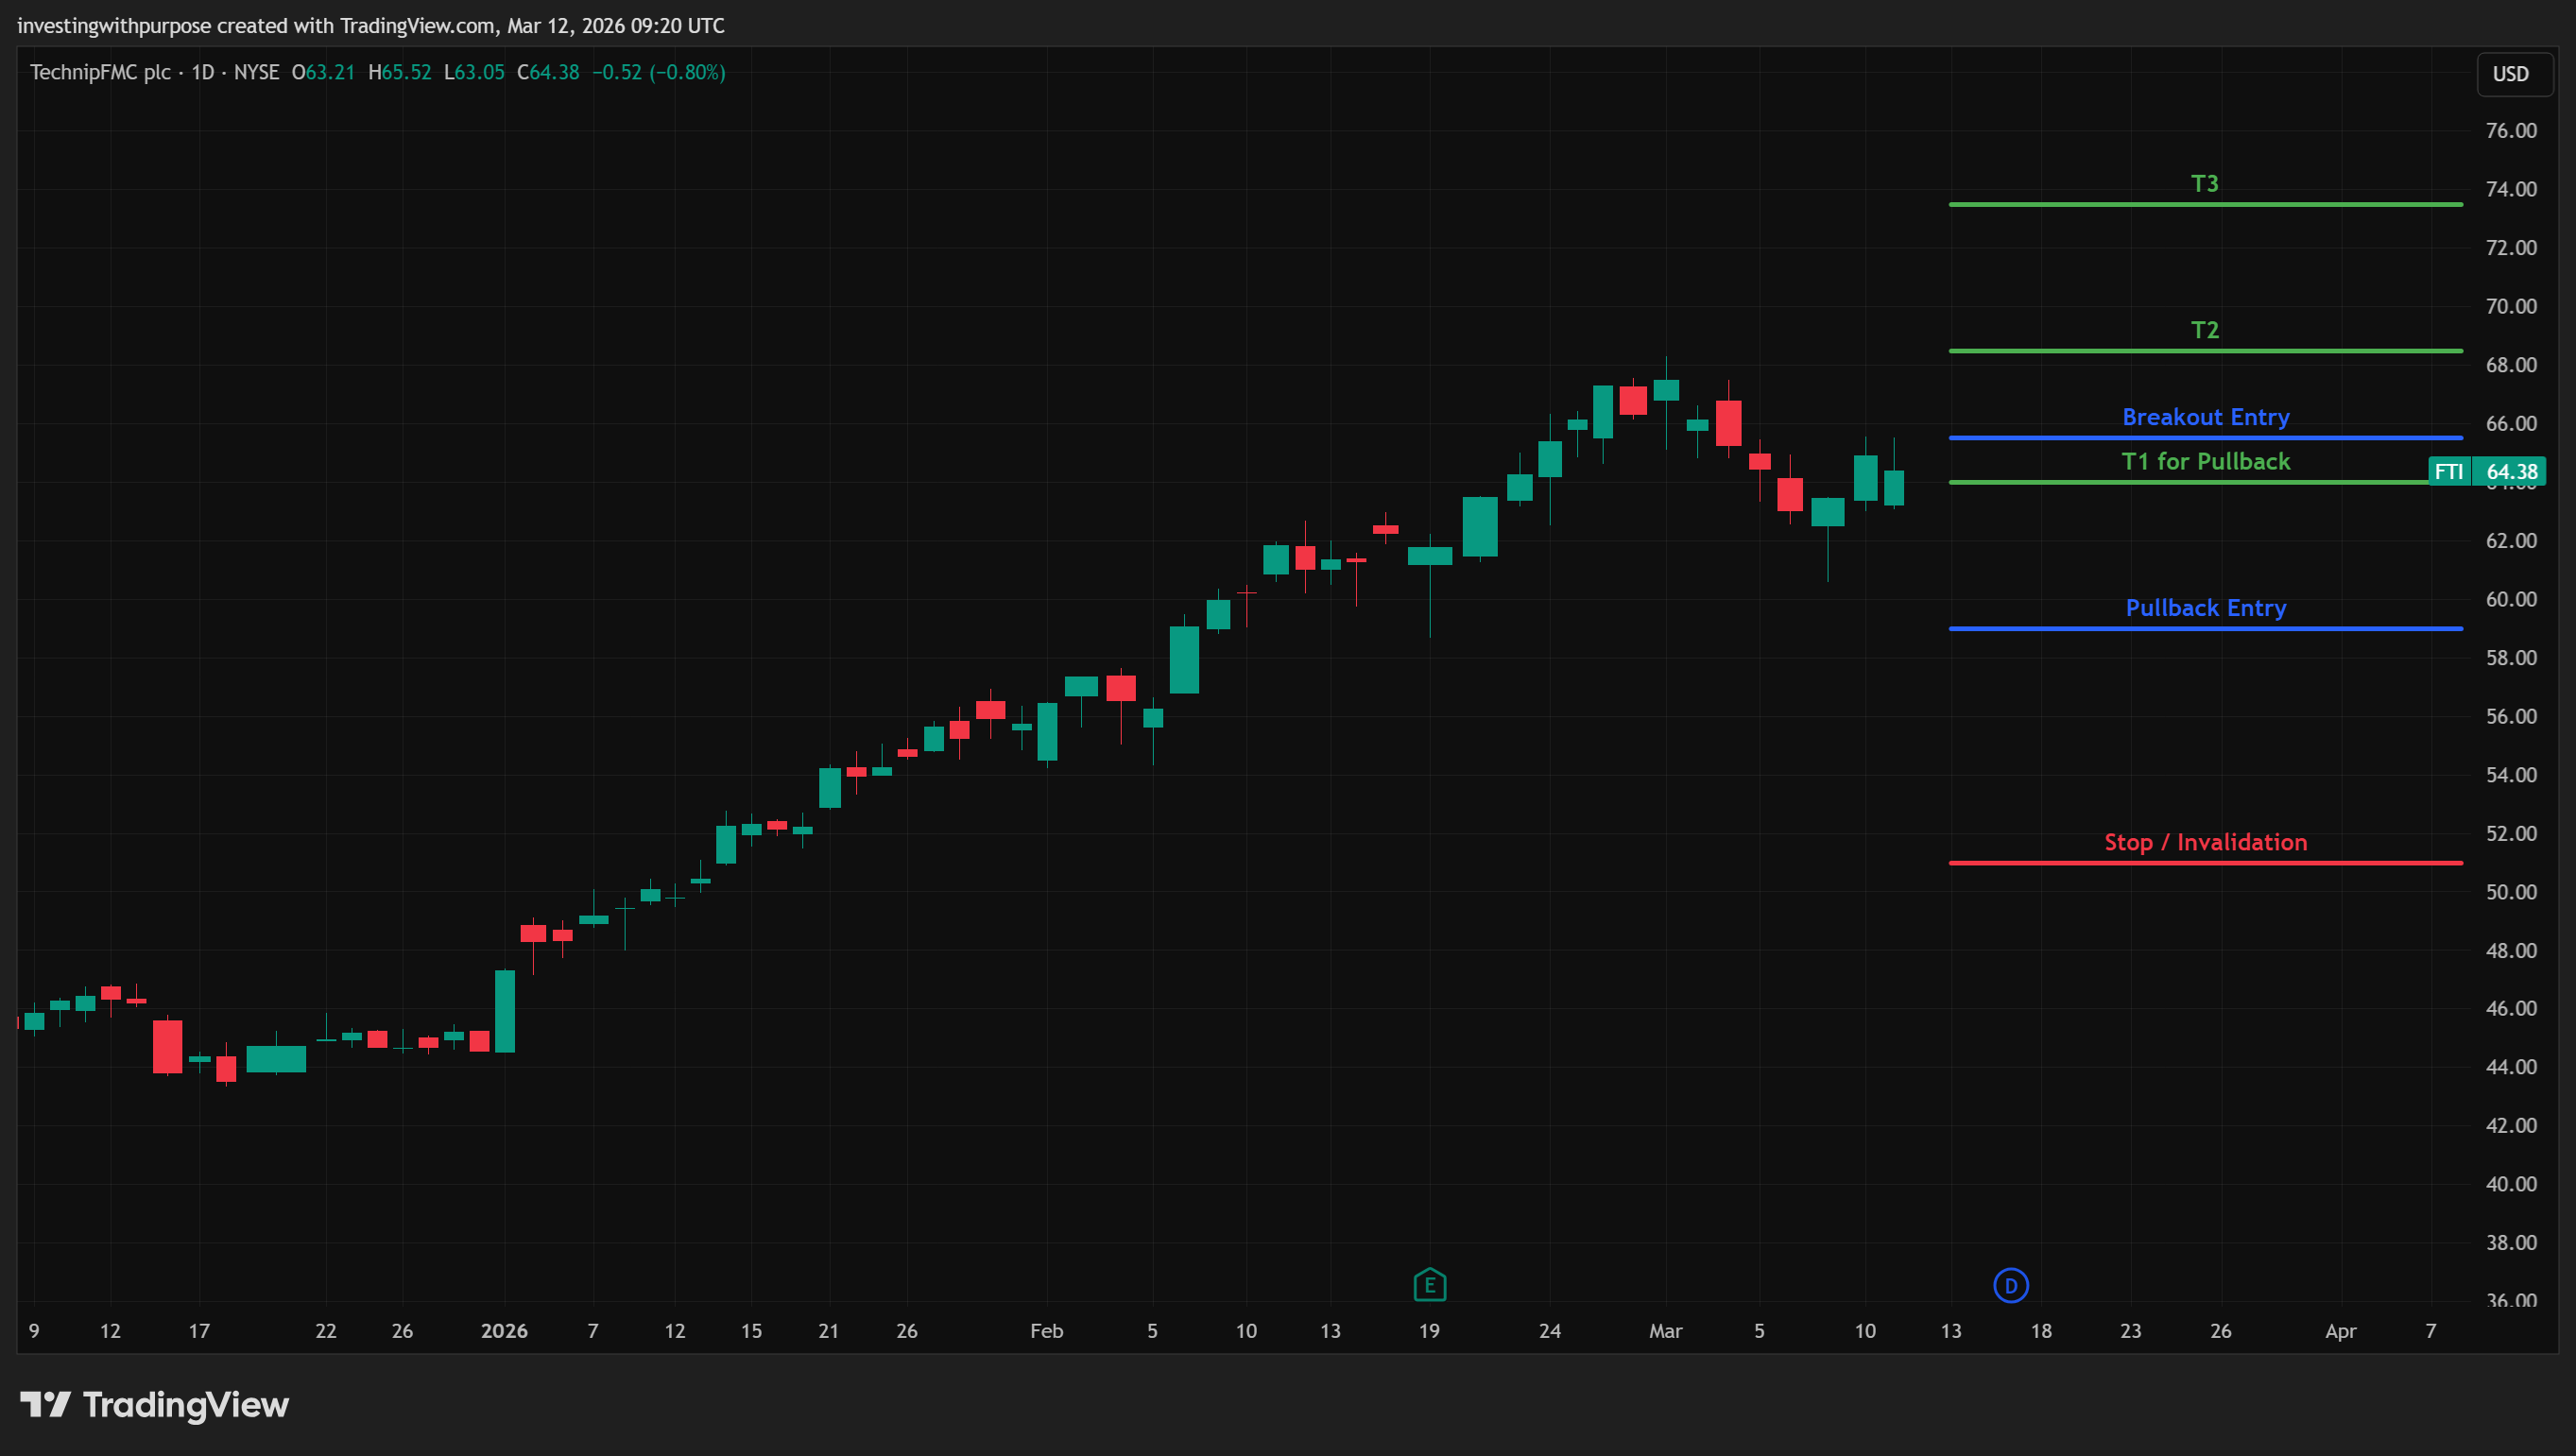
Daily chart
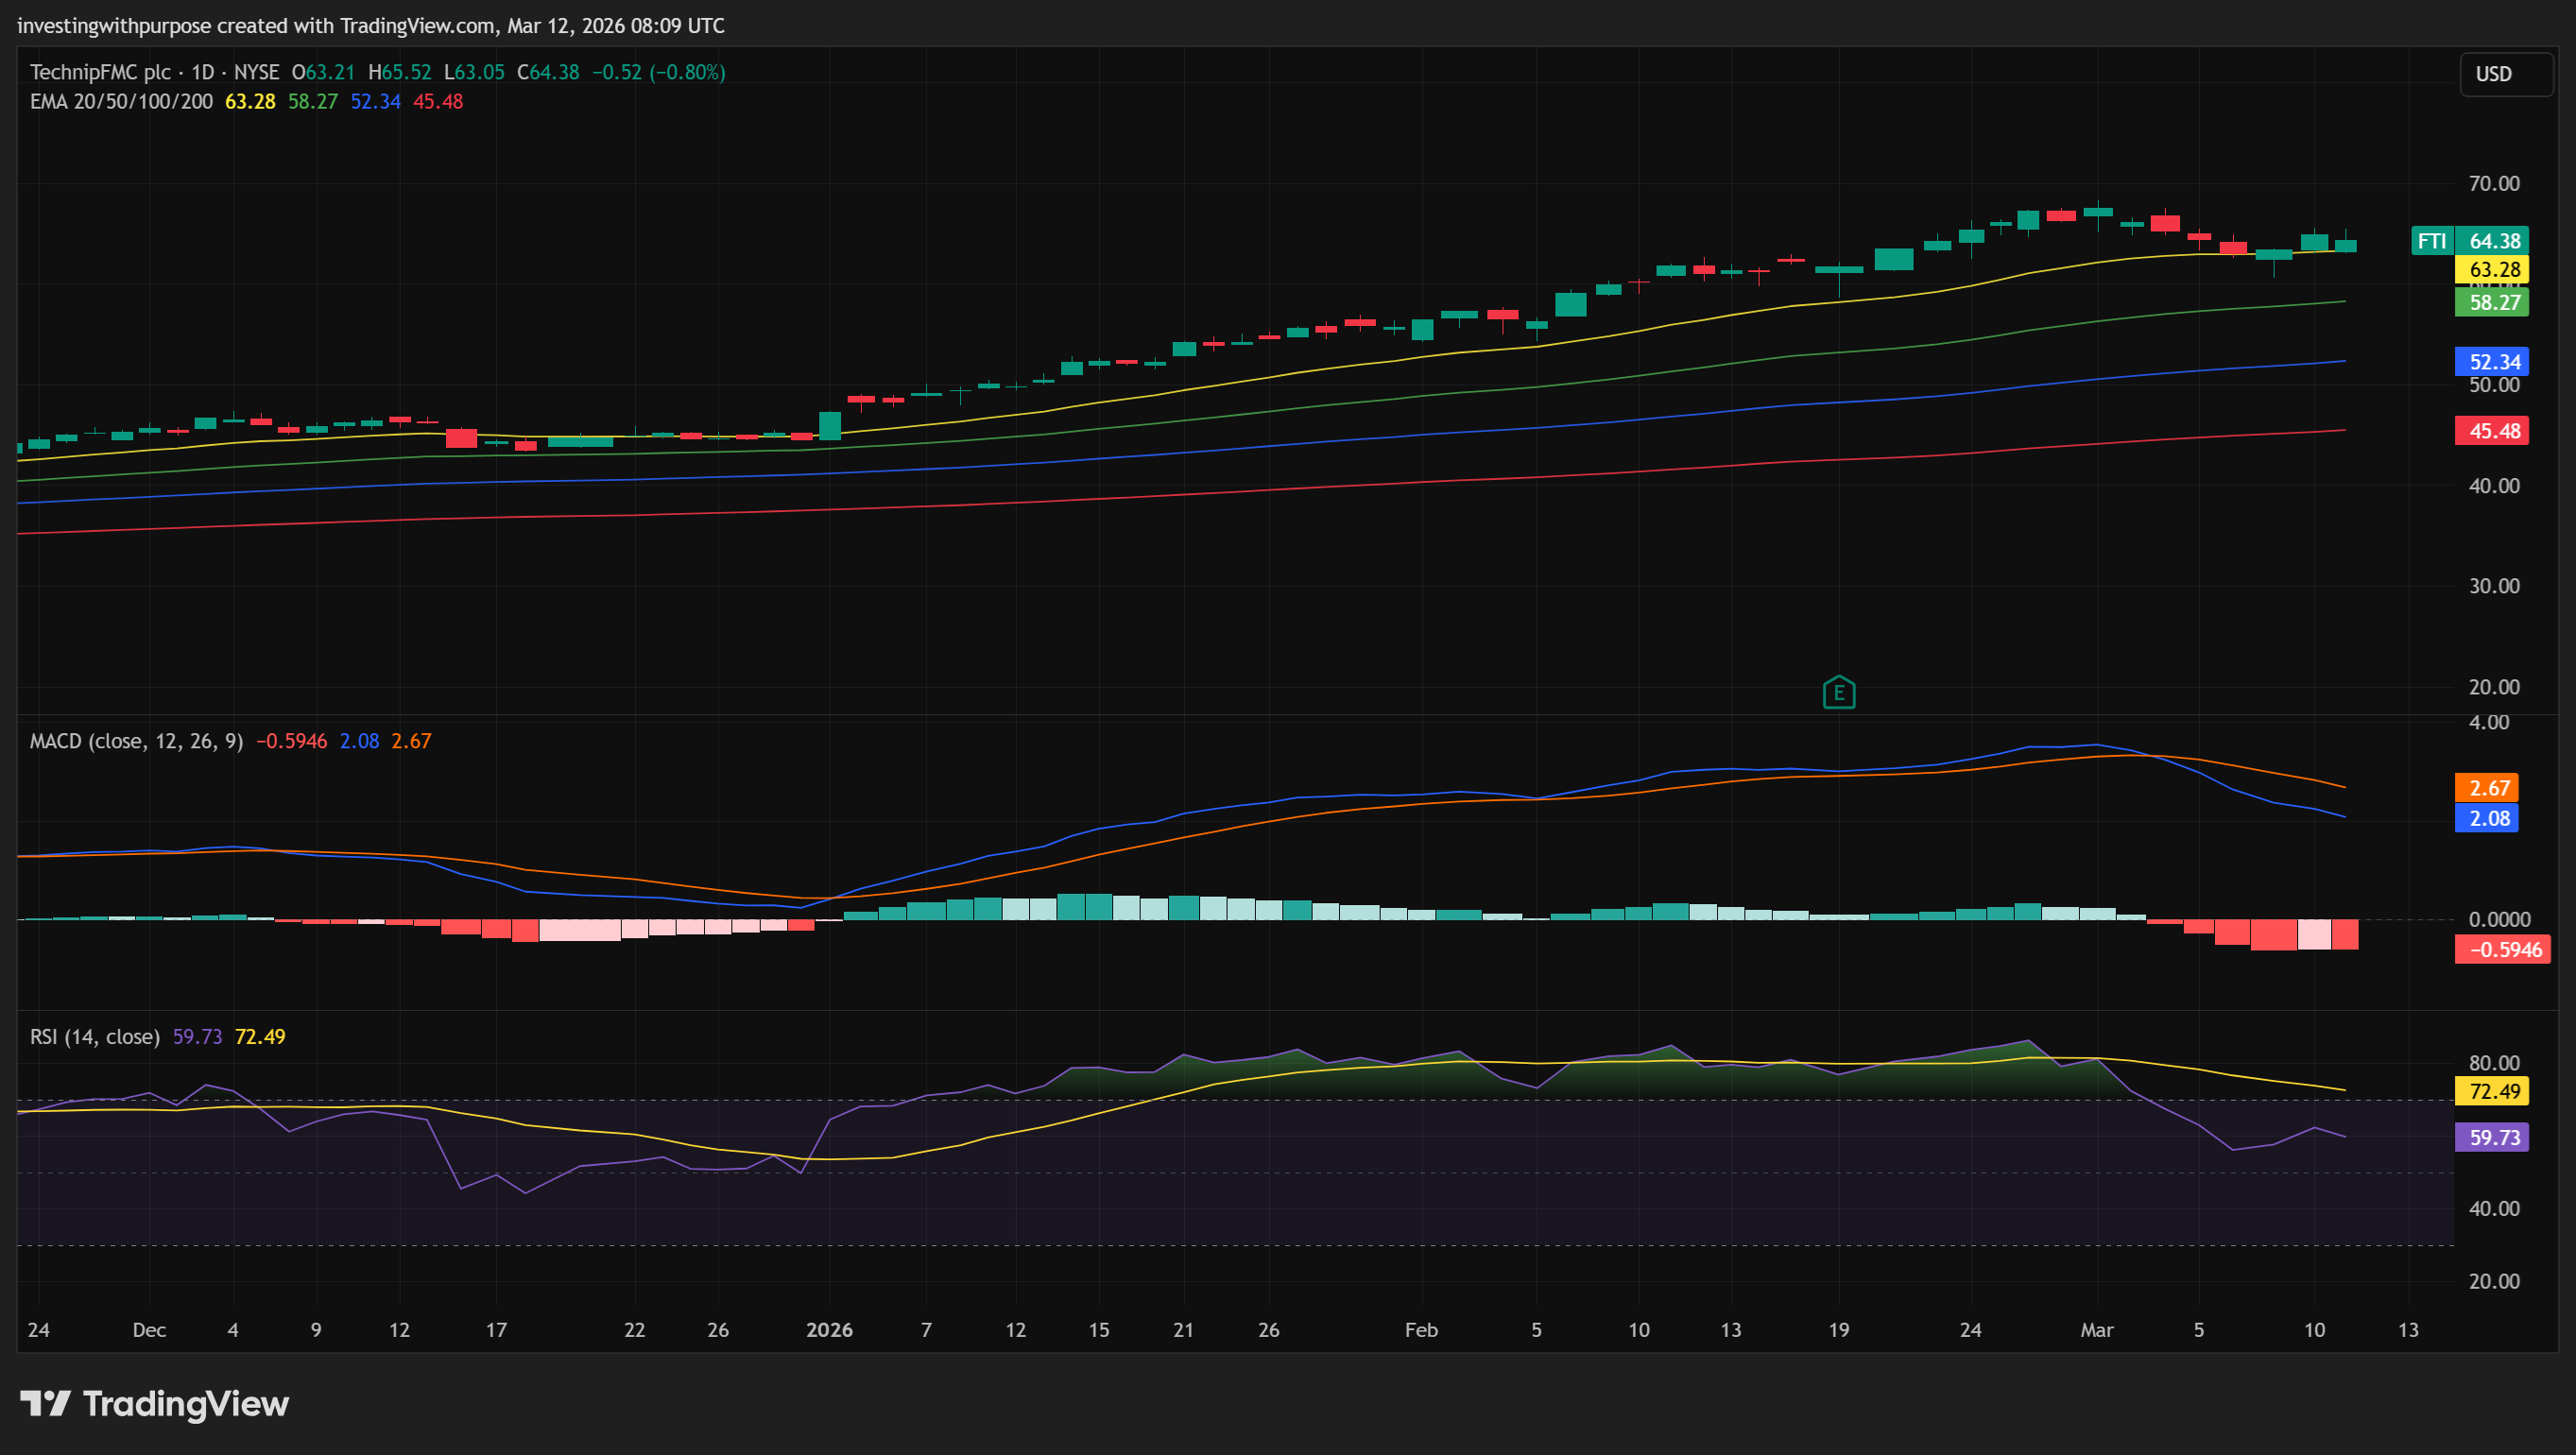
FTI’s daily chart tells the story of 2025–2026 in one clean picture: a steady, almost uninterrupted advance from the mid-$30s in mid-2025 to a February peak near $68.50, followed by the current pullback and consolidation. The trend structure is intact. Every EMA is rising and stacked bullishly, but the easy phase of this move is behind us.
The EMA spread is unusually wide, which is typical after a large trending move, and it also means a normal correction could be deeper than expected. Price has already pulled back from the $68.50 high and is now sitting near the 20-day EMA, the first real test of short-term trend support since the rally began.
Daily momentum indicators are giving mixed signals. MACD has crossed negative, a clear sign the near-term trend has cooled, but RSI remains elevated around 60. That divergence is worth watching: RSI has not confirmed the MACD deterioration yet, which leaves open the scenario of a quick dip and recovery. But if RSI rolls downwards while MACD stays negative, the corrective case may pick up.
Key daily levels:
Support: $63.28 → $61–$62 → $58.27 → $53–$55 (deeper structural reset zone)
Resistance: $65.50–$66 (recent consolidation ceiling) → $68.50 (February high)
Trend invalidation on the daily: A daily close below $58 would break the short-term uptrend structure meaningfully
Weekly chart
On the weekly timeframe, the picture is straightforwardly bullish. FTI has printed higher highs and higher lows almost without interruption, consistently closing above its weekly 20 EMA.
The weekly EMA stack tells you everything you need to know about the trend’s health. The 20-week EMA sits at $53.52 going all the way down to the 200-week at $28.71. Price around $64 is trading well above all EMAs, and crucially, the gap between price and the 20-week EMA (~$11) is the widest it has been in a very long time. That kind of extension from the mean is normal in strong trends, but it also tells you that a deep reversion would be completely healthy.
Weekly MACD is strongly positive. while RSI is still well above 70. Historically, weekly RSI sustained above 75–80 without a meaningful pullback is rare. This does not mean the stock is about to collapse, but it does mean that a reset toward the 50-60 range is the normal and expected outcome before the next leg higher.
Key weekly levels:
Support: $53–$55 → $44–$46 (50-week EMA / major structural support) → $36–$38 (100-week EMA / only relevant if thesis breaks)
Resistance: $65.52 → $68.50 → $72–$75 (next measured extension)
Trend remains intact as long as price holds above the 20-week EMA ($53.52) on a weekly closing basis. A close below that level would be the first genuine structural warning signal in this entire move
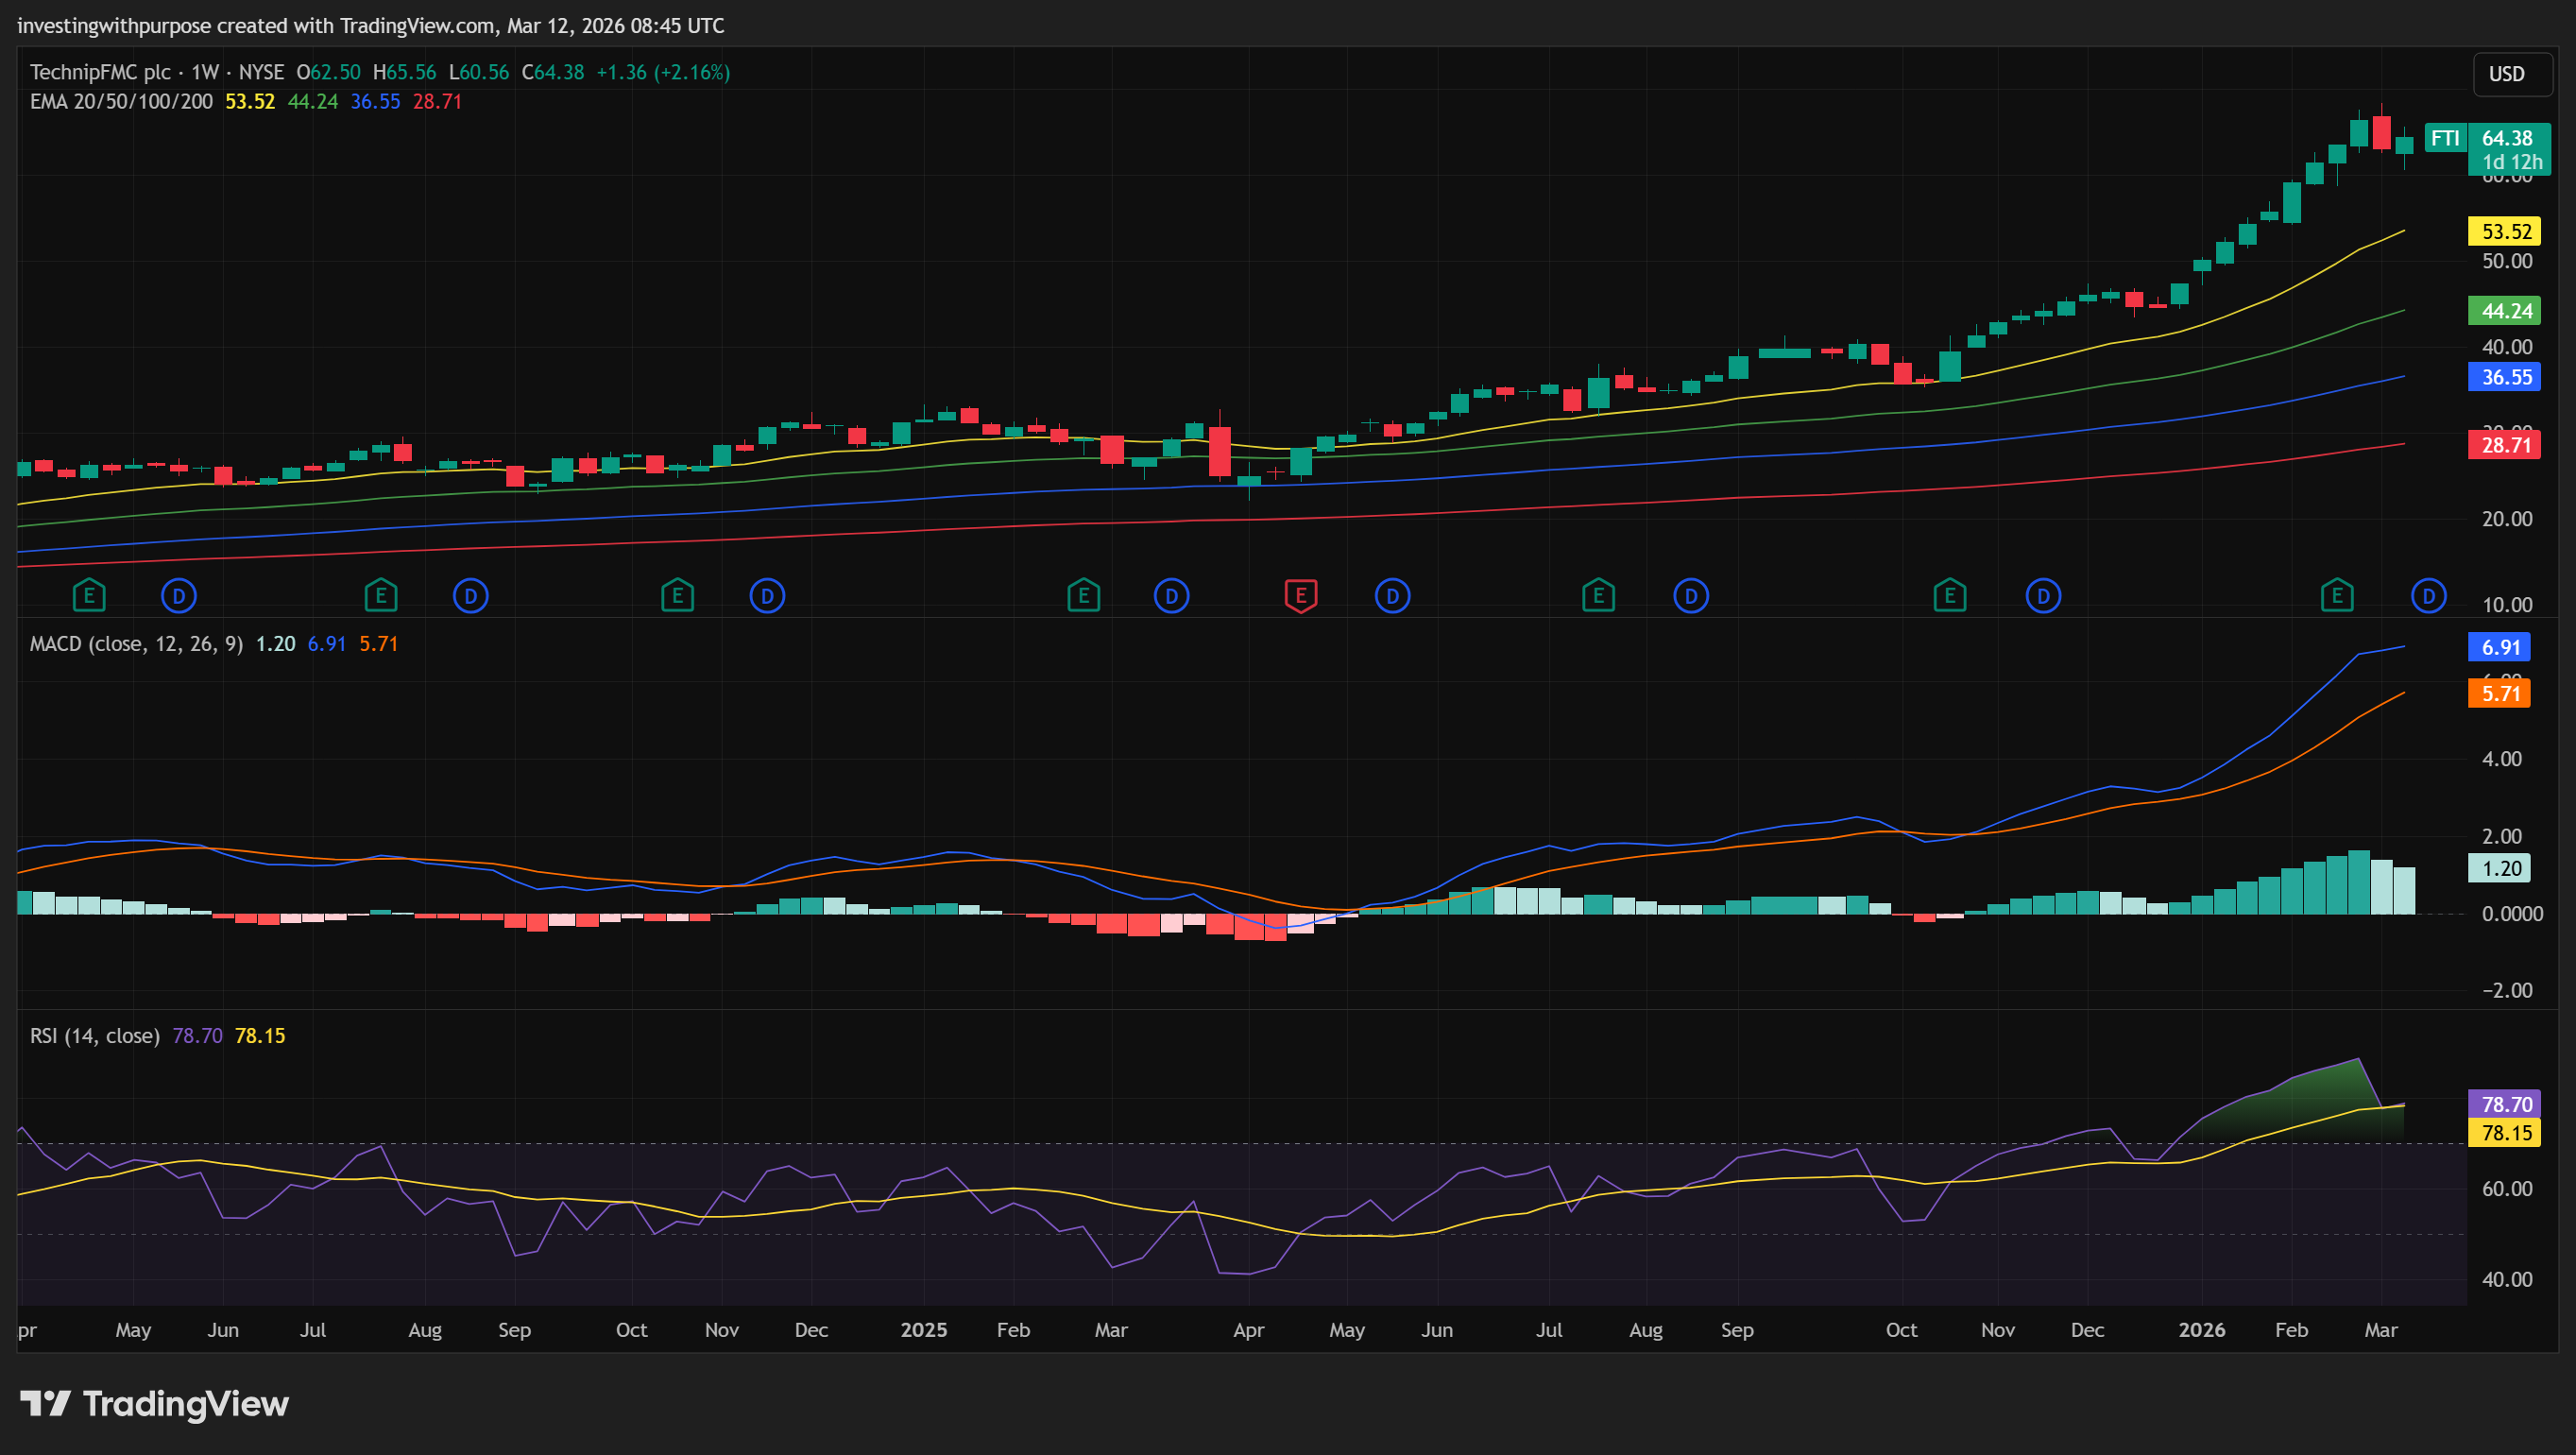
Technical takeaway: The trend is still intact on the higher timeframes. The near-term structure is in a consolidation/corrective phase after a large run. Holding above $63.75–$64.00 keeps the bull case alive for a push toward $66+. Breaking below $63 opens the door to the deeper $60–$58 zone, which would be a healthier reset and a better entry. The $53–$58 range represents a gift-level re-entry if the corrective wave plays out fully.
Trade Plan
The original trade has paid out cleanly. The question now is how to manage an existing position and how to think about fresh exposure at current levels.
For Existing Holders
If you entered in the $44–$45 zone from the December article, you are carrying a 40%+ gain. The structure no longer supports holding full size without a plan. The first daily MACD negative cross of the entire move is a signal to take the trade seriously and protect gains.
Trim zone: $65.50–$68.50. Reduce position size into any push back toward the February high.
Hold the remainder with a trailing stop at $63 (just below 20-day EMA). This is the level that has defined the entire uptrend. Every prior touch was bought. A daily close below it, confirmed with MACD still negative and RSI close line breaking 50, is the signal to cut the remainder and wait.
Reload zone if stopped out: $58–$60 and $52–$55. Both levels keep the fundamental thesis entirely intact and offer a much cleaner risk/reward for re-entry.
Invalidation of the longer-term bull case: A weekly close below $53.52 (20-week EMA) would require a full reassessment of the trend structure.
For New Entries
At ~$64, you are buying right at the 20-day EMA with daily MACD negative for the first time in the rally and RSI diverging. That is not an ideal entry. The risk/reward only improves meaningfully at lower levels or on a confirmed breakout. Two setups are worth waiting for:
Setup A: Continuation (breakout)
The 20-day EMA holds, MACD recovers back above zero, RSI close line stabilizes above 55, and price reclaims $65.50 cleanly.
Entry zone: $65.50–$66.00 on a confirmed daily close, with MACD histogram turning green and RSI close line back above the signal line
Targets:
T1: $68.50 (retest of February high)
T2: $72–$75 (next measured extension above the February peak)
Stop / Invalidation: Daily close back below $63.28 after entry
Setup B: Deeper Correction (preferred for fresh capital)
The 20-day EMA at $63.28 fails on a daily close, MACD stays negative, and RSI close line breaks below 50. Price pulls back into the 50-day EMA zone. This is the higher-conviction entry: you get a better price, a reset structure, and a cleaner stop.
Entry zone: $58–$60 (50-day EMA, scale in across this range) with a secondary add at $52–$55 if the move extends downwards
Targets:
T1: $63.28–$65.50 (reclaim of 20-day EMA and prior resistance)
T2: $68.50 (retest of February high)
T3: $72–$75 (full cycle extension)
Stop / Invalidation: Daily close below $51. Below that level, the 100-day EMA has failed and the intermediate trend structure has broken.
The levels to watch this week:
$65.50 on the upside. A clean daily close here with MACD turning green triggers Setup A.
$63.28 on the downside. A confirmed close below the 20-day EMA with momentum deteriorating opens the path to Setup B.
Right now, the daily chart is sitting exactly on the decision line.
Investment Summary
TechnipFMC remains one of the cleaner fundamental stories in the offshore energy services space. The Q4 2025 results were excellent. The 2026 guidance implies further margin expansion. The backlog provides visibility through 2028. The opportunity pipeline is at record levels. The balance sheet is in net cash. Capital returns are real and growing.
The original thesis from December 2025 was validated in full, and the stock rewarded patient, level-driven execution with a 40%+ gain in under three months.
From here, the trade is more nuanced. A continuation trade makes sense only on a clean breakout above $65. A reset trade into the $50s offers the best risk/reward for new capital. In either case, the fundamental backdrop supports being involved. The question is simply price and entry discipline.
The business is executing. The cycle has further to run. The structure just needs a bit more time to set up the next clean entry.
The content published on Investing With Purpose is for informational and educational purposes only. It does not constitute financial advice, investment recommendations, or an offer to buy or sell any security. All analysis reflects the author’s independent research and opinions at the time of writing and may change without notice. Investing involves risk, including the possible loss of principal. Past performance is not indicative of future results.