
TeraWulf (WULF): The Small-Cap Power Plant Turning Into an AI Landlord
A plain-English deep dive for investors who don’t live inside data centers

From Bitcoin rigs to renting megawatts to AI; this is the pivot.
Most small-cap “AI infrastructure” pitches are hand-wavy. WULF 0.00%↑ is more concrete: it already owns power-rich industrial sites in upstate New York, originally built to run bitcoin miners. Those sites have something AI needs desperately: lots of cheap, clean electricity and heavy-duty cooling to keep Nvidia-class chips from melting.
So the company is doing something very practical: keep mining for cash today, but convert those same campuses into high-density data centers and rent them to customers that bring their own GPUs. WULF provides the powered, liquid-cooled rooms; the customer pays monthly rent for the electricity and space. That’s the core pivot: from mining coins to leasing megawatts.
Electricity + cold water + reliable grid = AI real estate.
Key Takeaways
What: WULF is pivoting from mining to AI real estate; renting megawatts in liquid-cooled rooms to signed tenants.
Why now: 2026 ramp is the story; KPI = billing MW/quarter (on-time CODs → rent → EBITDA/CFO inflect).
Snapshot: Revenue growing; EBITDA/FCF still negative; liquidity tight → execution + cash build needed.
Dilution: Google warrants + 2031 converts exist; cash-settle + capped-call can limit practical dilution if cash improves.
Technical: Uptrend > 20-EMA (~$9); supports $10.5–10.9 / $9.9–9.4 / $9.0 / $8.6; targets $12.35–13.35, stretch $15.6; fail < $8.60.
Trade (swing): Buy $10.5–9.9 (scale ~$9); add > $11.1; trim $12.35–13.35, keep runner $15.6; risk ≈ $0.7–1.4 (ATR), invalidation < $8.60.
Verdict: Turn on rooms → turn on rent; hit schedule and WULF graduates to a scarce AI landlord.

What WULF actually sells
Product: “Powered shells” built for liquid-cooled AI clusters (big rooms, lots of electricity, specialized cooling).
Customer provides: The GPUs/servers.
WULF provides: Power, cooling, security, fiber, and operations.
How WULF gets paid: Monthly rent per megawatt, usually on multi-year contracts with annual escalators (rent goes up a bit each year).
Why customers sign: They get fast access to power and a site designed for modern AI heat loads; which is hard to find.
The pipeline
Customer A (Core42):
What: A handful of liquid-cooled rooms at WULF’s main campus (roughly ~60 MW of “IT power”, that’s the part that feeds chips).
When: Started billing in 2025 (first rooms online), more rooms start in Q4’25.
How WULF gets paid: Monthly rent per kW for ~10 years, with small annual increases.
So what: It’s already live and billing, this is the proof that WULF can deliver to serious AI buyers.
Customer B (Fluidstack, with a big-tech credit backstop):
What: A much larger footprint, staged through 2026 (hundreds of MW).
When: First chunk 1H’26, big wave by YE’26.
How WULF gets paid: Same idea; multi-year rent, power mostly pass-through (so WULF isn’t gambling on electricity prices).
Why it’s de-risked: There’s a credit backstop from a top-tier tech company covering a large part of the lease obligations; good for lenders, good for WULF.
Second campus (Cayuga):
What: A new site with a very long lease and utilities already there.
When: First ~138 MW targeted 2H’26, with room up to ~400 MW over time.
Role: Gives WULF growth optionality beyond the main campus.
Bottom line: Contracts exist, schedules exist. Rent starts when buildings turn on; 2026 is the big “ramp and bill” year.
Fundamental Analysis
Revenue (TTM) = $144.1m, up +19.8% YoY
Top-line is still growing, even before most AI rent arrives.
Latest quarter revenue = $47.6m (+38.4% QoQ, +33.7% YoY)
A strong quarter; re-acceleration after a soft patch late ’24/early ’25.
Gross margin (Q) = 53.6% | Gross margin (TTM) = 43.9%
Unit economics are improving; high-50s gross margin in a quarter is healthy for a power-based operator.
EBITDA (Q) = +$8.5m | EBITDA (TTM) = –$49.2m
The latest quarter is positive, but the trailing year still reflects the tough prints in late ’24 and 1Q’25. We want two+ positive quarters in a row.
Operating income (Q) = –$15.6m | Net margin (Q) = –38.7%
Not yet at operating breakeven. Costs beyond power (overhead, depreciation) still outweigh revenue.
Cash from operations (TTM) = –$61.9m | Capex (TTM) = –$387.9m | FCF (TTM) = -$449.8m
This is a build phase. Expect big negative FCF until the new rooms rent.
Cash & ST investments = $90.0m | Total debt = $500.9m | Current ratio = 0.65×
Tight liquidity and meaningful leverage; execution and financing cadence matter.
PP&E = $704.6m (on $869.4m total assets) | Equity = $174.3m
Asset-heavy balance sheet (as expected for power/datacenters). Scale helps margins once occupied.
Diluted shares = 386.9m (+13.6% YoY)
Some dilution funded the build; future dilution risk falls if rent ramps on time.
Valuation
Don’t try to value this on last year’s profits (there were none). Instead, ask: “What happens when the signed megawatts are turned on and paying rent?”
Assume by late 2026, ~420 MW of customer IT power is live (core + big customer’s phases; round numbers).
Rent math (industry-typical for this setup): about $1.5m per MW per year (this is a blended, round, easy-to-remember figure).
Revenue at steady run-rate: 420 × $1.5m ≈ $630m per year from the AI “landlord” business (power pass-through excluded).
Site-level margin: WULF has guided to very high site margins because rent is recurring and power is pass-through. Use a simple ~80–85% site margin.
$630m × 82.5% ≈ $520m site NOI (ballpark).
What’s left: Subtract corporate costs, interest, and stock comp to get to EBITDA/FCF. Even after that haircut, the path to positive EBITDA and cash becomes obvious if the schedule is met.
Sensitivity:
If half the capacity arrives six months late, that’s roughly ~$160m of annualized rent that shifts into the following year.
If site margin is 10 points lower, that’s ~$63m less NOI.
Put differently: timelines and utilization are everything.
This is a “turn it on, get paid” story.
Dilution & Capital Structure
Why this matters: WULF is funding a multi-hundred-MW build; parts of the stack are equity-sensitive.
What exists: ~73.5M Google-linked warrants (token strike); $1.0B 1.0% converts due 2031 (initial convert ~$12.43, ~80.5M shares if fully share-settled).
Why it exists: Those instruments helped de-risk financing (e.g., lease backstops) and unlock cheaper capital for the build.
Mitigants: Company can settle convert principal in cash; a capped-call offsets conversion dilution between ~$12.43 and ~$18.76.
Reality check: “Max headline” dilution (warrants + all-stock convert) is sizable, but practical dilution can be materially lower if execution builds cash and management uses cash settlement + capped-call.
What to watch: Megawatts delivered & billing, cash build in 2026, quarterly share-count table, stock vs $12.43 / $18.76 (indicates where convert dilution sits).
Dilution is real but sized; the antidote is execution; turn backlog into rent, grow cash, and keep share issuance in check.
Technical Analysis
Multi-timeframe setup
Weekly (the tide)
Trend: Price ≈ $10.9 and above all EMAs (20/50/100/200 ≈ 6.46/5.26/4.70/5.15).
Why it matters: When all moving averages stack upward and price rides above them, the path of least resistance is up.Momentum: RSI ≈ 78 (can stay overbought in strong trends). MACD rising with expanding histogram → momentum expansion.
Strength: ADX ≈ low-30s and rising → trend getting stronger, not weaker.
Weekly Fibs: First confluence $12.3–13.8 (1.27–1.62). Secondary $15.6 (2.618).
Translation: Expect profit-taking somewhere in $12–14 first; if absorbed, $15–16 opens up.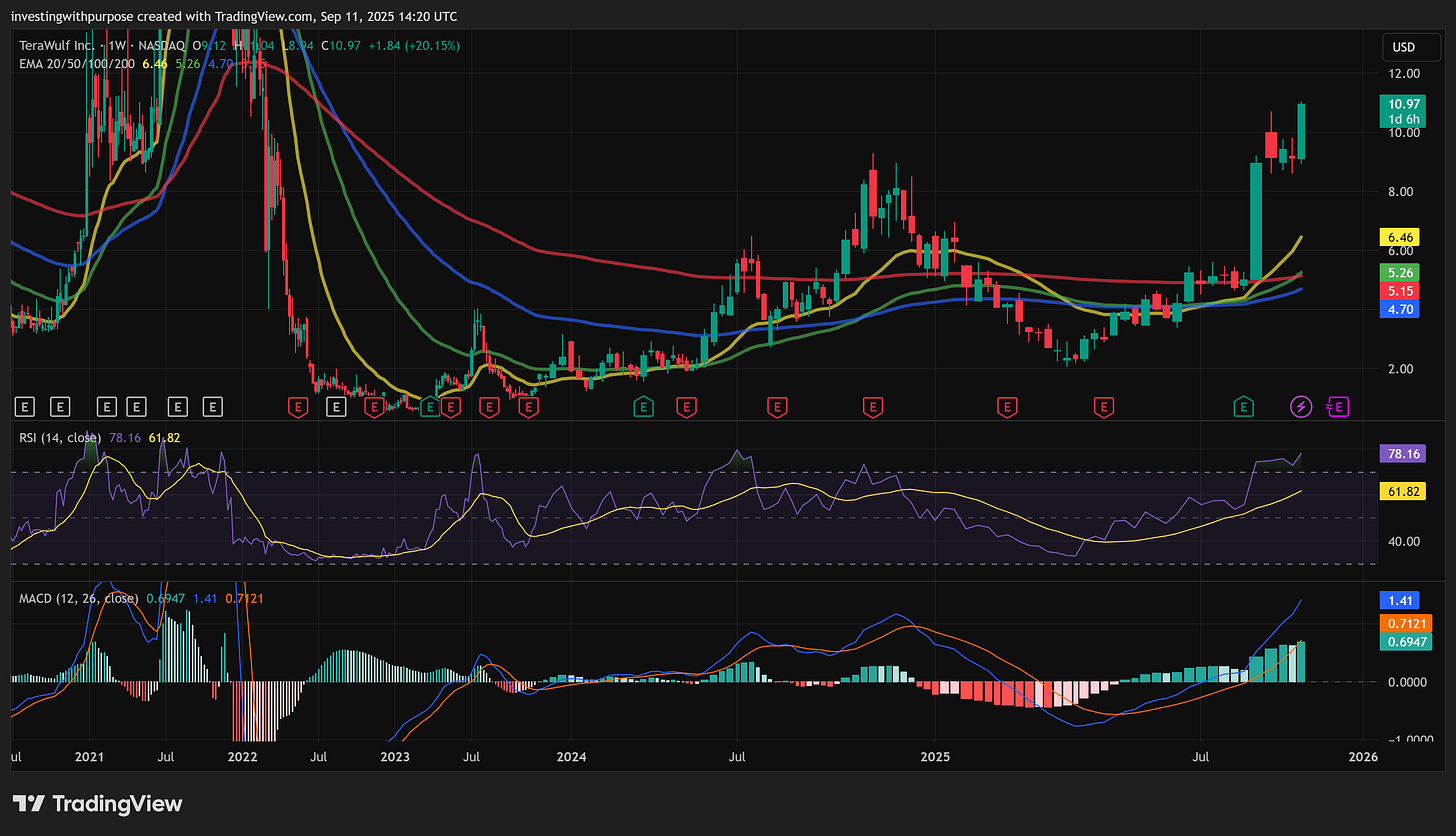
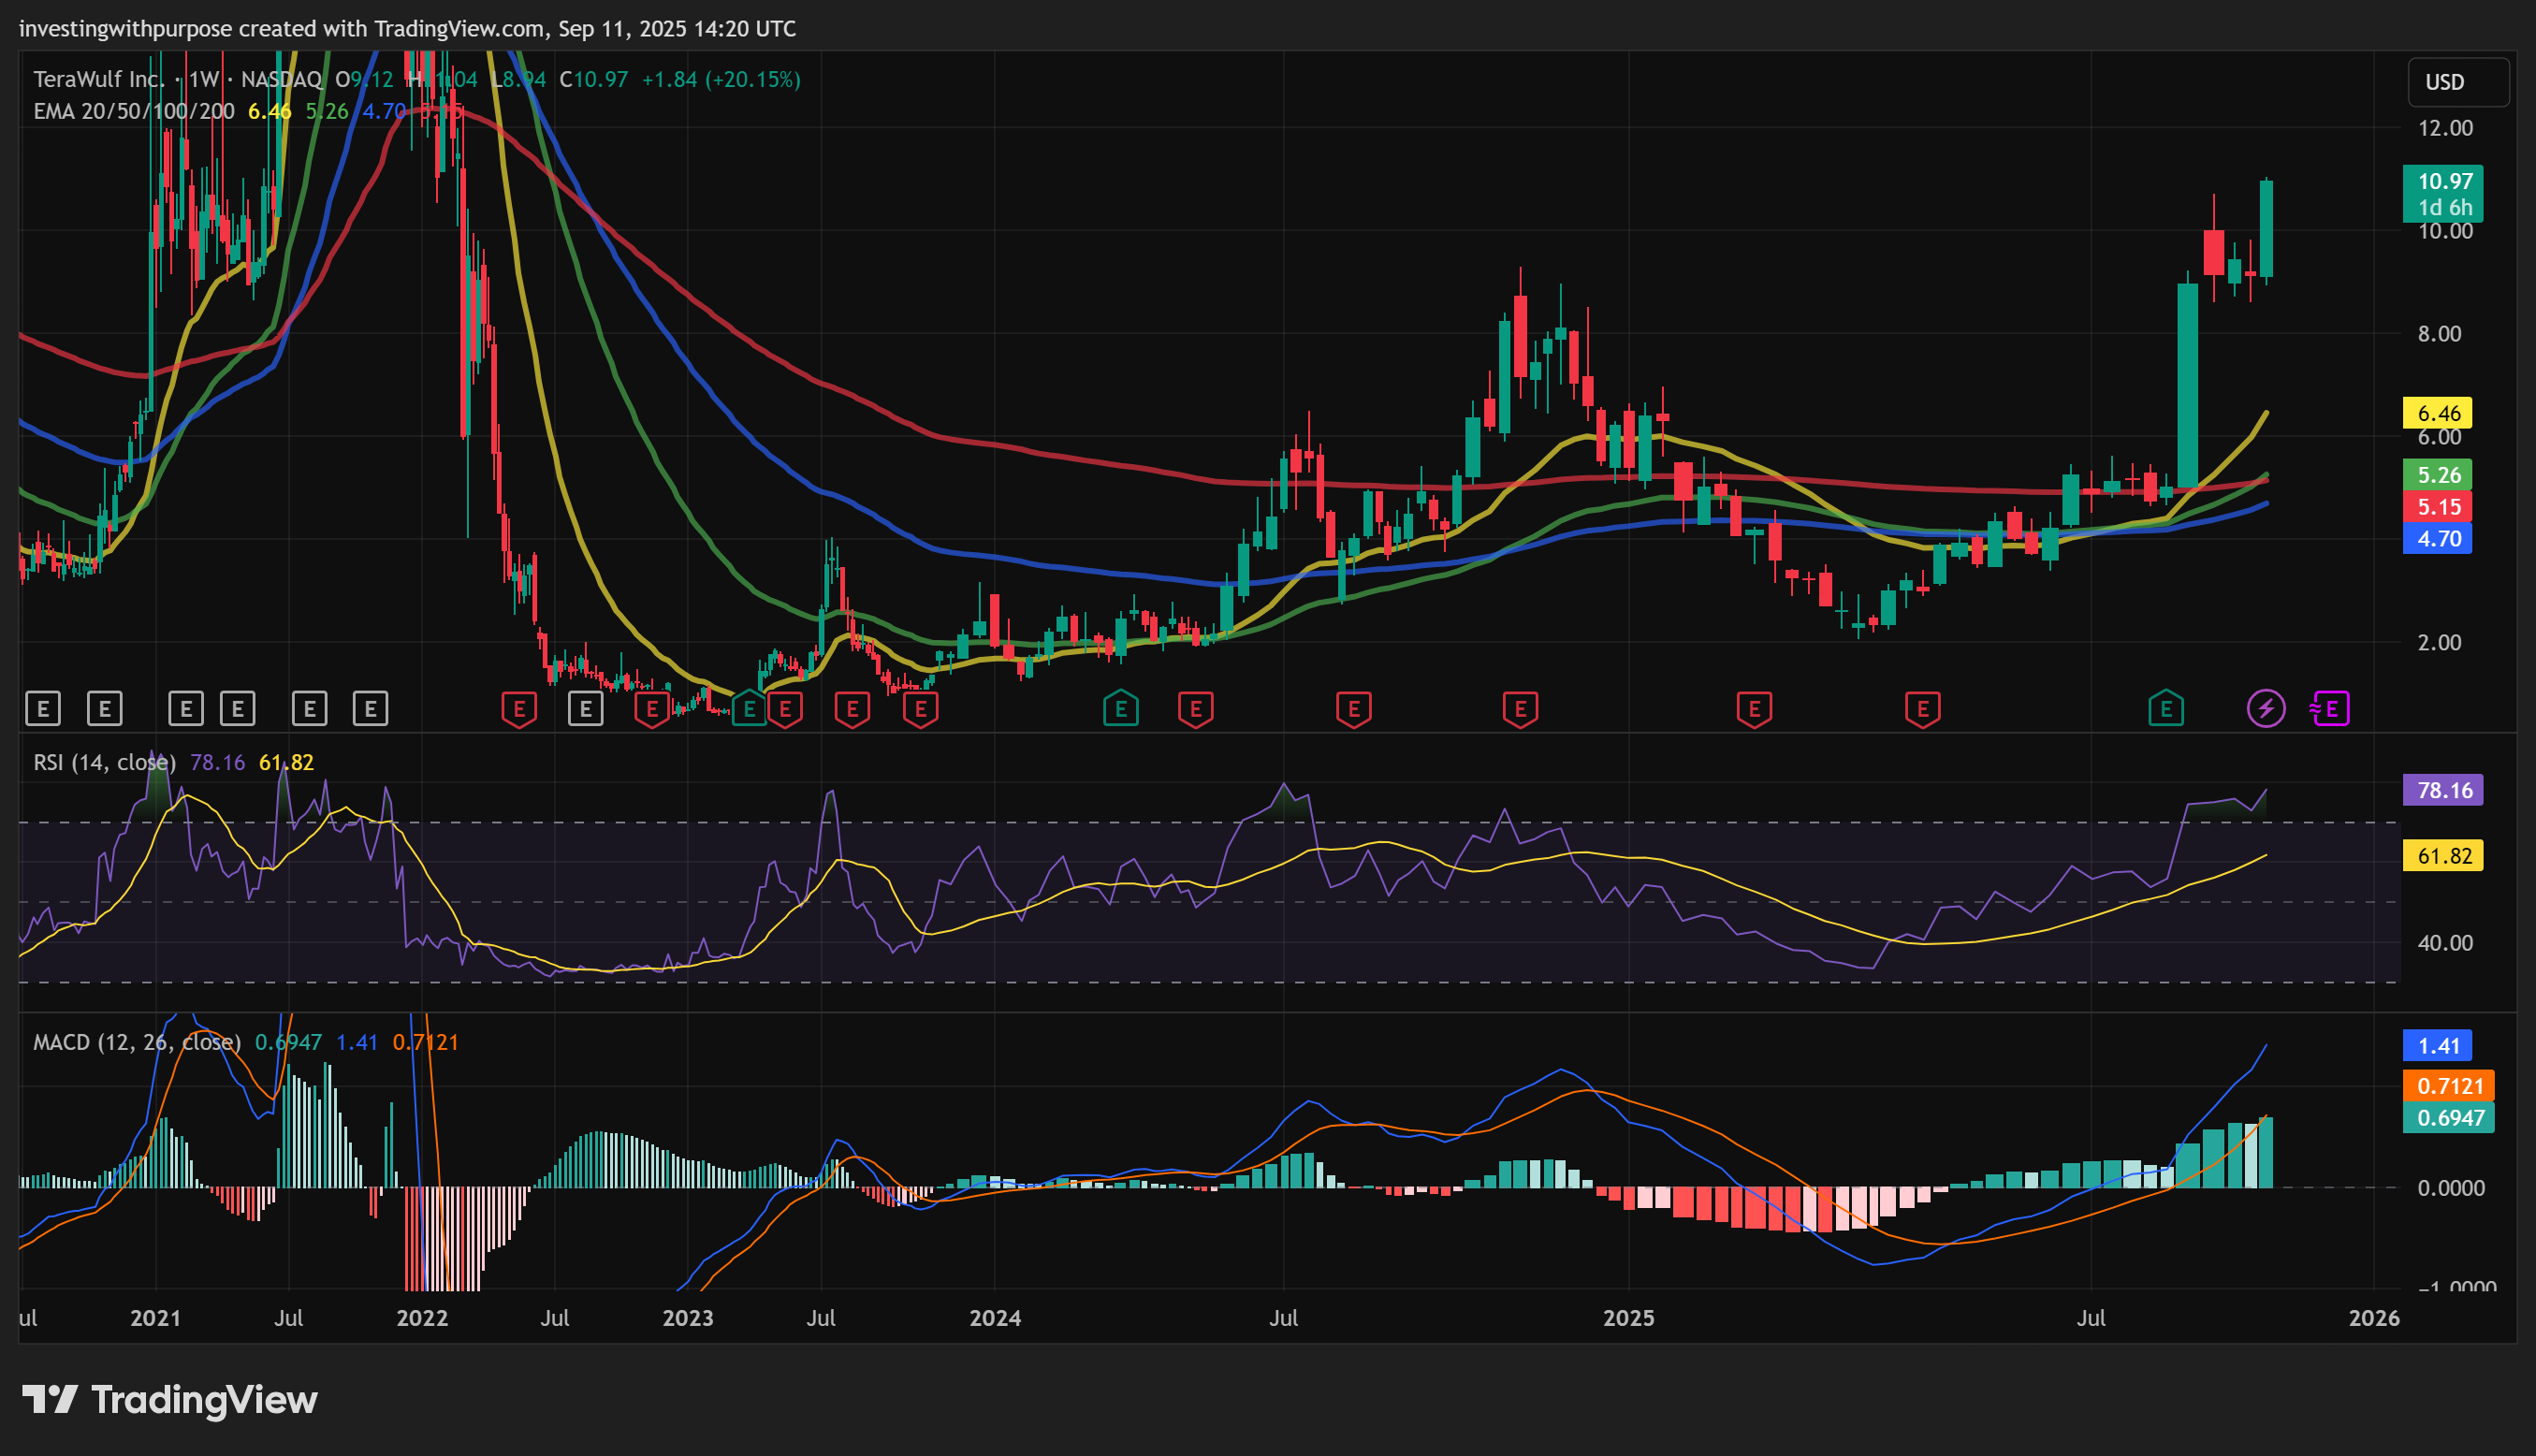
Daily (the wave you trade)
EMAs: 20/50/100/200 ≈ 9.00/7.33/6.09/5.27; price well above → buyers in control.
Bollinger Bands: Basis ≈ $9.36, upper ≈ $10.50; price riding the upper band after a squeeze.
Why it matters: Riding the band is trend continuation, not “overbought” in the classic mean-reversion sense.RSI ≈ 71–72 | ADX ≈ 50 | MACD positive
Read: Strong trend; pullbacks can be short and sharp.OBV uptrend: Money flow confirms price; always a good sign.
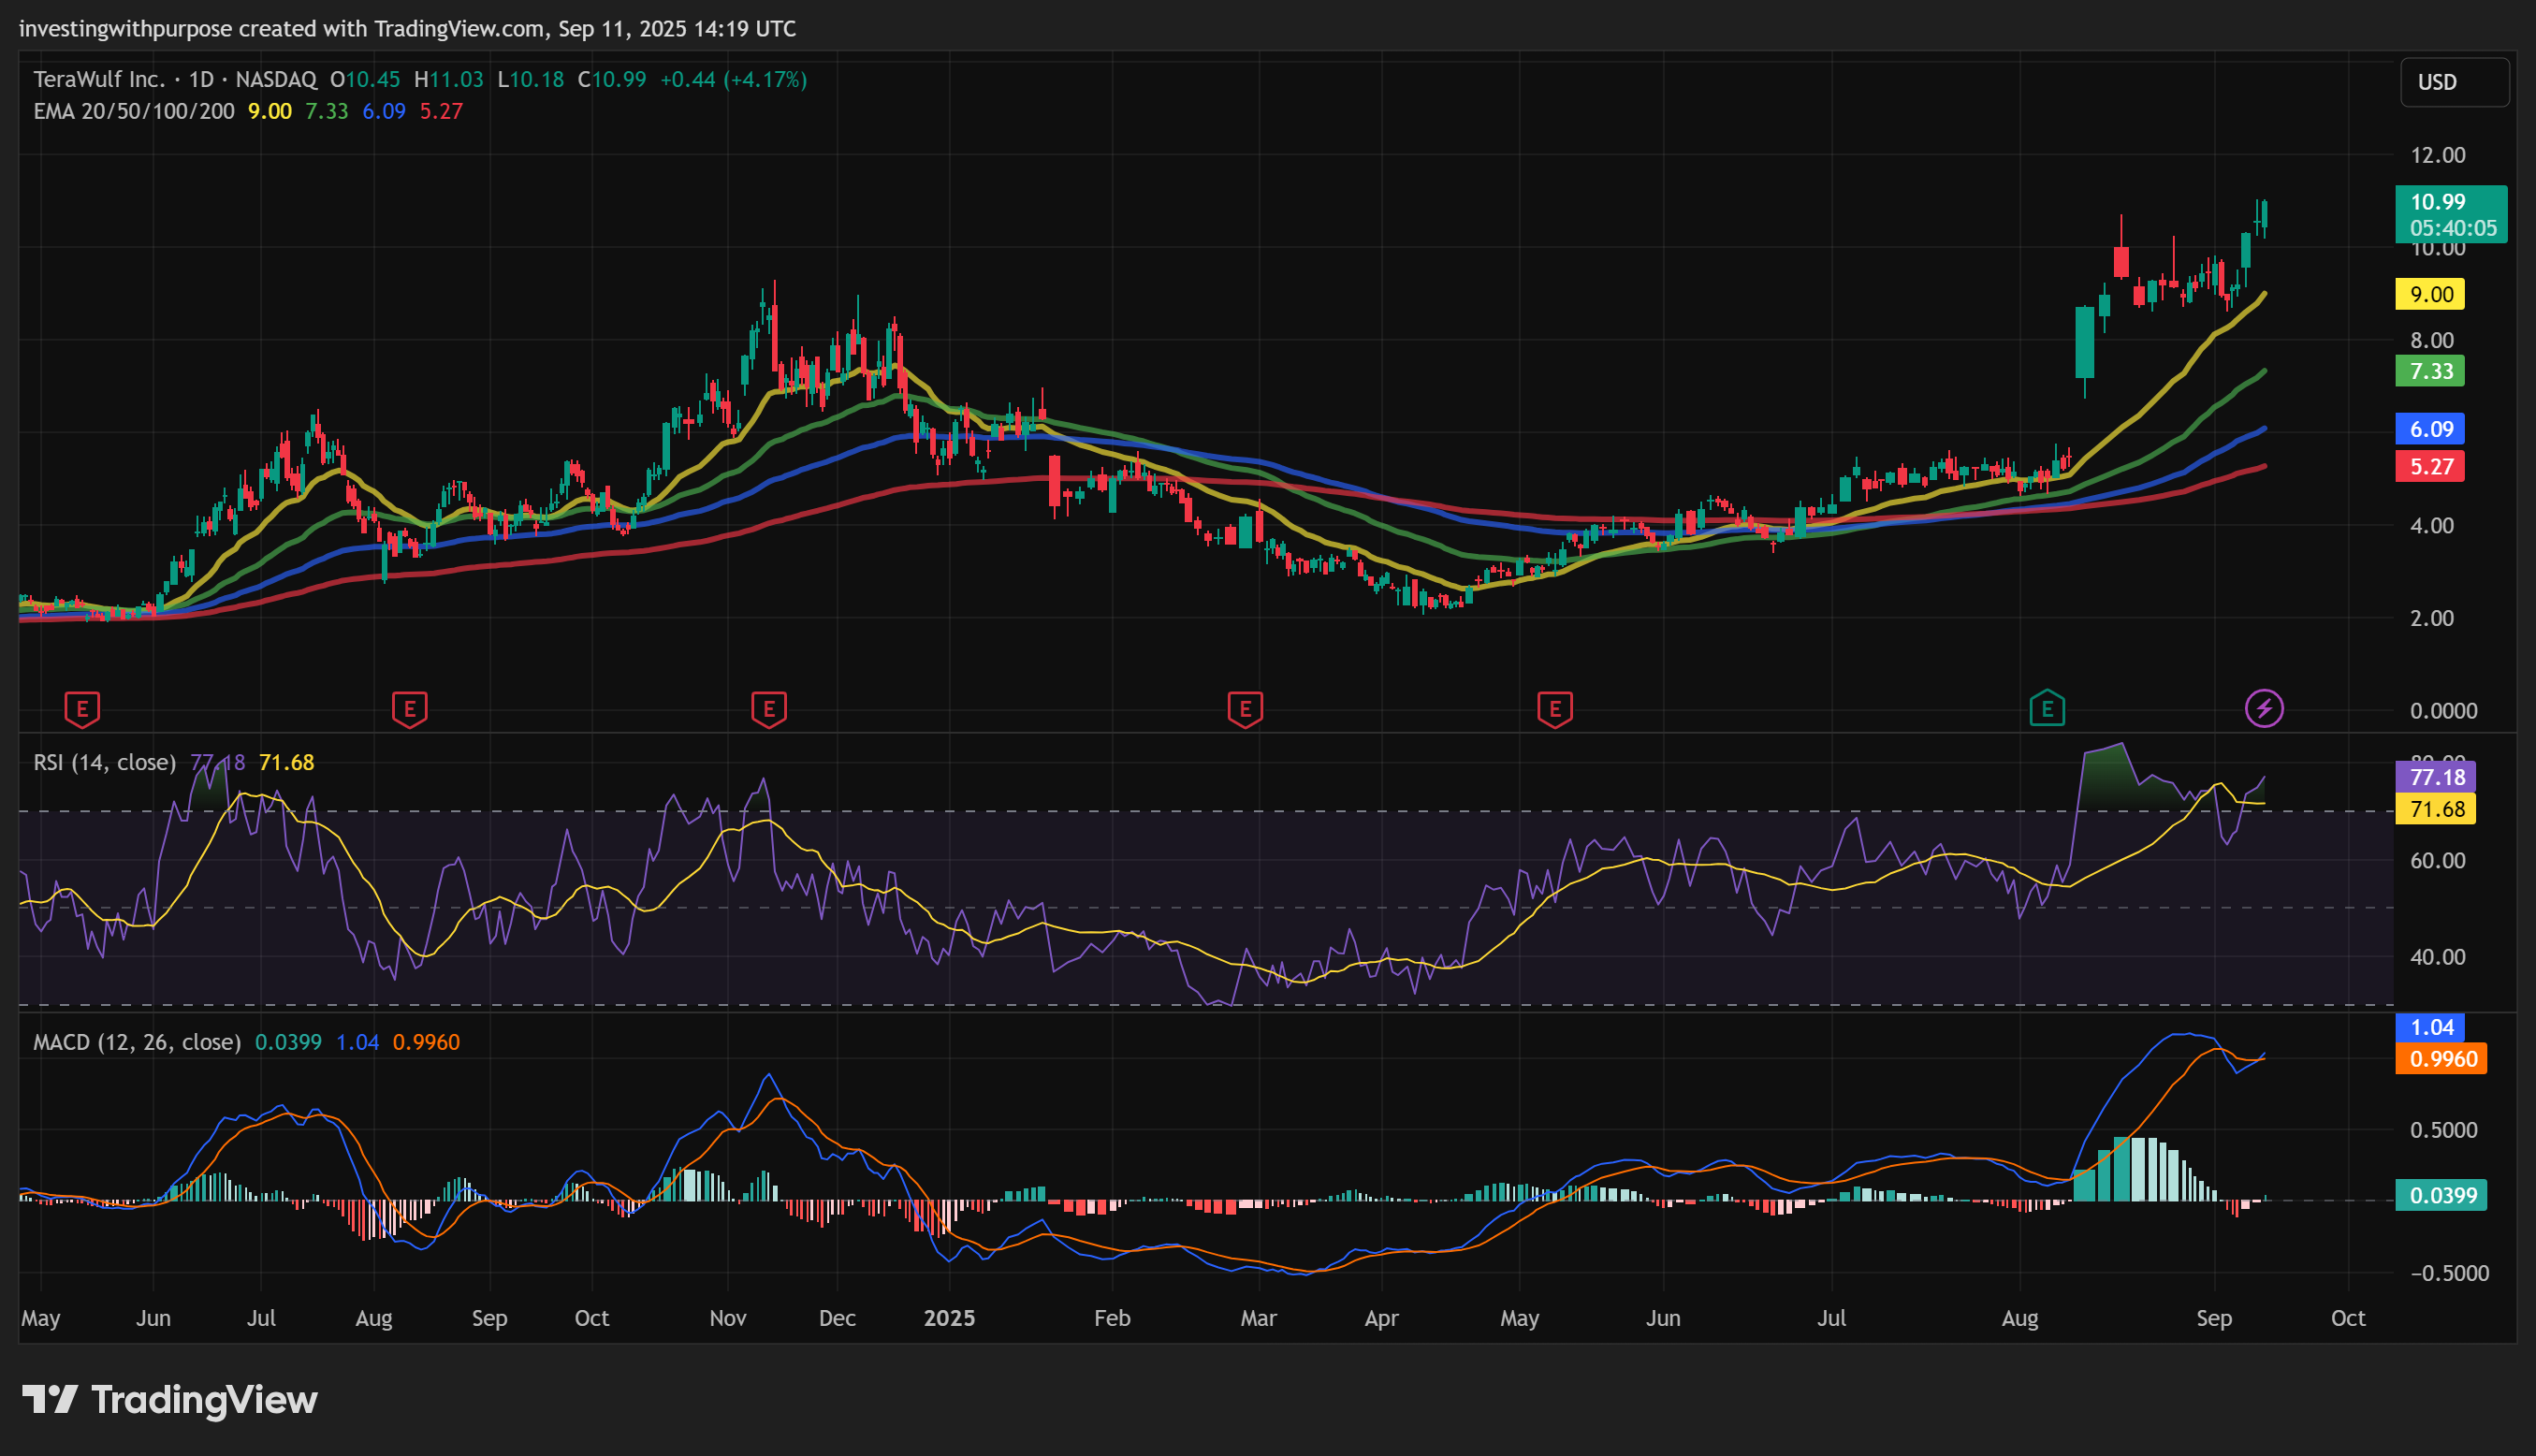
Support ladder (use this to plan entries & stops):
$10.50–10.90 = new-high shelf / upper-band area (first shallow-dip zone).
$9.90–9.40 = minor shelf; near BB basis ($9.36).
$9.00 = 20-EMA daily (primary trend support).
$8.60 = gap/anchor (must-hold for this leg).
$7.33 / $6.09 / $5.27 = 50/100/200 EMA (deeper supports).
Targets (confluence, not single ticks):
$12.35 → $13.35 (daily 0.618–0.786 zone + weekly 1.27 area)
$15.6 (weekly 2.618)
If momentum over-delivers later: $16.3 / $18.4 (daily 1.27/1.618)
Invalidation (define it, don’t debate it):
Daily close < $8.60 → regime change. Expect tests of $7.3 (50-EMA) or $6.1 (100-EMA).
Pattern narrative (why price moves in bursts)
The August gap likely started a new impulse leg (call it “wave-3” if you like Elliott). That kind of leg usually has shallow pullbacks and band rides.
A high-and-tight flag around $10–11 would be healthy. If it breaks up with rising OBV, the $12–14 window is the natural next step.
Momentum fades when ADX rolls over and RSI can’t get back above 60 on bounces. You’ll see that before the bigger breakdown.
Trade plan (expanded)
A) Buy the first dip (preferred R:R)
Entry zone: $10.50–9.90 (scale to $9.00 if flushed).
Stop/Fail: Daily close < $8.99 not reclaimed in 2–3 sessions; hard stop < $8.60.
Targets: $12.35 → $13.35; leave a runner for $15.6.
Sizing clue: ATR ≈ $0.71 → 1R ≈ $0.70–0.75. Set size so 1–2R loss is uncomfortable but tolerable.
B) Momentum add (continuation)
Trigger: Strong break > $11.10–11.20 with rising OBV.
Risk: Stop $1.05–$1.40 below (1.5–2× ATR) or use a 20-EMA close as dynamic stop.
Above the 20-EMA, give the uptrend the benefit of the doubt. Below $8.60, stop arguing.
Risks
Construction timing: If switchgear, cooling, or grid windows slip, rent arrives later and cash burn runs longer.
Financing mix: Converts/warrants are equity-sensitive; each delay increases dilution risk.
Customer ramp: Even with strong counterparties, acceptance testing and GPU deliveries can push dates.
Power & BTC: Less relevant for AI rent (pass-through), but the mining side still swings with power and bitcoin.
What to watch next (practical checklist)
Every quarter: “How many megawatts started billing?”
Margins: Sustained positive EBITDA and then positive CFO.
Balance sheet: Current ratio back >1×; net debt stable/down.
Tape tells: OBV higher highs, ADX re-expansion on daily dips.
Bottom line
WULF is a power-and-real-estate play wearing a miner’s ticker. The thesis: convert cheap, clean megawatts into long-dated AI rent and let scale flip the financials.
Must-haves (no excuses):
Delivered, billing MW up each quarter through ’26.
P&L crossover: sustained positive EBITDA, then positive CFO.
Balance sheet relief: current ratio >1×, net debt stabilizes.
If they execute: The story graduates to recurring-rent infrastructure valued on leased MW × rent/MW × term, a path to a re-rate toward data-center/HPC peers.
If they slip: Rent shifts right, FCF stays negative, dilution risk rises. You’ll see it in MW delivered, CFO, and the tape (lose $8.60 = regime change).
How to own it: Treat it like an execution bond, size for build noise, add on on-time CODs & CFO inflection. Respect the tape: above 20-EMA (~$9) ride the trend, trim $12.35–13.35, keep a runner to $15.6.
Plain-English verdict: Turn on the rooms, turn on the rent, and WULF shifts from “small miner” to scarce AI landlord.
This analysis is for educational purposes only and does not constitute investment advice.