


Record revenue and record deliveries arrived with a 1.4% operating margin and negative free cash flow, and the stock’s overnight slide dropped it straight onto the support zone we mapped 2 days ago.

The referendum reported. The verdict is split, and the price is sitting on the line that decides it.
In June we called July 22 the first real referendum on Tesla’s robot bet. On Monday we published the map: $369.57 going in, options pricing a 7.6% swing, support at 360 to 365, invalidation at 334. Wednesday night the report landed, and it split down the middle. Revenue of $28.24B beat estimates in the $25B to $26B range, deliveries set a second-quarter record, and adjusted earnings of $0.33 fell $0.19 short of the $0.52 consensus. The stock dropped about 4% in extended trading from its $374.01 close, an indication near $360, the zone Monday’s framework said would decide whether the de-risk was a gift or a warning. Prices and levels below are from the July 22 close.
Key Takeaways
Revenue rose 25.5% to a record $28.24B, but adjusted EPS of $0.33 came in $0.19 below consensus and operating margin compressed to 1.4% from 4.1%.
Deliveries hit a record 480,126, up 25%, the first year-over-year growth in 2 years. Automotive gross margin excluding credits fell to 16.3%, under Monday’s 18% bar.
Capex jumped 142% to $5.79B and free cash flow swung to negative $1.09B. The robot pivot’s bill is now visible, against $43.5B of cash.
The robot side grew fastest: robotaxi in 7 metro areas, 1.48M FSD subscriptions (up 56%), Optimus lines going into Fremont. Still no robot revenue line.
The overnight reaction parked the stock on the 360 to 365 support cluster. Holding it keeps the accumulation case alive; a daily close below 334 breaks the year-long structure.
The quarter itself first.
More Cars, More Robots, Less Profit
Start with what went right, because plenty did. Tesla delivered 480,126 vehicles, up 25%, its best second quarter ever and its first year-over-year delivery growth in 2 years. Production was 451,758, so the company sold roughly 28,000 more cars than it built and drew down inventory, a healthy demand signal after the loss of the federal EV credit. Automotive revenue grew 23% to $20.52B. Energy grew 13% to $3.14B on 13.5 GWh of storage deployed, up 41%. Services and other, the quiet compounder, grew 50% to $4.58B at a record 14.1% gross margin.
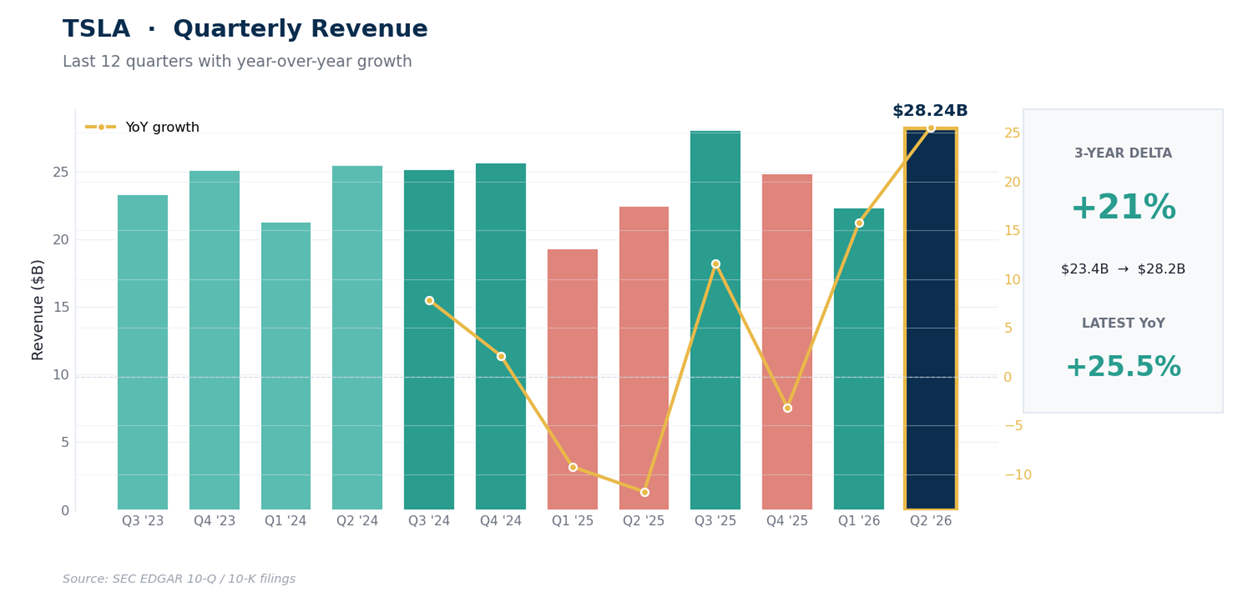
The 12-quarter arc makes the moment legible. Revenue fell through most of 2025, bottomed near $19.3B in the March 2025 quarter, and has now recovered to a record $28.24B. The 4 reported quarters through June sum to $103.6B, the first time the trailing year has cleared $100B. Growth came back this quarter; whether it stays is the next 4 quarters’ question.
The robot ledger moved forward too. Robotaxi now touches 7 metro areas, 6 of them ramping unsupervised, with a supervised safety-driver model in San Francisco. FSD subscriptions reached 1.48M, up 56%, a real recurring-revenue base forming under the autonomy story. Cybercab public-road engineering tests began during the quarter, first-generation Optimus lines are going into Fremont, and the Semi and Megapack 3 are slated for production this year. The caveats: the NHTSA probe into FSD remains active, and the once-unconditional robotaxi tone on the call had grown more careful.
Now the numbers the market sold.
The Margin, the Cash, and What the Price Still Assumes
The profit story is where the quarter earns its after-hours haircut. Operating income fell 57% to $398M, a 1.4% operating margin against 4.1% a year ago, on record revenue. The mechanics: regulatory credits, nearly pure profit, collapsed 67% to $146M as the policy regime changed. Automotive gross margin excluding credits fell from 19.2% to 16.3%; management didn’t hang that on any single cause, but the pattern suggests the return to volume growth came with a real profitability trade-off.
Energy gross margin nearly halved to 20.4%, hit by a warranty true-up and the lapse of a one-time tariff benefit. Record services margins offset some of it, and adjusted EBITDA of $3.27B shows the operations stayed profitable before depreciation, interest, and taxes, even as GAAP net income of $1.11B slipped 5% and the adjusted $0.33 fell 18% from a year ago.
Then there’s the cash statement, which is really the strategy statement. Operating cash flow was excellent: $4.70B, up 85%, helped by the inventory drawdown. Capex was $5.79B, up 142%, the spend behind Optimus, Cybercab, AI compute, and new factory lines. Net result: free cash flow of negative $1.09B, versus barely positive a year ago. The balance sheet can carry this, $43.5B of cash says so. But a company that generated $7B of trailing free cash flow through March just went cash-negative, and the market now has a number for what the pivot costs.
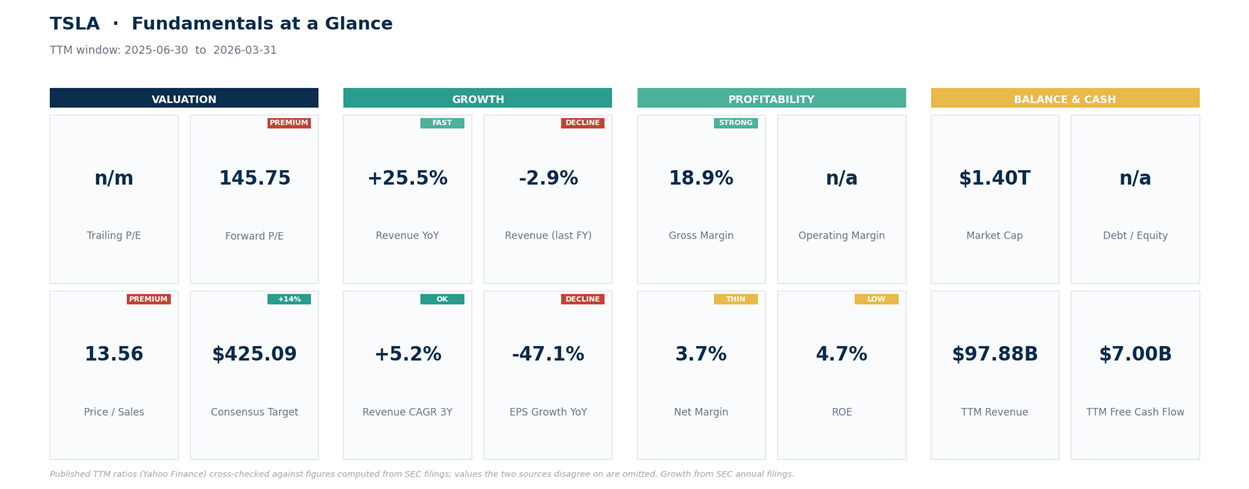
The valuation arithmetic barely moved, which is the problem. At $1.40T of market cap on roughly $3.8B of trailing net income, the stock trades near 370x reported earnings, with a forward multiple near 146x before the print. Put a generous 40x on the earnings of the reporting businesses and you get about $150B; round up to $200B for the energy franchise’s growth.
The other $1.2T is a claim on autonomy and Optimus, businesses that again produced subscriber counts and city maps but no disclosed revenue line. That’s rough arithmetic, not a formal sum-of-the-parts; its job is to show the scale of expectation built into the price. The Street is split: 22 buys, 19 holds, 6 sells; price targets, a separate 38-analyst dataset, run $125 to $600 with a $425 mean and $460.55 median. The fundamental conclusion is the one the reaction priced: the growth is real, the margin isn’t there yet, and the burden of proof on the $1.2T just got a quarter heavier. The next checkpoint is Wednesday, October 21.
From the income statement to the price.
The Map After the Gap
Into the print, the structure was already heavy. The July 22 close of $374.01 sat below every daily moving average that matters: the 20-day at 392, the 50-day at 398, the 200-day at 396, a cluster so tight it forms a single ceiling near 395 to 398. Daily RSI, a 0-to-100 momentum gauge, read 41.7, and the MACD line at -6.97 sat below its signal with the gap widening, meaning downside momentum was still building into the report. -DI 26.2 versus +DI 16.8 means sellers held control of the short-term trend, though an ADX near 14 (a trend-strength reading, low is weak) says this is a drifting range, not a rout. The fast stochastic near 12 was already washed out before the report.
The support case is about confluence, and it’s unusually tight. The lower daily volatility band sits at 360.90. The weekly 38.2% retracement of the entire 2-year advance from 138.80 to 498.83 lands at 361.30. The weekly 100-period average sits at 358.82, and the April lows printed at 364. That’s 4 distinct measures (all drawn from the same price history, but from different angles) stacked between 359 and 365, where the after-hours indication points. Below it, the last shelf is the April swing floor at 337.24 with the weekly lower band near 344; a daily close under 334 ends the structure that has held all year. Overhead, the sequence is unchanged from Monday: 381.61, the 395-to-398 ceiling, 409, the 426-to-432 zone where July’s breakout died on heavy volume, then 453.40, the 460.55 analyst median, and the 52-week high at 498.83.
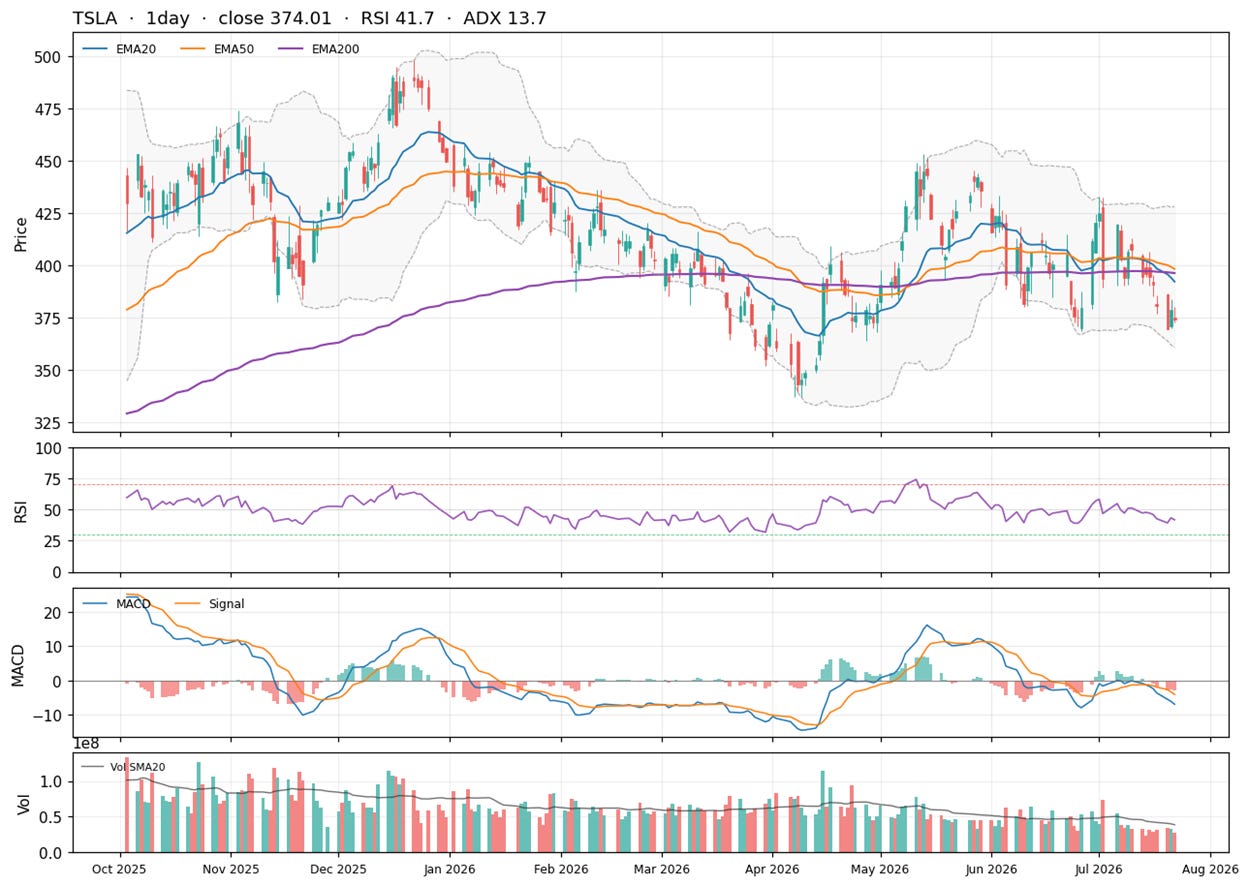
A split verdict, delivered to the zone where accumulation gets decided. Washed-out momentum and the stacked supports argue for a fight rather than a collapse; the margin print argues against catching it blind. The next few daily closes at 360 to 365 matter more than anything said on the call.
Our Trade Plan
One possible framework, not a promise, and not personal advice.
