


One owns the audience, one rents it. Meta grows 33% at $215B scale and trades at 18x forward after a capex de-rate; AppLovin grows 59% at a 77% GAAP operating margin and just hit a 3-month low. Same AI advertising engine, opposite tapes, and the durability question decides both.

Digital advertising is where AI already pays for itself. The argument is over who gets paid.
Most AI investment stories still run on faith. Advertising is the exception, because the feedback loop is measured in dollars: a better model targets better, converts better, and makes the advertiser more money per dollar spent, and an advertiser making more money spends more, at higher prices, with whoever produced the result. The auction clears the argument daily.
That’s why the 2 purest AI-advertising machines in public markets deserve to be studied together, and why they shouldn’t be confused for each other. Meta is a $1.64T empire that owns its audience: 4 apps, billions of users, roughly 98% of revenue from ads on its own surfaces.
AppLovin is a $143B engine that owns no audience at all: it sells targeting intelligence across other companies’ mobile apps, and after shedding its own games portfolio it’s effectively a pure advertising technology company.
Both just got repriced, in opposite directions, for different reasons. Prices are based on the July 17, 2026 close.
Key Takeaways
The shared engine: both convert model improvements into measured advertiser returns. Meta’s AI ad products are credited with a reported 6% conversion lift; AppLovin’s AXON engine drove revenue up 59% last quarter.
The scale gap: Meta earns $215B of trailing revenue at a 41% GAAP operating margin; AppLovin earns $6.2B at 77%. One is an economy, the other is an instrument.
The de-rates: META is down 9% over 12 months despite 33% growth, compressed by a $125B to $145B capex plan. APP is down 43% from its February record at $745.61, including a fresh 3-month low on Friday.
The twist: both stocks offer roughly a 3% free cash flow yield. Meta’s is what survives $76B of trailing capex; AppLovin’s is what an asset-light model produces naturally. Forward multiples: META 17.8x, APP 19.6x, same consensus feed, adjusted EPS, July 17 closes.
The calendar: Meta reports Wednesday, July 29; AppLovin reports Wednesday, August 5. The frameworks below treat both dates as binary events.
Meta: The Owned-Audience Machine
Meta’s model is vertically complete: it owns the users (Facebook, Instagram, WhatsApp, Messenger, Threads), the engagement surfaces, the first-party data those surfaces generate, and the ad system that monetizes them. The March quarter showed the machine at full output, with one asterisk worth applying immediately. Revenue of $56.31B grew 33%, and operating income rose about 30%, the number that describes the business.
Headline net income grew 61%, but that was flattered by a reported $8.03B tax benefit worth $3.13 of EPS; strip it, and underlying profit growth ran closer to the operating line. The growth itself is the healthy kind: impressions and pricing rising together, per company disclosures, with Advantage+ automation, Reels, and click-to-message ads pulling budgets in, and business messaging still mostly unmonetized outside a few markets.
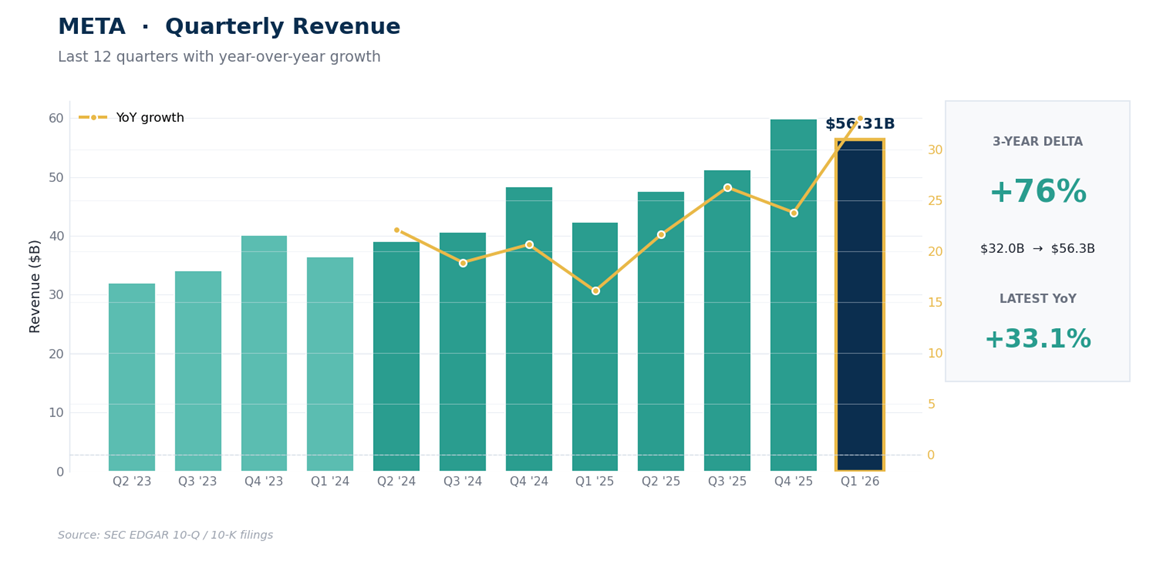
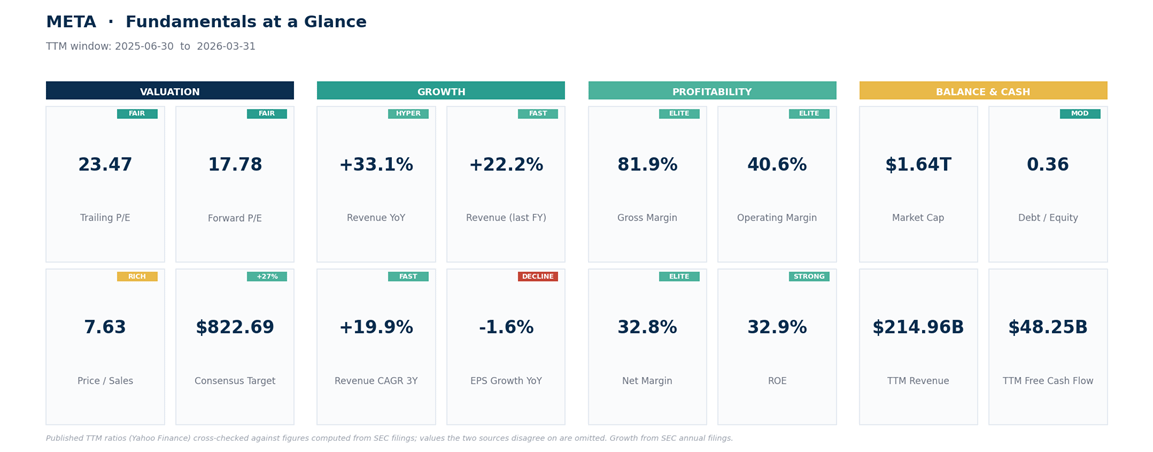
The market’s problem isn’t the ad machine; it’s the bill attached to it. Full-year 2026 capex guidance of $125B to $145B roughly doubles last year’s spend, and trailing free cash flow has compressed to $48.3B from $124B of operating cash flow.
April’s earnings reaction, a beat sold off hard on the capex raise, told you where the anxiety lives. Since then the stock has recovered roughly 20% from its late-June low, helped by reported plans to monetize excess AI capacity through a cloud offering, which introduce the possibility that part of the infrastructure spend eventually supports a second revenue stream, and by a custom chip that Reuters reports is headed for manufacturing in September.
Both are prospects, not businesses, and the de-rate persists: 23.5x trailing, 17.8x forward, for a 33% grower with an 82% gross margin, modest leverage, and ongoing buybacks.
AppLovin: The Rented-Audience Machine
AppLovin sits on the opposite architecture. It owns no social network and no destination app that matters; what it owns is AXON, a bidding engine deciding, millions of times a second, which ad to show inside other companies’ apps, fed by the AppDiscovery demand engine and the MAX mediation layer that see both sides of the auction.
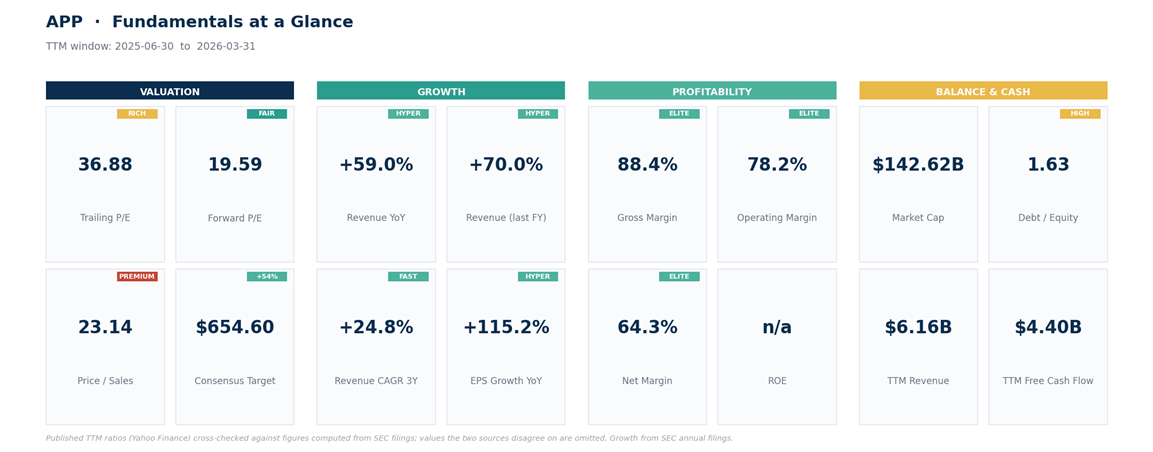
The historical customers are mobile game advertisers, the most mercilessly ROI-driven buyers in advertising, which is why the results are credible: game developers don’t spend on sentiment. The March quarter, with metrics labeled: revenue of $1.84B up 59%, a 78% GAAP operating margin, an 85% adjusted EBITDA margin as the company reports it, net income up 109%, and free cash flow above reported net income because capex rounds to zero.
June-quarter guidance (revenue of $1.815B to $1.945B, adjusted EBITDA near $1.6B) implies no slowdown, and the June opening of Axon self-serve plus the early ramp of web-based e-commerce advertisers is the expansion story.
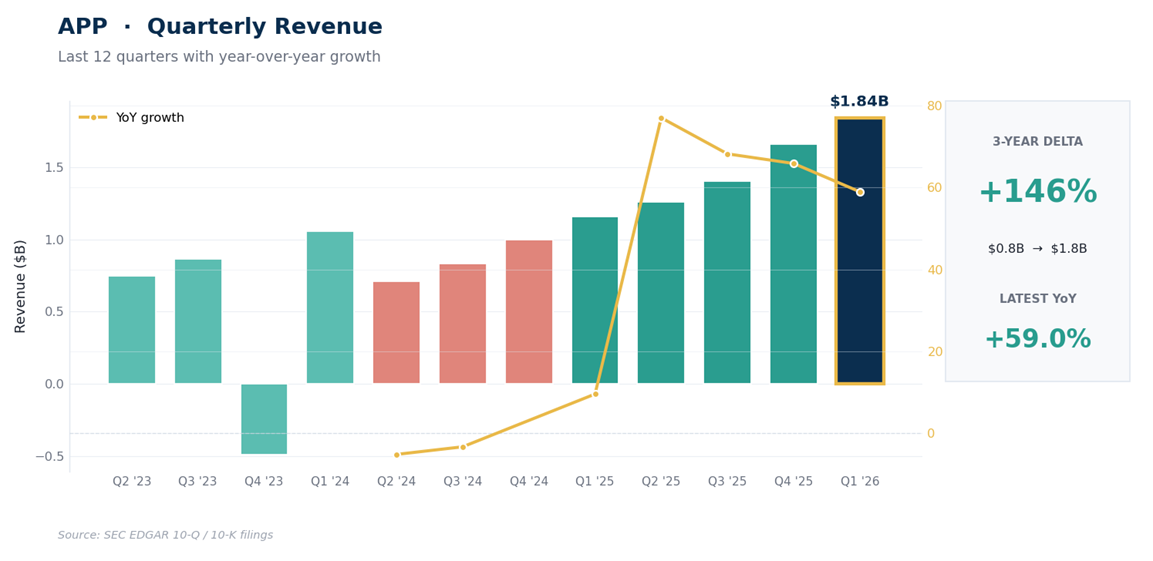
What the growth requires you to believe is the durability question in miniature. Some of the surge is proven product: the AXON upgrade cycle visibly bent the revenue curve. Some is favorable conditions: mobile ad budgets recovering while privacy changes hobbled competitors. And some is still more promise than income statement: e-commerce is early, and disclosure about its mix is thin. A 77% GAAP operating margin earned on rented inventory is an extraordinary claim about pricing power, and extraordinary claims attract competition, scrutiny, and eventually ecosystem owners wanting a larger cut.
How AI Actually Becomes Ad Dollars
Strip the branding and both companies run one mechanism. Performance advertising is a prediction business: whoever best predicts which user converts can charge more per impression while still delivering the advertiser a better return, because less budget is wasted on the wrong people.
Better models raise accuracy; accuracy raises return on ad spend; returns raise budgets; budgets bid up auction prices, and nearly all of that price flows to margin, because serving a smart prediction costs about the same as serving a dumb one. That’s the whole flywheel, and it’s why AI in advertising shows up in numbers rather than demos: a reported 6% conversion lift is worth billions across Meta’s ad base, and AppLovin’s revenue curve since the AXON upgrade is the same effect, smaller and more visible.
The inputs differ, and that difference is the moat discussion. Meta’s edge is data and distribution: billions of logged-in users generating first-party signal on owned surfaces, largely insulated from third-party tracking loss, plus the capital to train frontier models on owned infrastructure. AppLovin’s edge is specialization and speed: a decade of install-and-monetization data, an engine tuned for one job, a small company’s iteration pace. One is a structural advantage that compounds. The other is an execution advantage that must keep being re-earned.
Revenue Quality: Who Depends on Whom
Both are effectively all-advertising, so diversification must be judged inside advertising. Meta’s base is enormous and granular: millions of advertisers led by small businesses, across geographies and industries, on surfaces Meta itself controls. It still lives inside ecosystems it doesn’t own (mobile operating systems and app stores remain gatekeepers, a risk Meta itself flags), but its primary sensitivities are cyclical and regulatory rather than structural. AppLovin’s base is narrower on every axis: concentrated in gaming with e-commerce still young, transacted through app stores whose owners can alter tracking, attribution, or economics unilaterally, and dependent on a single engine staying best-in-class.
Both earn transactional revenue re-won daily in auctions, but Meta’s advertiser base is so wide it behaves like an index of global marketing spend, while AppLovin carries the dependence risk that has historically been adtech’s fatal flaw.
Financial Quality, Side by Side
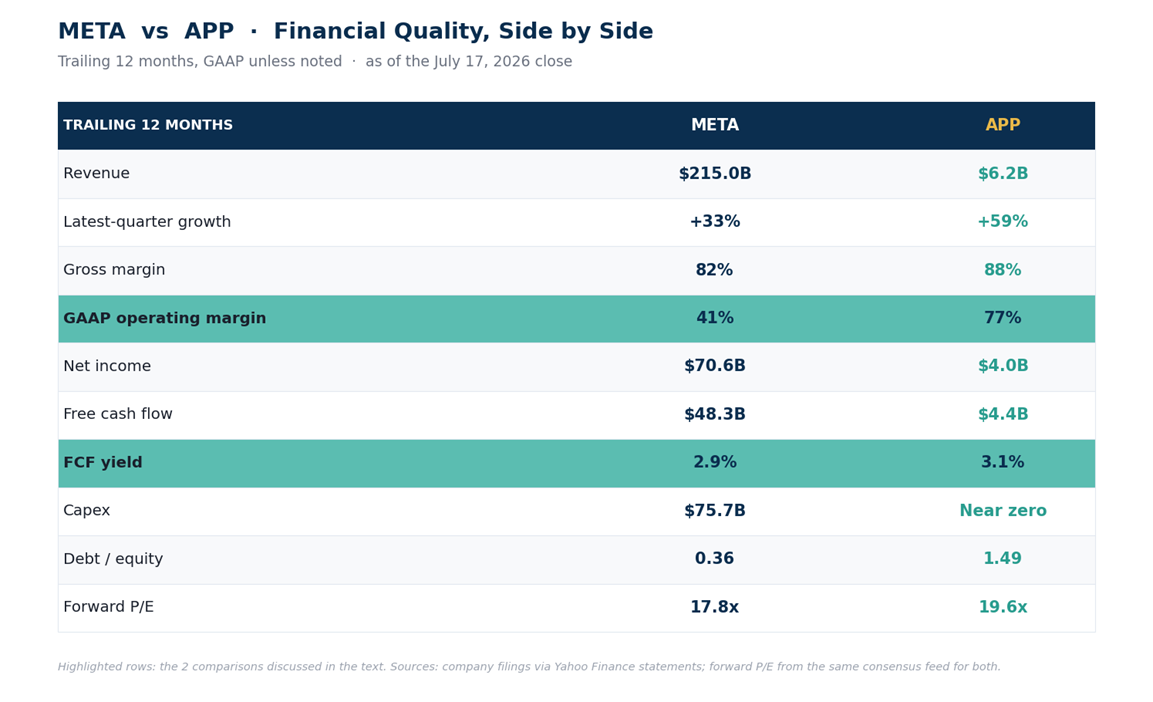
2 rows deserve a pause. AppLovin’s margins exceed Meta’s because Meta is pouring concrete and funding Reality Labs while AppLovin rents everything; that’s why AppLovin has the stronger near-term operating leverage, with each incremental dollar landing almost entirely in profit.
And the near-identical cash yields mean opposite things: Meta’s is suppressed by choice, with tens of billions of annual free cash flow reappearing whenever capex normalizes; AppLovin’s is what the model genuinely produces, against $3.5B of debt on $2.8B of cash, real if modest leverage for a cyclical business.
What the Prices Assume
A methodology note first: the forward multiples come from the same consensus feed, on analysts’ adjusted EPS, struck at July 17, 2026 closes; other providers show somewhat different forward figures depending on their estimate window, so treat the gap between the 2 stocks as the signal, not the decimals. The scenarios below are our own construction, with consensus targets mentioned only as context.
Meta, from a forward EPS near $36: our bear case assumes ad growth halves, capex costs bite, and earnings stall, worth about 15x on roughly flat EPS, or somewhere near $510 to $540, which is where June’s selloff actually bottomed.
Our base case assumes ad growth decelerates toward 20% with operating margins holding near 40%, worth about 20x, or roughly $725. Our bull case adds continued AI-driven pricing gains and early monetization of spare compute, supporting about 22x on $40 of EPS, or near $880. The Street’s mean target of $823 sits between our base and bull, which tells you consensus already leans constructive. Each scenario turns mostly on capex conversion rather than on advertising demand.
AppLovin, from a forward EPS near $22: our bear case assumes growth fades toward 25% to 30% without e-commerce compensating, worth a market-like 15x on $19 to $20, or roughly $285 to $300. Our base case assumes guidance is delivered and growth settles near 40%, worth about 25x, or roughly $540.
Our bull case assumes e-commerce opens a second S-curve at gaming-like margins, supporting 30x on $25, or roughly $750, which is where February’s record sits. The consensus mean of $655 splits our base and bull. At 19.6x forward against 59% current growth (a PEG near 0.35), the market is pricing either sharp deceleration or distrust of the earnings; the drawdown into an earnings print says mostly the latter.
The Technical Map: META
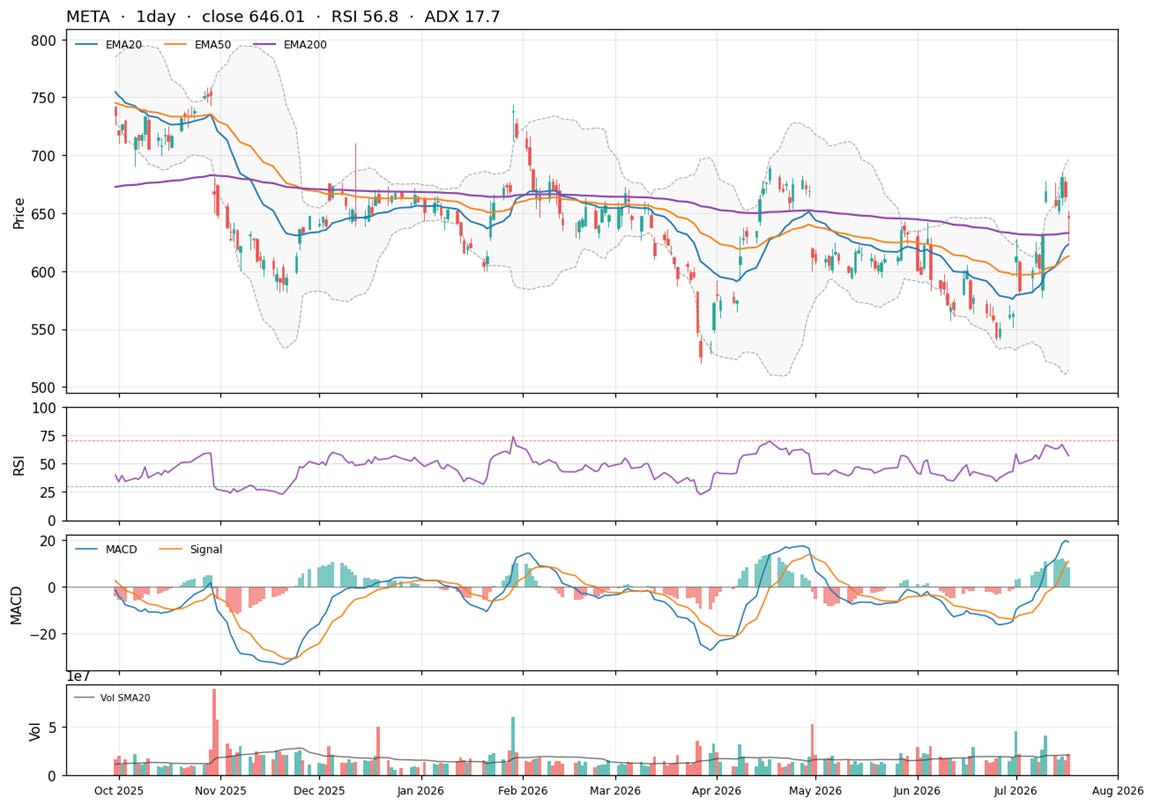
Primary trend: repairing inside a longer uptrend. From a $796.25 record roughly a year ago, the stock fell to $520.26, based near $540 in late June, and has rallied roughly 20% from that low to $646, reclaiming every major daily moving average.
Fibonacci, in plain English: traders measure the April-to-June decline from $744 to $520 and watch which fractions of it the recovery reclaims; each reclaimed fraction converts part of the fall into accepted ground. Price has retaken the halfway point at $632 and is fighting the 38.2% level at $658.
Support: 630 to 638 (the halfway level, the 200-day average at $633, the July consolidation), then 603 to 612 (the 61.8% retracement, the 50-day average, the volatility midline).
Resistance: 686 to 691 (the July 15 recovery high), then 706, then the April shelf at 744, then the record.
Momentum: daily RSI, a 0-to-100 momentum gauge, reads 57, healthy without being stretched; weekly momentum has just turned positive.
Invalidation: a daily close below 594 breaks the recovery structure and re-opens the June lows.
The Technical Map: APP
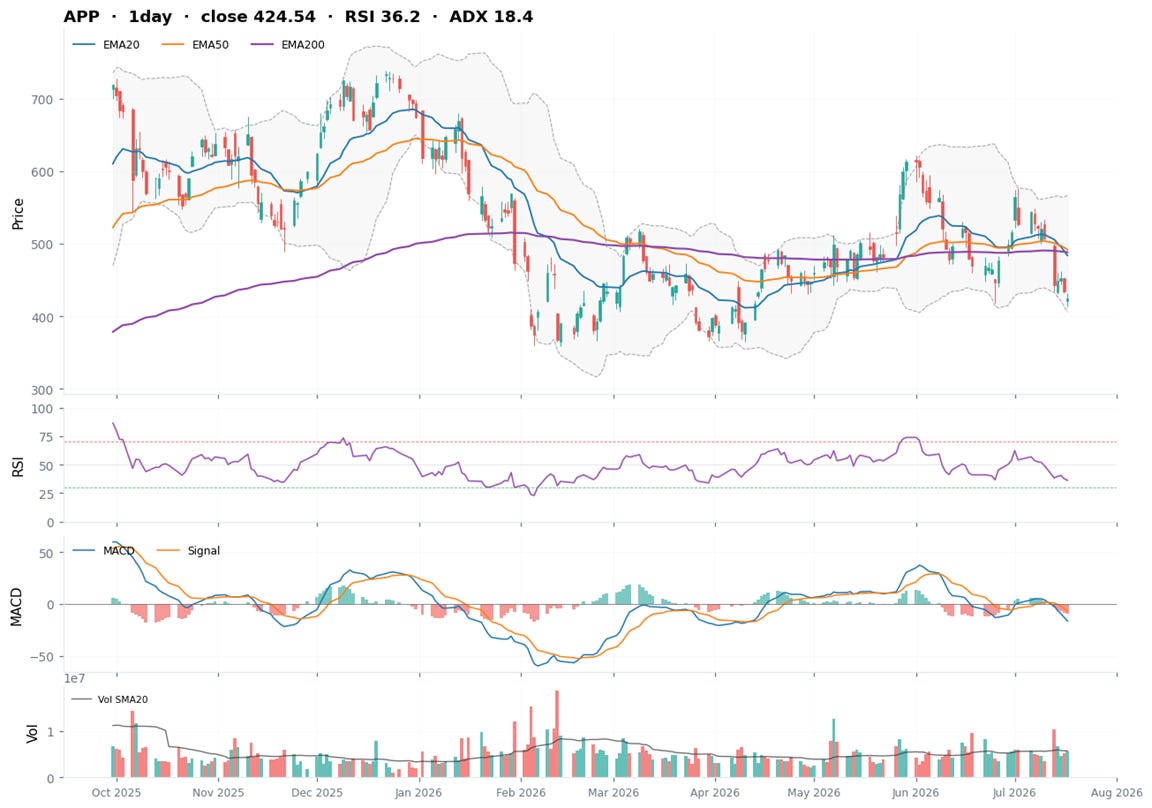
Primary trend: a broken intermediate uptrend inside a still-rising long-term structure. From the February record at $745.61 the stock has corrected 43%, and Friday’s $413.60 was a fresh 3-month low; the knife is still falling. No Elliott count is offered because the sub-waves since February aren’t clean enough to label honestly.
Fibonacci, plainly: measure the entire 2-year advance from about $61 to $745.61. The halfway giveback of that whole run sits at $403, and it lands on the 100-week average near $405, the round $400, and the lower daily volatility band. When independent measures stack within a few dollars, the zone matters more than any single line.
Support: 400 to 414, then 360 (the weekly band and last summer’s shelf), then the 52-week low at $343.
Resistance: 460 (the 61.8% retracement of the June-to-July slide and the broken shelf), then 490 (the 50-day area), then 520 and 560.
Momentum: daily RSI is 36 and the fast stochastic sits at 5, deeply oversold on this setting, but selling pressure is dominant and oversold persists in downtrends. Weekly momentum is neutral, not broken, which keeps the long-term structure alive.
Invalidation: a daily close below 392 abandons the cluster, with the next shelf 8% to 12% lower.
Risk Ledgers, Stated Plainly
Meta’s bull thesis fails if the capex doesn’t convert: 2 to 3 years of $100B-plus spending with flat ad share and no second revenue stream would turn 2026’s anxiety into a structural re-rating. Also live: regulation on multiple continents, engagement migration among younger users, Reality Labs losses without a payoff, ad cyclicality, and content-politics shocks on no schedule. Normal volatility is a soft quarter of ad pricing; deterioration is ad revenue decelerating while capex guidance rises again.
AppLovin’s bull thesis fails if the growth proves borrowed rather than owned: sharp deceleration without e-commerce compensating would say AXON’s edge was a cycle, not a moat. Also live: Apple or Google policy changes (the largest structural threat), gaming concentration, e-commerce execution against Meta itself, competitive response from better-funded rivals, multiple compression that needs no fundamental trigger, and the standing skeptic question, raised publicly by bears in past years, of how much of the measured lift is truly incremental; that’s a debate about attribution methodology, not an allegation, and the doubt is already in the multiple. Normal volatility is a 30% drawdown in a high-beta name; deterioration is a guidance miss plus ecosystem-policy news in the same season.
The Frameworks, One Each
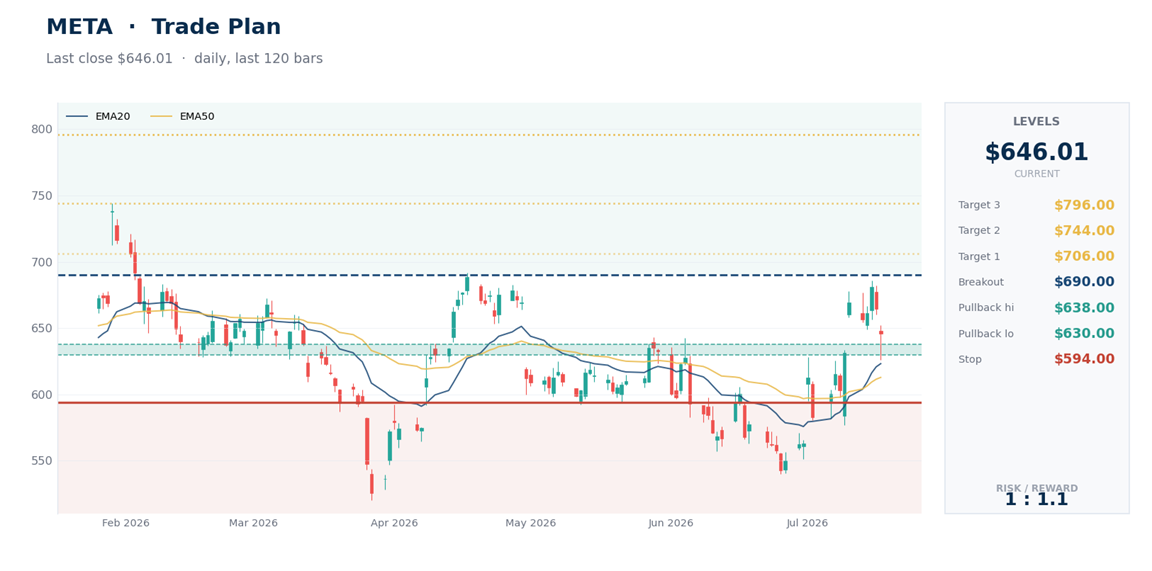
META (illustrative): preferred entry zone 630 to 638 on a pullback; secondary zone 603 to 612. Confirmation is a daily close above 690, opening 706, then 744, then the 796 record. Invalidation is a daily close below 594.
From the preferred zone, planned risk is about 6.5% against about 11% to the first reference. Earnings land July 29: entries before the print deserve half size, and gaps can run losses past plan.
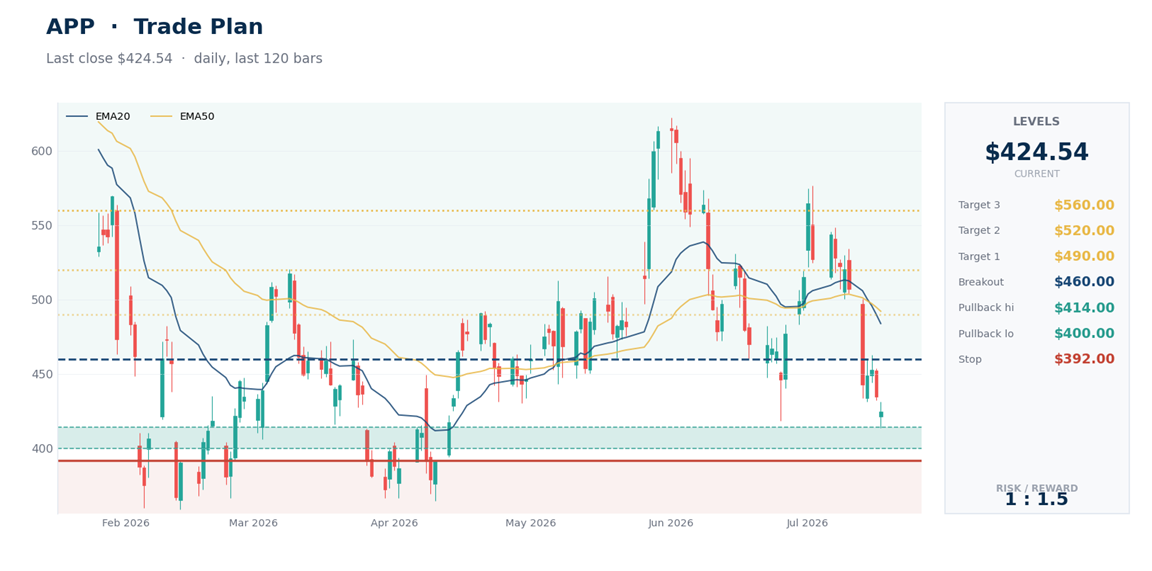
APP (illustrative): this one starts from patience, because the knife is still falling. The 400 to 414 cluster is a stabilization watch zone, not an automatic entry; the condition is a test that holds on a daily close, ideally on fading volume. A daily close above 460 is the repair signal for those who’d rather pay for confirmation, opening 490, 520, then 560. Invalidation is a daily close below 392.
Planned risk from the zone is about 4%, but assume a gap can double it, and earnings on August 5 are the nearest fuse. In both names, sizing does the real work: divide a portfolio risk budget by the trade’s risk and let the answer, not conviction, set the position.
Meta Versus AppLovin: The Verdict
Scored honestly, the categories split. Stronger moat: Meta, by a wide margin. Faster growth: AppLovin, 59% versus 33%. Stronger balance sheet: Meta. Greater operating leverage: AppLovin. More exposed to ad cyclicality per dollar: AppLovin, through concentration. Ecosystem-policy risk: AppLovin’s is existential in the tail; Meta’s is real but chronic rather than acute. More valuation risk: AppLovin, because its earnings base is younger and its multiple can compress on doubt alone. Stronger long-term risk-adjusted setup: Meta. Greater upside in the fully bullish scenario: plausibly AppLovin, by a wide margin, because smaller denominators compound faster.
That isn’t a forced tie; it’s 2 different jobs, and which one belongs in a portfolio depends on the risk budget funding it.
TL;DR and Final Framing
TL;DR: Meta at 17.8x forward is a 33% grower de-rated for spending $125B to $145B on its own future; the thesis is capex conversion, and the tape is repairing into July 29. AppLovin at 19.6x forward is a 59% grower priced for deceleration and doubt; the thesis is that AXON’s edge extends beyond gaming, and the tape is broken until 460 is reclaimed, with earnings August 5.
Watch, in order: Meta’s ad growth against its capex guidance (that ratio is the thesis), any disclosed revenue from monetizing spare compute, AppLovin’s growth rate and e-commerce disclosure, and any Apple or Google attribution-policy noise. For Meta to outperform, the ad machine must keep paying for the buildout while the buildout becomes a business. For AppLovin to outperform, August 5 has to show the growth is owned, and 400 has to prove it was where the doubt got fully priced. Hold both stories to their numbers; the auction, as always, will clear the argument.
This is research and commentary, not personal investment advice. Levels and trade plans are illustrative; size positions to your own risk tolerance and time horizon. The author may hold positions in names discussed.