
The Market Is Still Priced for a Better World
Why the Nasdaq 100 and S&P 500 may struggle to make real progress in a stickier, harder macro environment

The easy upside phase looks over. Now the market has to earn higher prices again.
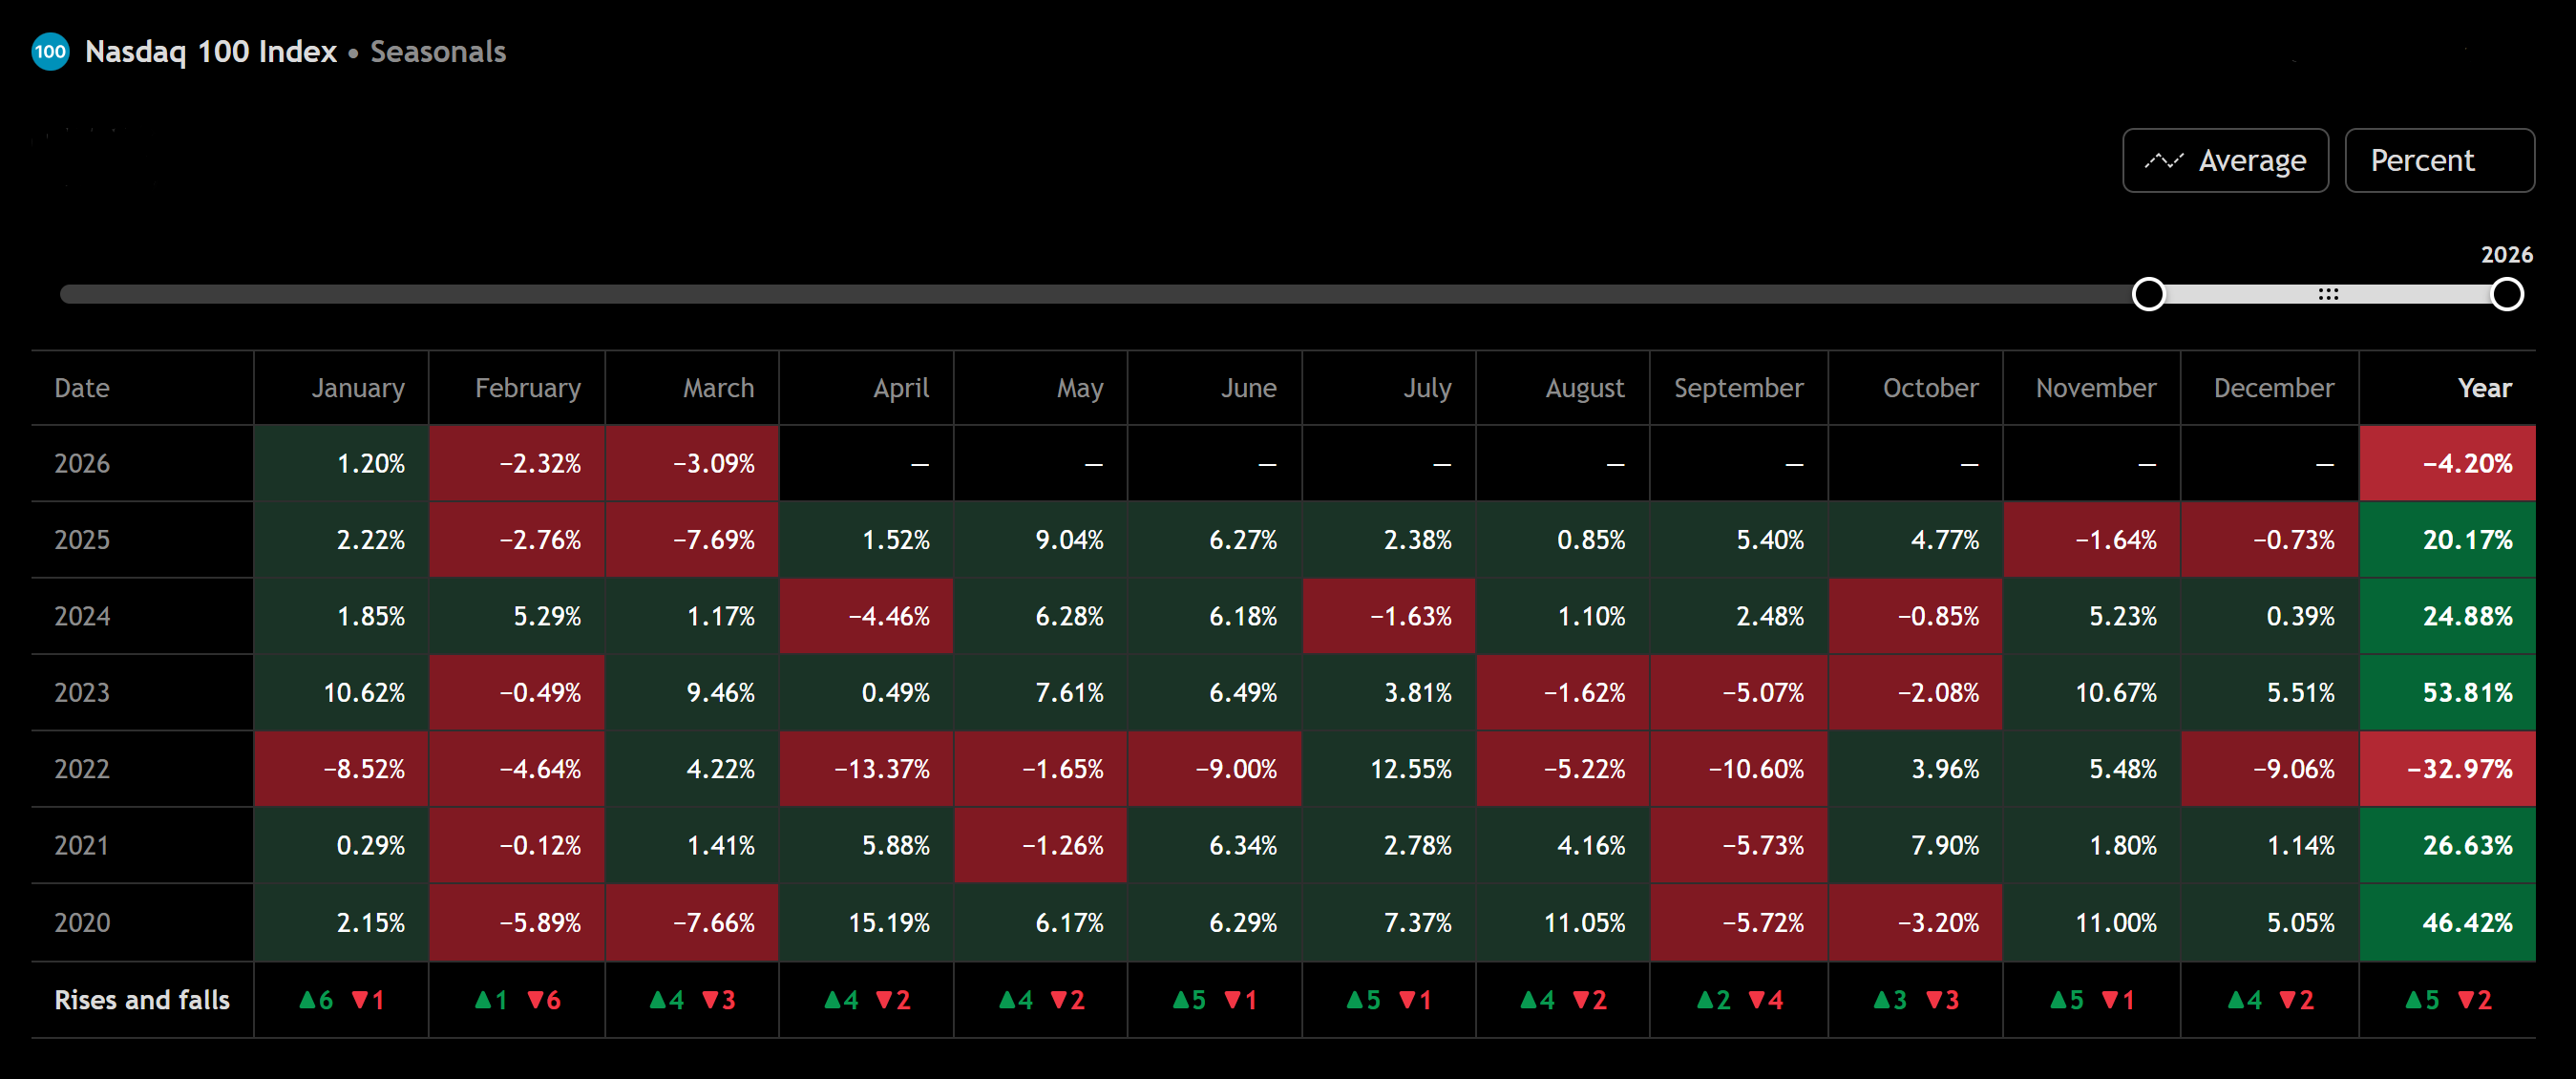
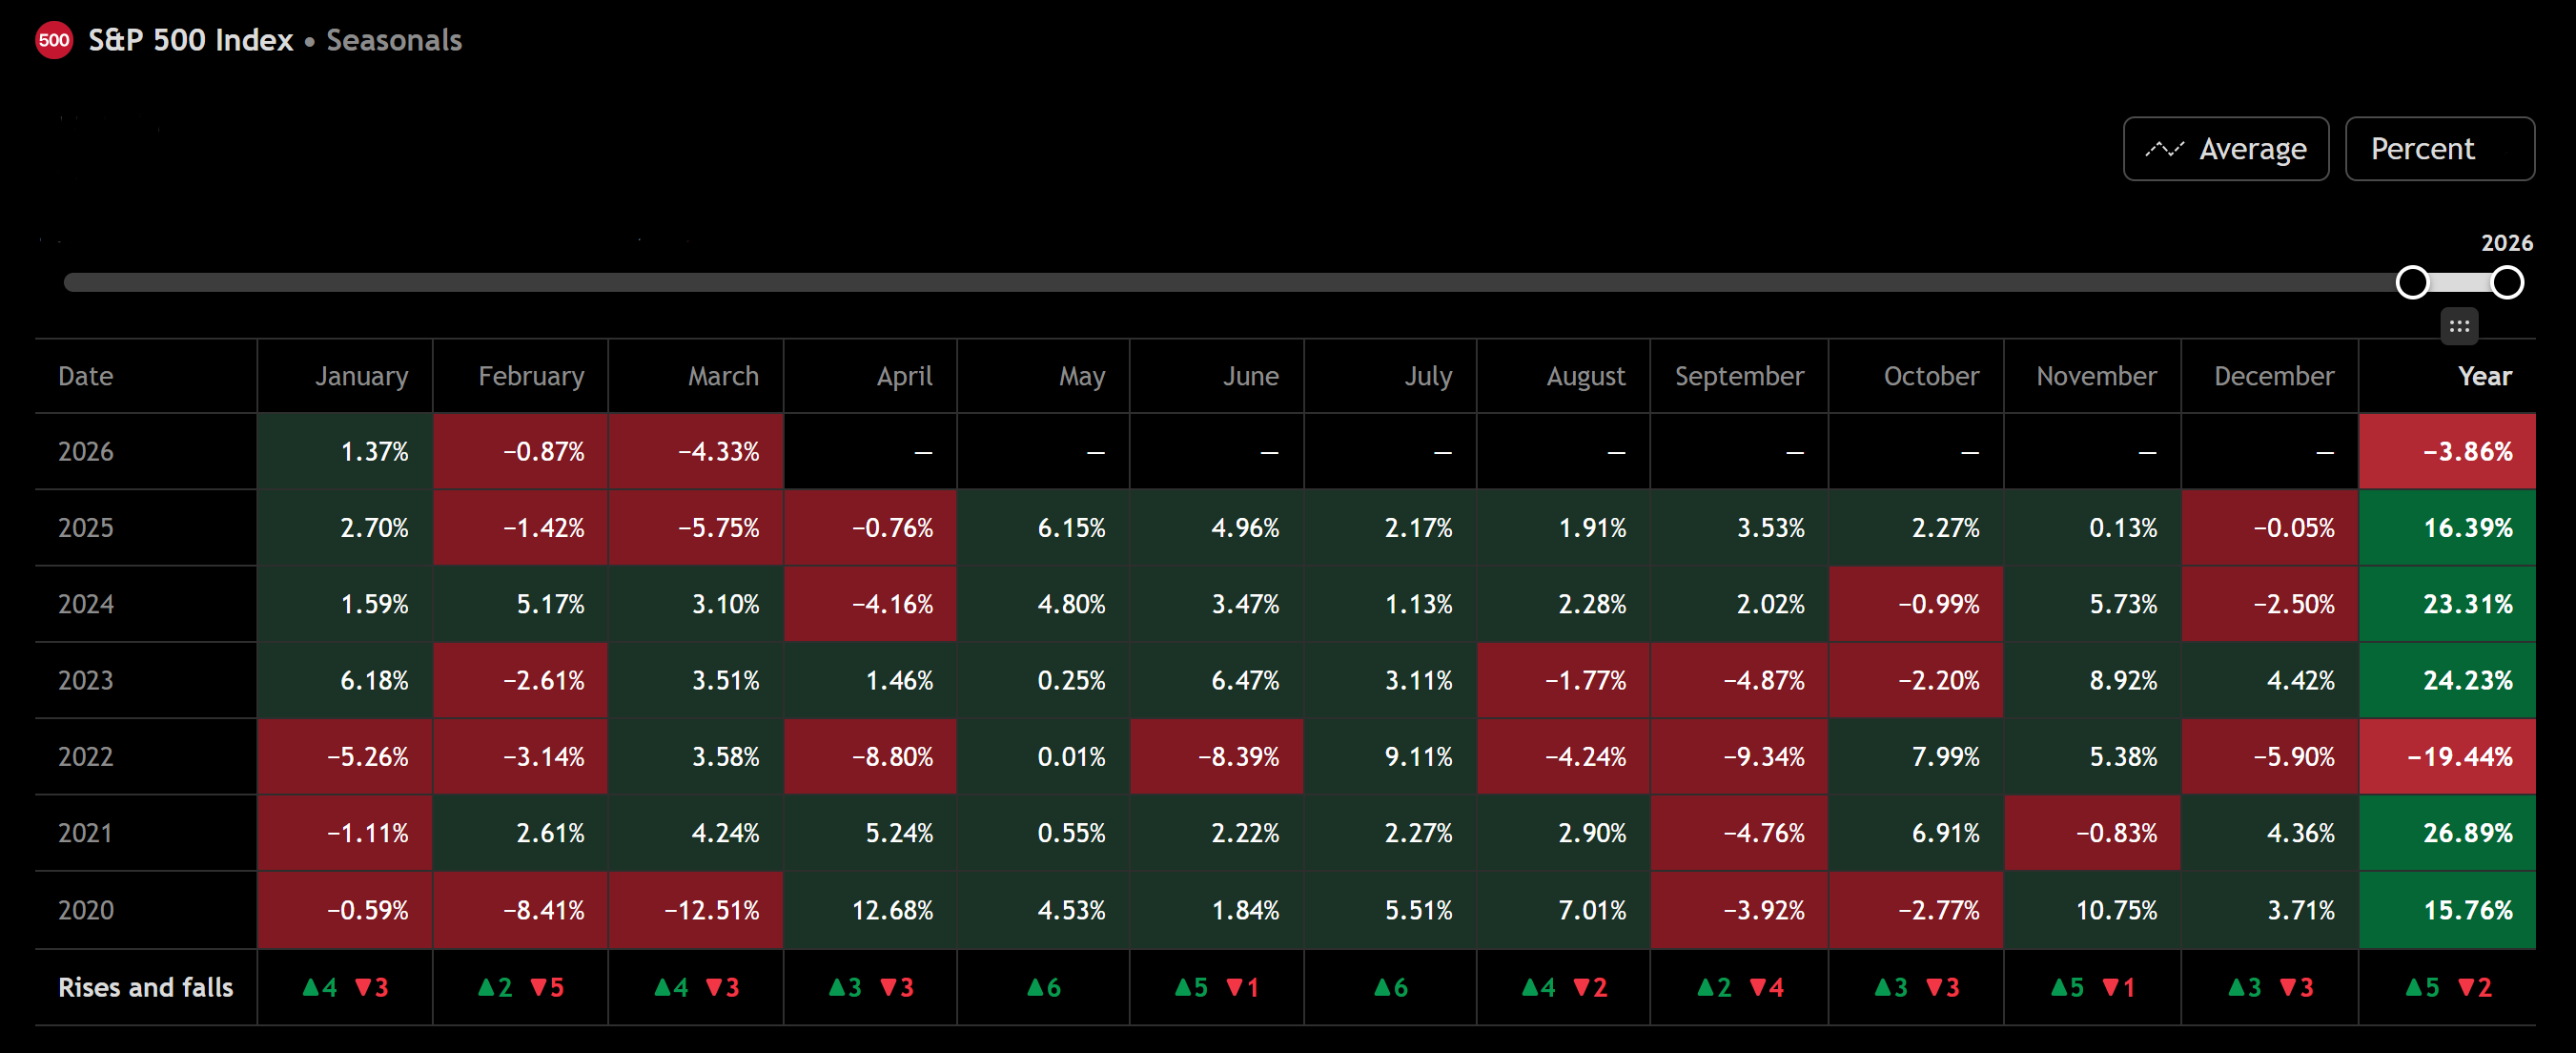
After a huge run in 2023, 2024, and 2025, the market is entering a much less forgiving phase.
That is the real story.
This is no longer a backdrop where investors can assume falling inflation, friendly policy, and ever-rising confidence will keep lifting broad indices. The setup has changed. Growth has cooled. Inflation is lower than it was, but it is still vulnerable to energy shocks. War and geopolitical stress can push oil higher and keep supply chains messy for longer than the market would like. And after such a strong three-year run, valuations and expectations were already elevated.
That matters because markets do not just react to reality. They react to the gap between reality and expectation.
Right now, that gap still looks too wide.
This is why 2026 has the ingredients to be a frustrating year for index investors. Not necessarily a crash year. Not even necessarily a deeply negative one. But a year where prices can swing sharply, rallies can fail, and both the Nasdaq 100 and S&P 500 can spend a lot of time moving without making much real progress.
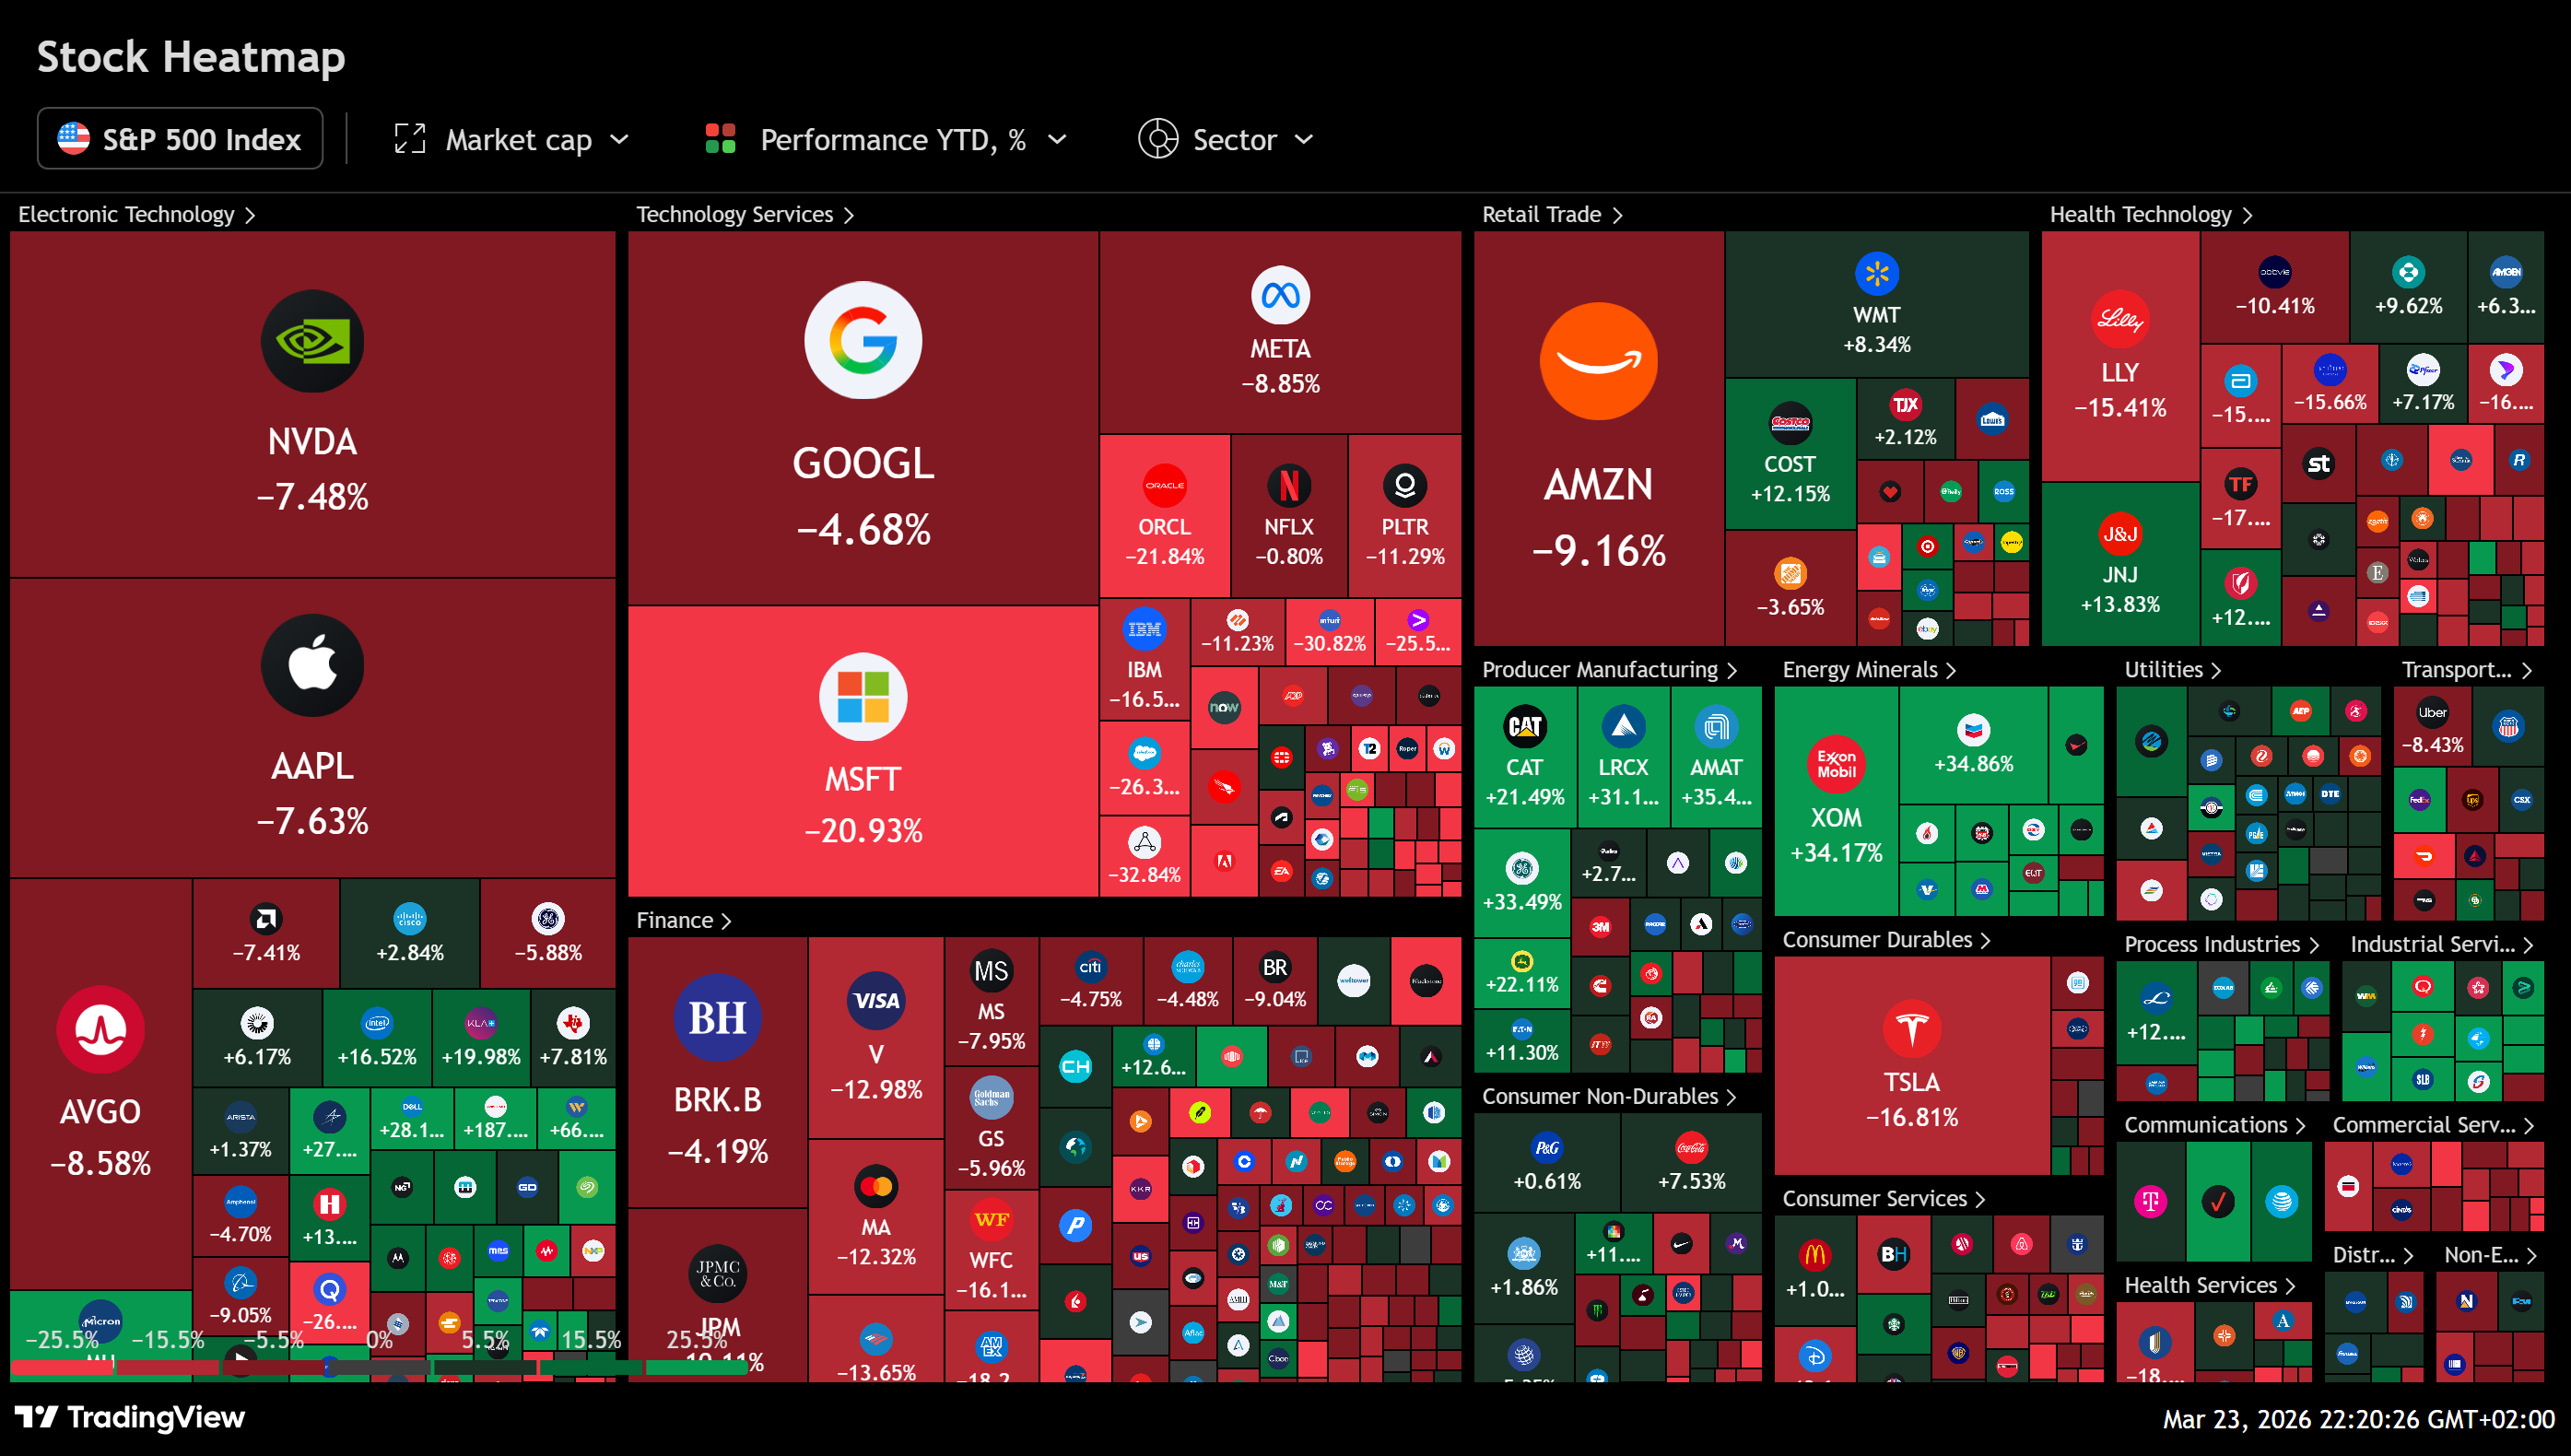
The Nasdaq is more exposed because it carries the richest expectations, the greatest sensitivity to rates, and the heaviest dependence on future growth. The S&P is steadier, but not as insulated as many investors think, because so much of its leadership overlaps with the same mega-cap names that drive the Nasdaq.
So this is not a call for panic. It is a call for realism.
The easy upside phase looks over. Now the market has to prove it deserves higher prices.
Key Takeaways
Nasdaq 100
The long-term quality is still outstanding. The problem is that quality is already expensive, expectations are still high, and AI monetization may take longer than the market first hoped. That leaves the Nasdaq more vulnerable if inflation stays sticky and rates stay firm.
S&P 500
The S&P 500 is broader and healthier than the Nasdaq, but not immune. Its diversification helps, but many of its most important holdings are the same giant growth names driving the Nasdaq. If leadership cracks, both indices feel it.
The 2026 setup
This looks like a year of volatility, failed follow-through, and selective opportunity. Markets can bounce. They can even rally hard. But unless inflation cools cleanly and growth re-accelerates, broad indices may struggle to produce the kind of steady gains investors have grown used to.
The Real Problem: Expectations Still Belong to an Easier Market
The cleanest way to understand this year is simple.
The macro backdrop no longer matches the optimism built into the market.
For most of the last three years, investors had a powerful combination working in their favor. Inflation was expected to cool, growth held up better than feared, and the biggest companies in the market delivered both earnings strength and a compelling long-term AI narrative. That was enough to support rising multiples and repeated dip-buying.
Now the setup is tougher.
If energy prices stay high because of war and geopolitical instability, inflation can remain sticky even as growth slows. That is a difficult mix for equities. It pressures consumer spending, compresses margins, and keeps central banks from turning openly supportive. Energy matters because it is the fastest way to reprice the entire soft-landing narrative. It can hit transport, industrial costs, household budgets, and inflation expectations all at once.
That is why this matters so much for valuation.
High-quality growth businesses can still be great investments. But when the macro backdrop becomes less cooperative, the market becomes less willing to pay peak multiples for future perfection. That is especially true after a long run higher.
AI is part of this too. The long-term opportunity is real. But monetization does not happen on the market’s preferred schedule. Capital spending can arrive first. Returns often take longer. If investors become less patient, then even strong businesses can face valuation pressure simply because expectations ran too far ahead of near-term reality.
This is why the key question for 2026 is not whether the economy falls apart.
The better question is whether the market was priced for a cleaner environment than it is actually getting.
The answer still looks like yes.
Nasdaq 100
The market’s growth engine is now its pressure point
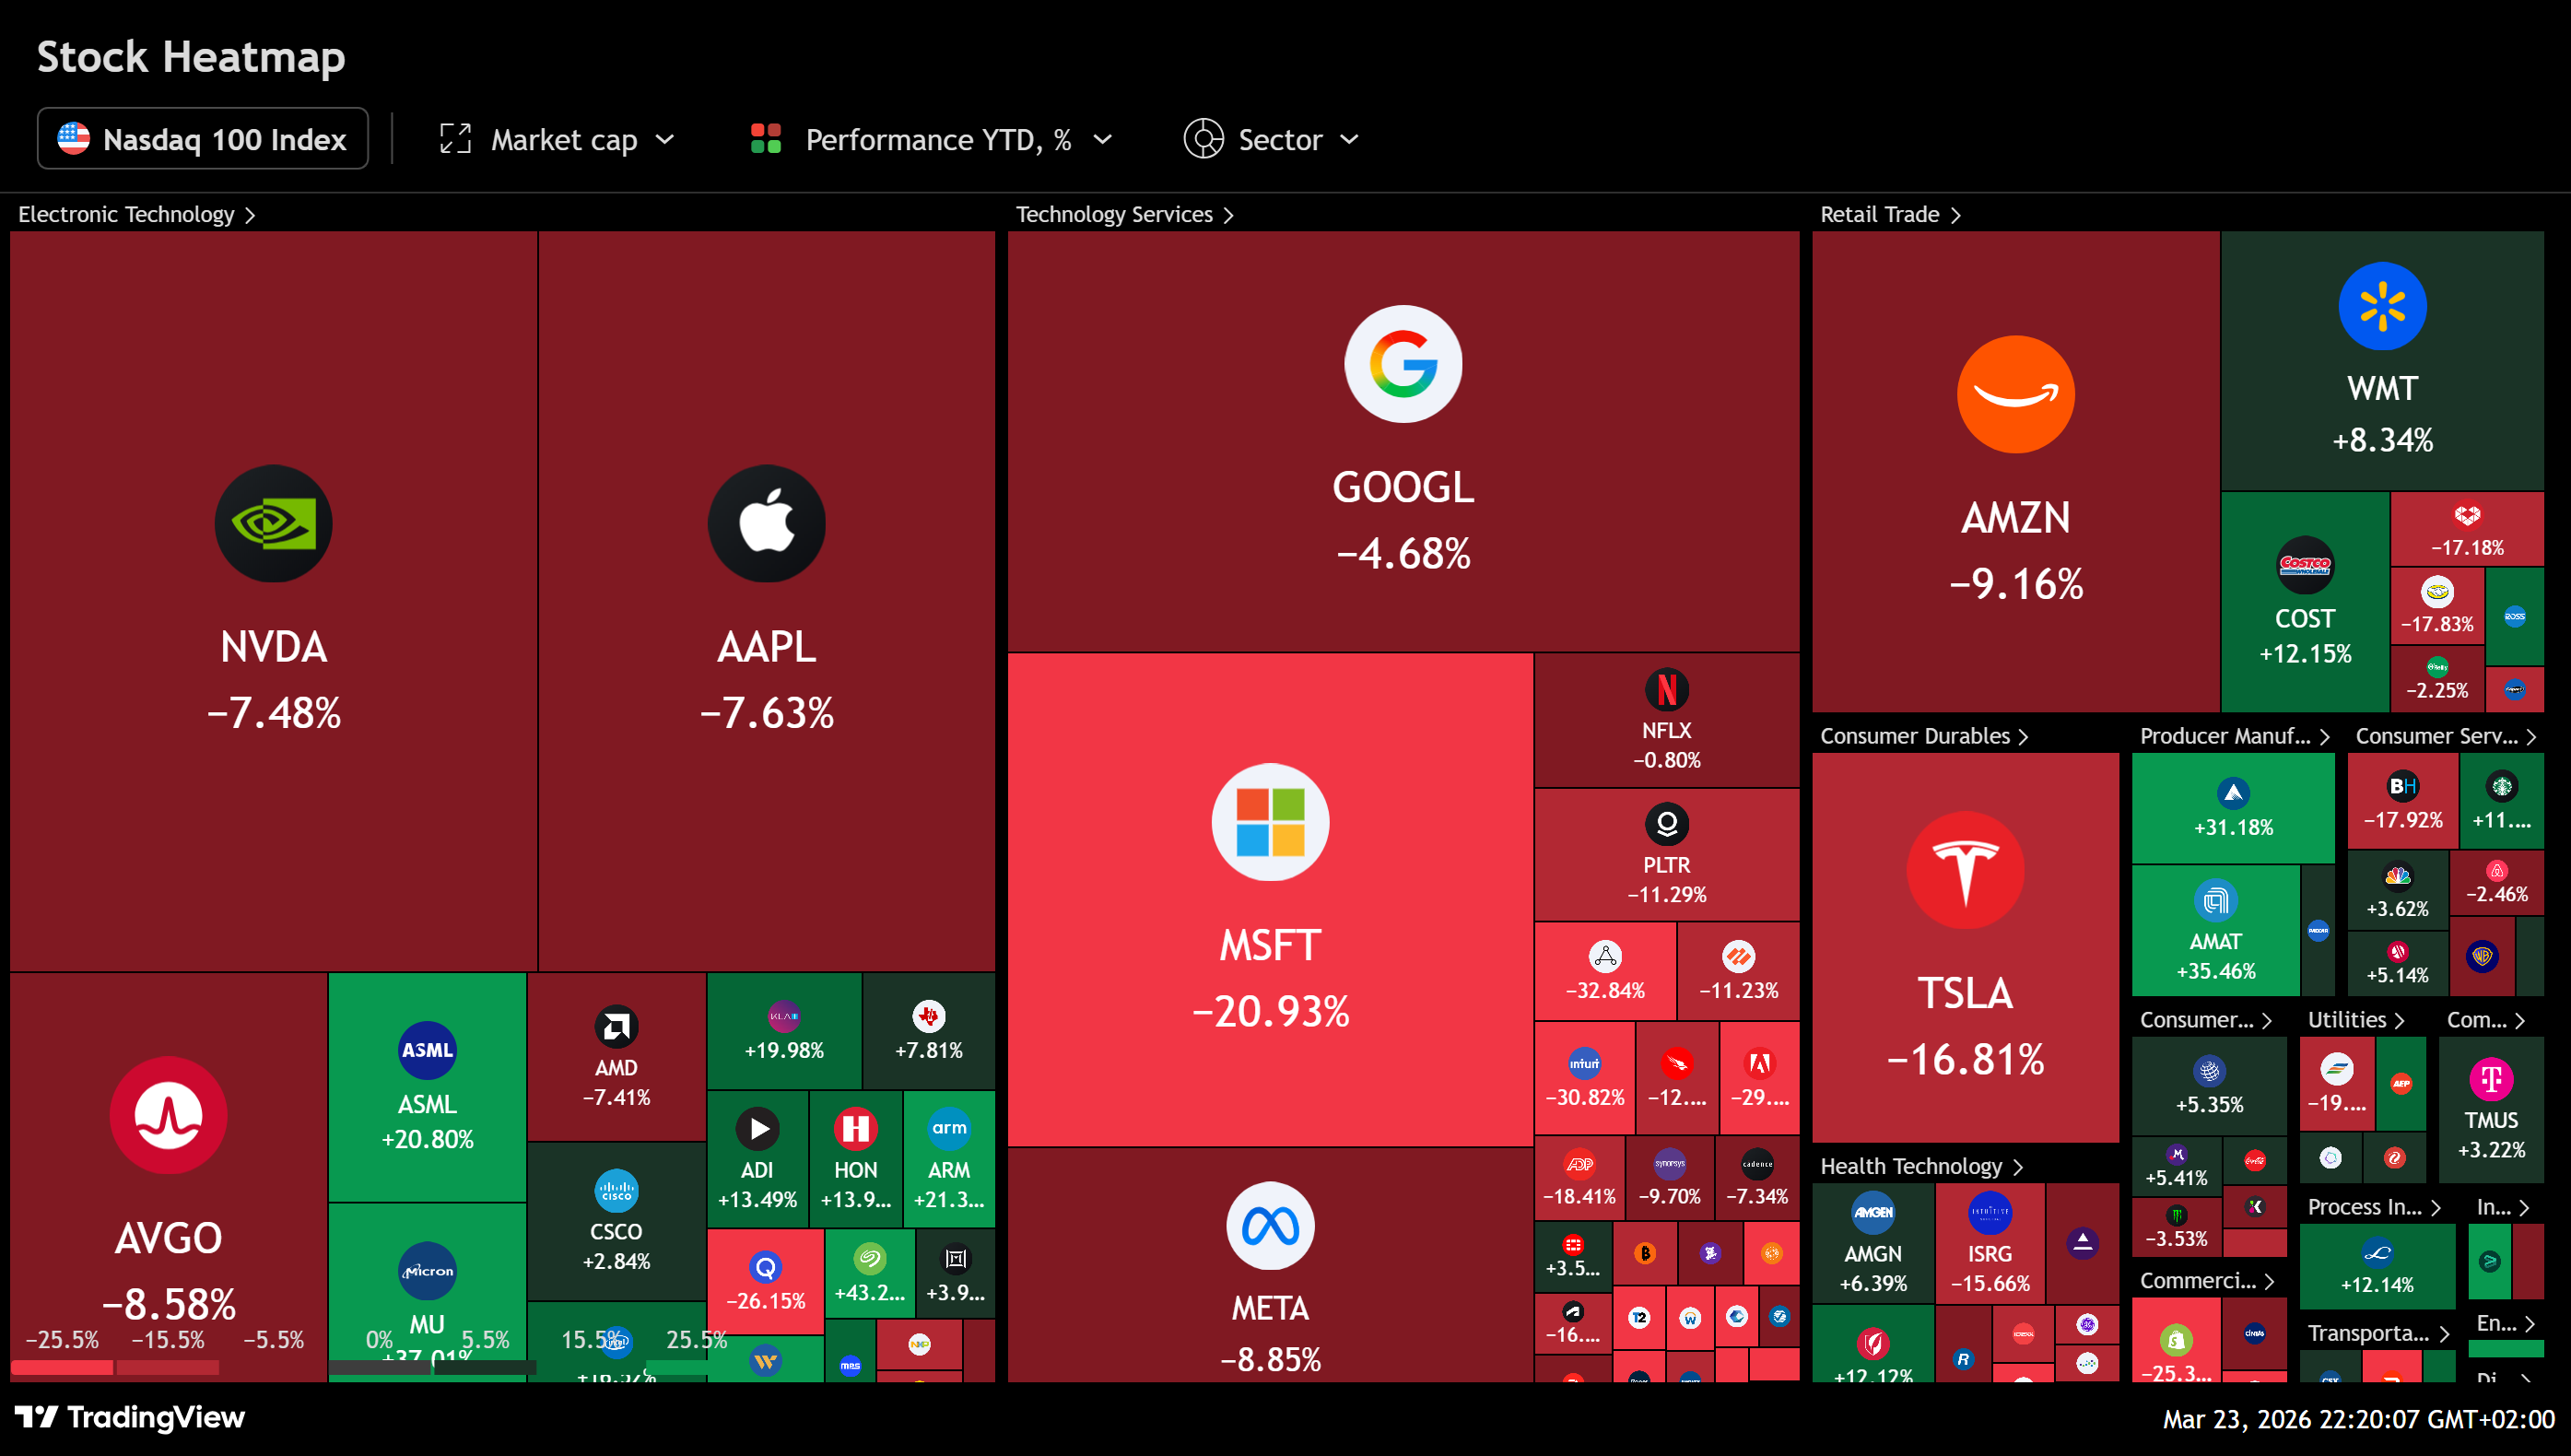
The Nasdaq 100 still holds many of the best businesses in the world. That has not changed.
It remains the home of mega-cap growth, semiconductors, AI infrastructure, cloud, and software. If the macro backdrop improves, this will likely be the part of the market that responds most powerfully.
But that same strength creates the problem.
The Nasdaq is where the market stores its biggest expectations. It is where investors have paid the highest multiples for future growth. It is also the index that tends to struggle most when yields stay elevated, inflation remains sticky, or the market starts demanding proof instead of promise.
That is why it looks more vulnerable here than the S&P 500.
Fundamental view
This is not a business quality problem. It is an expectations problem.
The top of the Nasdaq is full of companies with dominant balance sheets, enormous cash generation, and real secular growth drivers. But after three strong years, the market was already pricing in a lot. Continued AI enthusiasm. Continued earnings durability. Eventually, meaningful AI monetization.
That is a high bar.
If inflation proves sticky because of energy, the path to lower yields becomes harder. If yields stay firm, long-duration growth becomes harder to re-rate. And if AI monetization arrives more slowly than investors first assumed, the market may start treating these companies less like limitless growth engines and more like great businesses that were simply priced too richly.
Great companies do not always produce great index returns, especially when the index is already priced for near-perfection.
Fundamental conclusion: The Nasdaq still has the best long-term growth profile in the market. But it also has the least room for disappointment.
Technical view
Technically, the Nasdaq still looks like a bull-market correction, not a full structural breakdown. But the correction is not convincingly finished.
Both major indices have lost their short and medium-term trend structure. The main reason the broader correction thesis still holds, rather than a full bearish breakdown thesis, is that they are still hovering around their 200-day and 50-week support zones.
For NDX, the weekly chart shows price below the 20-week EMA at 24,736.96, but still above the 50-week EMA at 23,779.87. That says the longer-term trend is under pressure, but still intact.
The bigger problem is on the daily chart. Price is below the 20-day EMA at 24,653.38, below the 50-day EMA at 24,919.29, and below the 100-day EMA at 24,869.53. It is only modestly above the 200-day EMA at 24,148.00. That is the key line holding the broader correction thesis together.
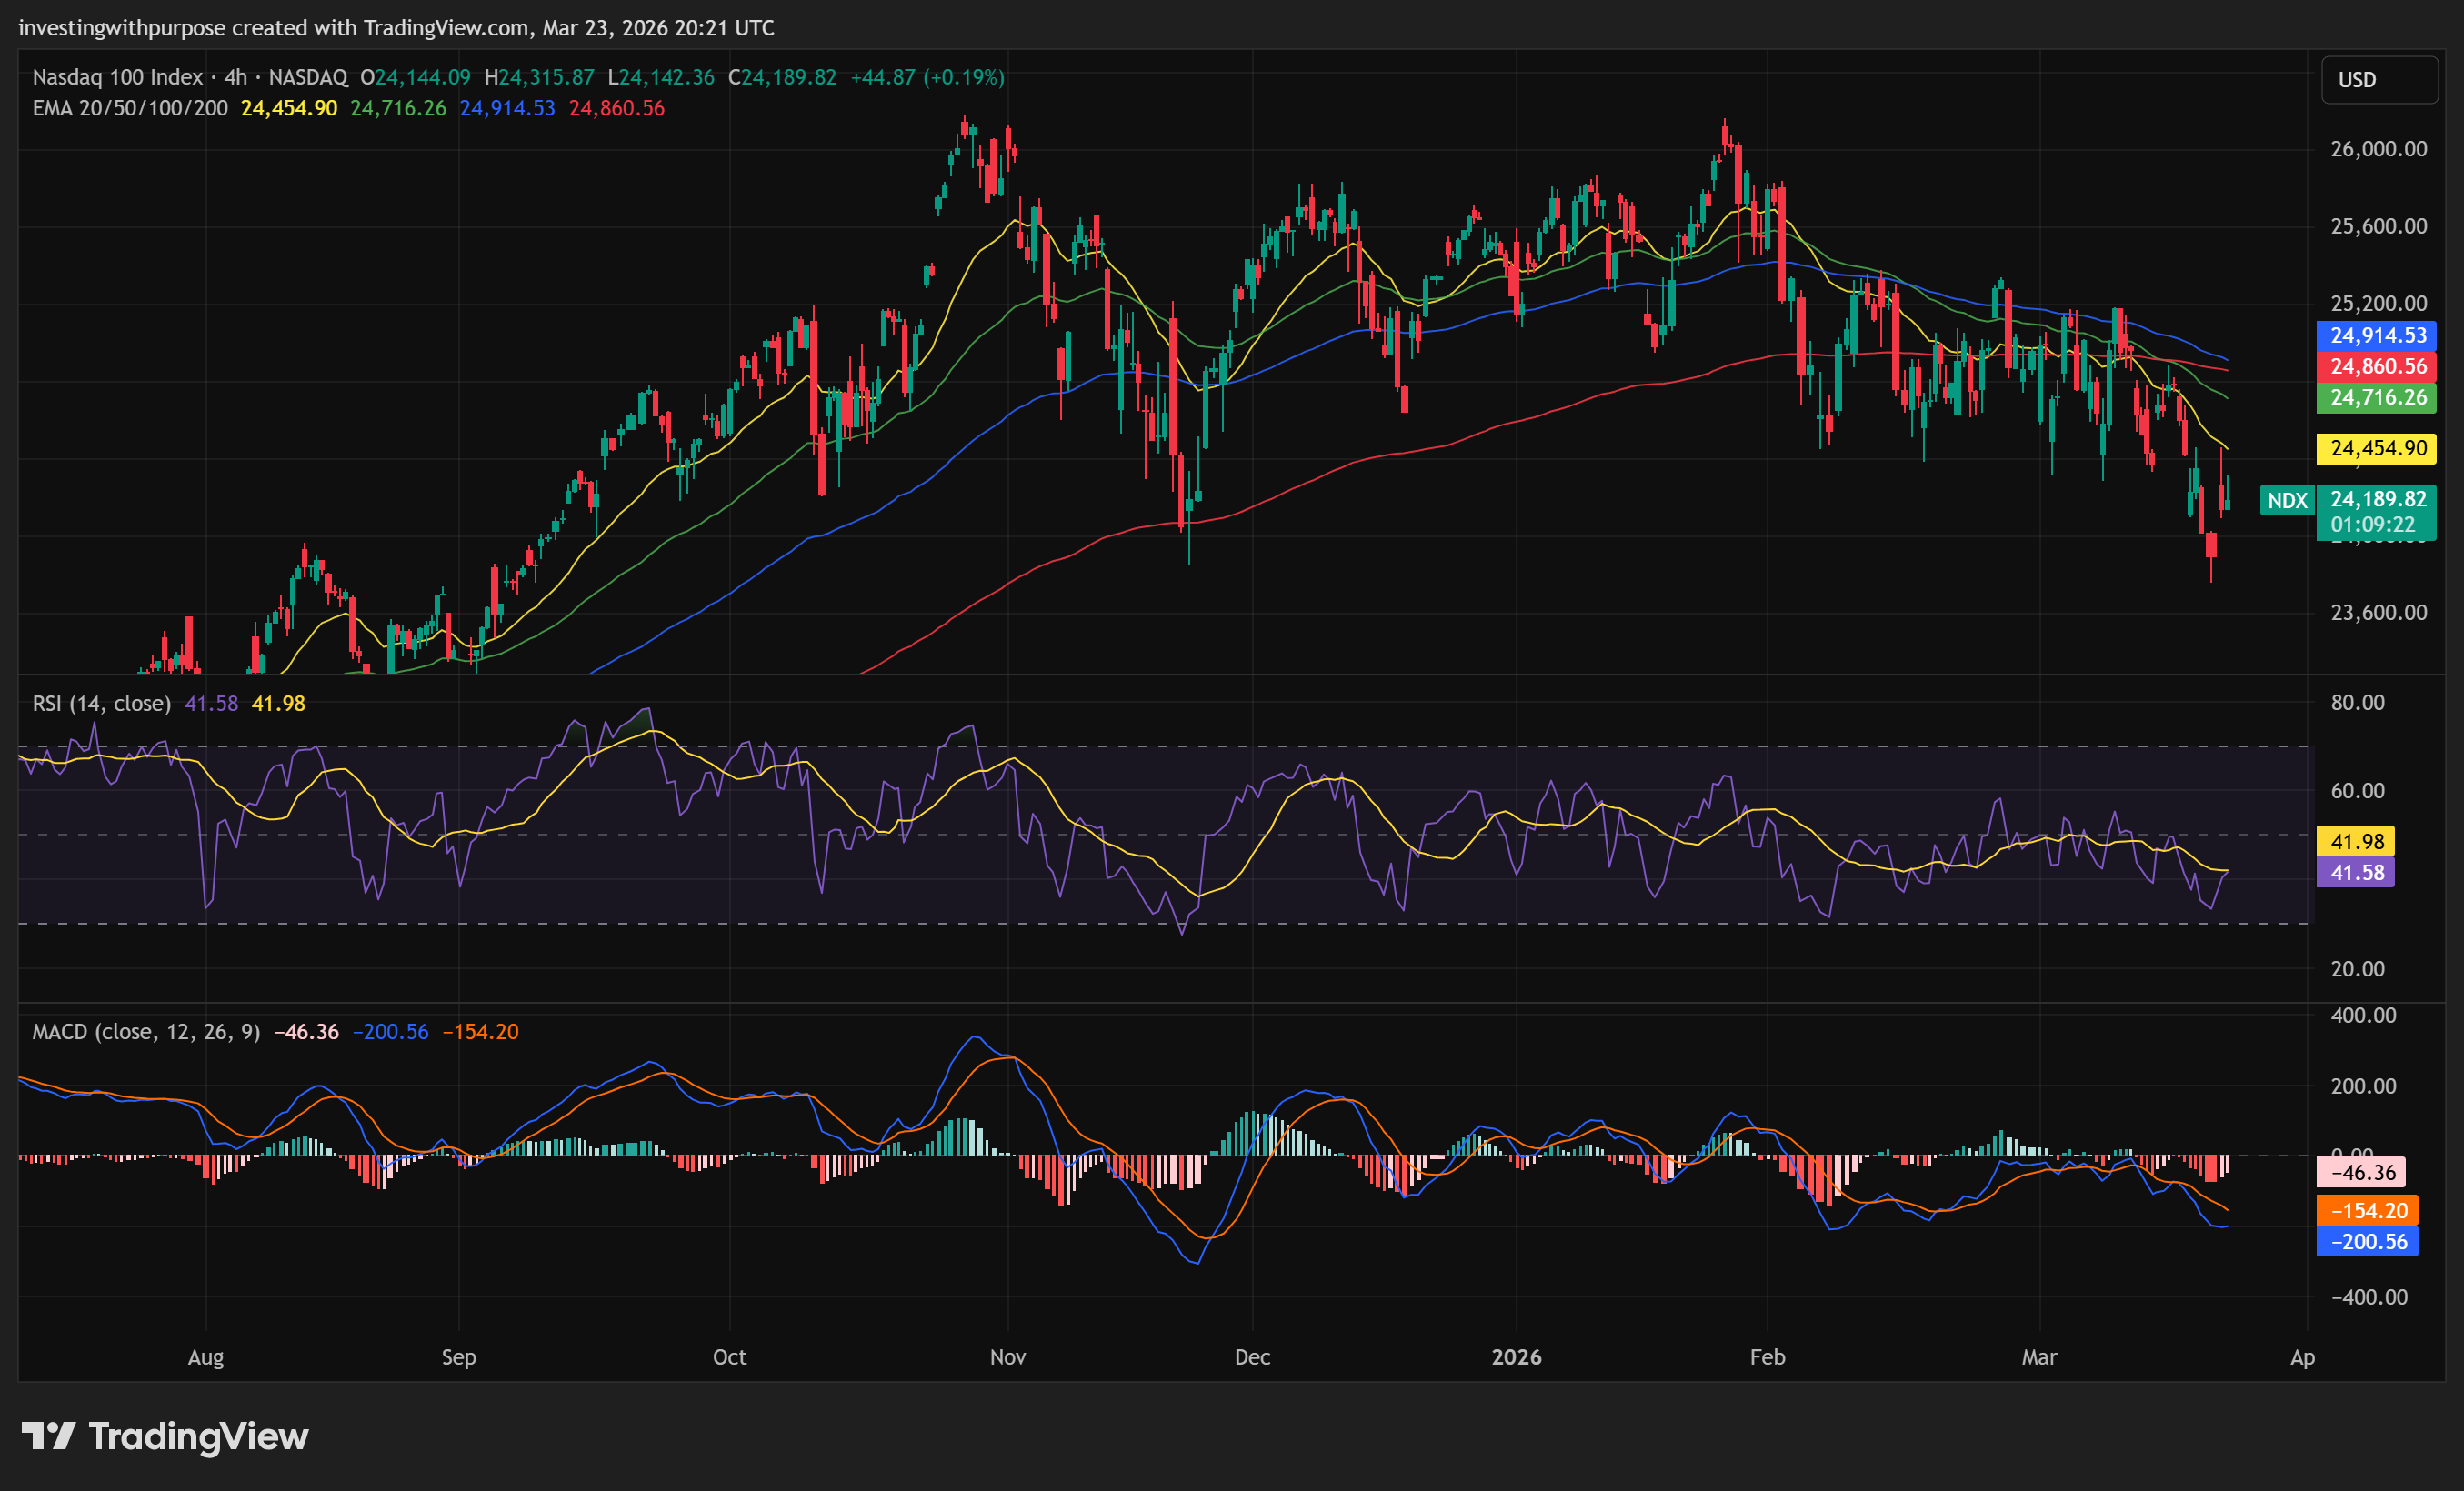
Momentum still leans bearish. Daily RSI at 42.72 is weak. Daily MACD remains negative. The daily Ichimoku setup is also still bearish, with price below Tenkan, Kijun, and the cloud. That tells you rallies are still happening under resistance, not above it.
The most important support zone sits at 24,200 to 23,800. That is the area bulls need to defend to keep this looking like a correction rather than something deeper.
The key resistance zone sits at 24,335 to 24,726. If the index starts reclaiming that range, the tone improves. Above that, 24,900 to 25,000 becomes the next real repair zone.
Technical conclusion: The Nasdaq is close enough to support to bounce, but still damaged enough that every rally has to prove itself.
S&P 500
The broader market looks steadier, but not safe
The S&P 500 is in a better position than the Nasdaq. That part is true.
But investors should be careful not to overstate that advantage.
The S&P is broader, which helps in a mixed environment. It has healthcare, industrials, financials, consumer names, energy, and defensives alongside technology. That makes it less fragile when leadership narrows or macro conditions get tougher.
But it is not insulated.
That is the part many investors miss. The S&P looks diversified, but a large share of its real leadership still comes from the same mega-cap names that dominate the Nasdaq. So while the S&P is the steadier chart, it is still heavily influenced by the exact leadership group carrying the highest expectations.
That is why the overlap matters so much.
The S&P is safer than the Nasdaq in this environment. It is just not as safe as the label “broad market” sometimes implies.
Fundamental view
The S&P benefits from balance. That is its main advantage in 2026.
It does not need pure growth leadership to carry the entire index. Defensives can help. Energy can help if oil stays high. Some sectors can absorb a tougher backdrop better than others.
But balance is not immunity.
Slower growth pressures cyclicals. Higher energy prices can hit margins and households. Trade and geopolitical uncertainty reduce visibility for industrials and global supply chains. And if the biggest growth names stop doing the heavy lifting, the broader index still feels it because those companies remain so important to overall index performance.
This is the real distinction between the two indices. The Nasdaq is more exposed to valuation compression. The S&P is more buffered, but still vulnerable to leadership fatigue.
Fundamental conclusion: The S&P 500 is fundamentally more balanced than the Nasdaq, but it still lives under the shadow of the same concentration risk.
Technical view
The technical picture is similar to the Nasdaq, just less severe.
On the weekly chart, SPX is below the 20-week EMA at 6,743.08, but above the 50-week EMA at 6,511.75. That keeps the broader uptrend intact for now.
On the daily chart, price is below the 20-day EMA at 6,724.15, below the 50-day EMA at 6,797.74, and below the 100-day EMA at 6,771.75. It is leaning on the 200-day EMA at 6,594.42. That level matters most because it is the line separating a manageable correction from something deeper.
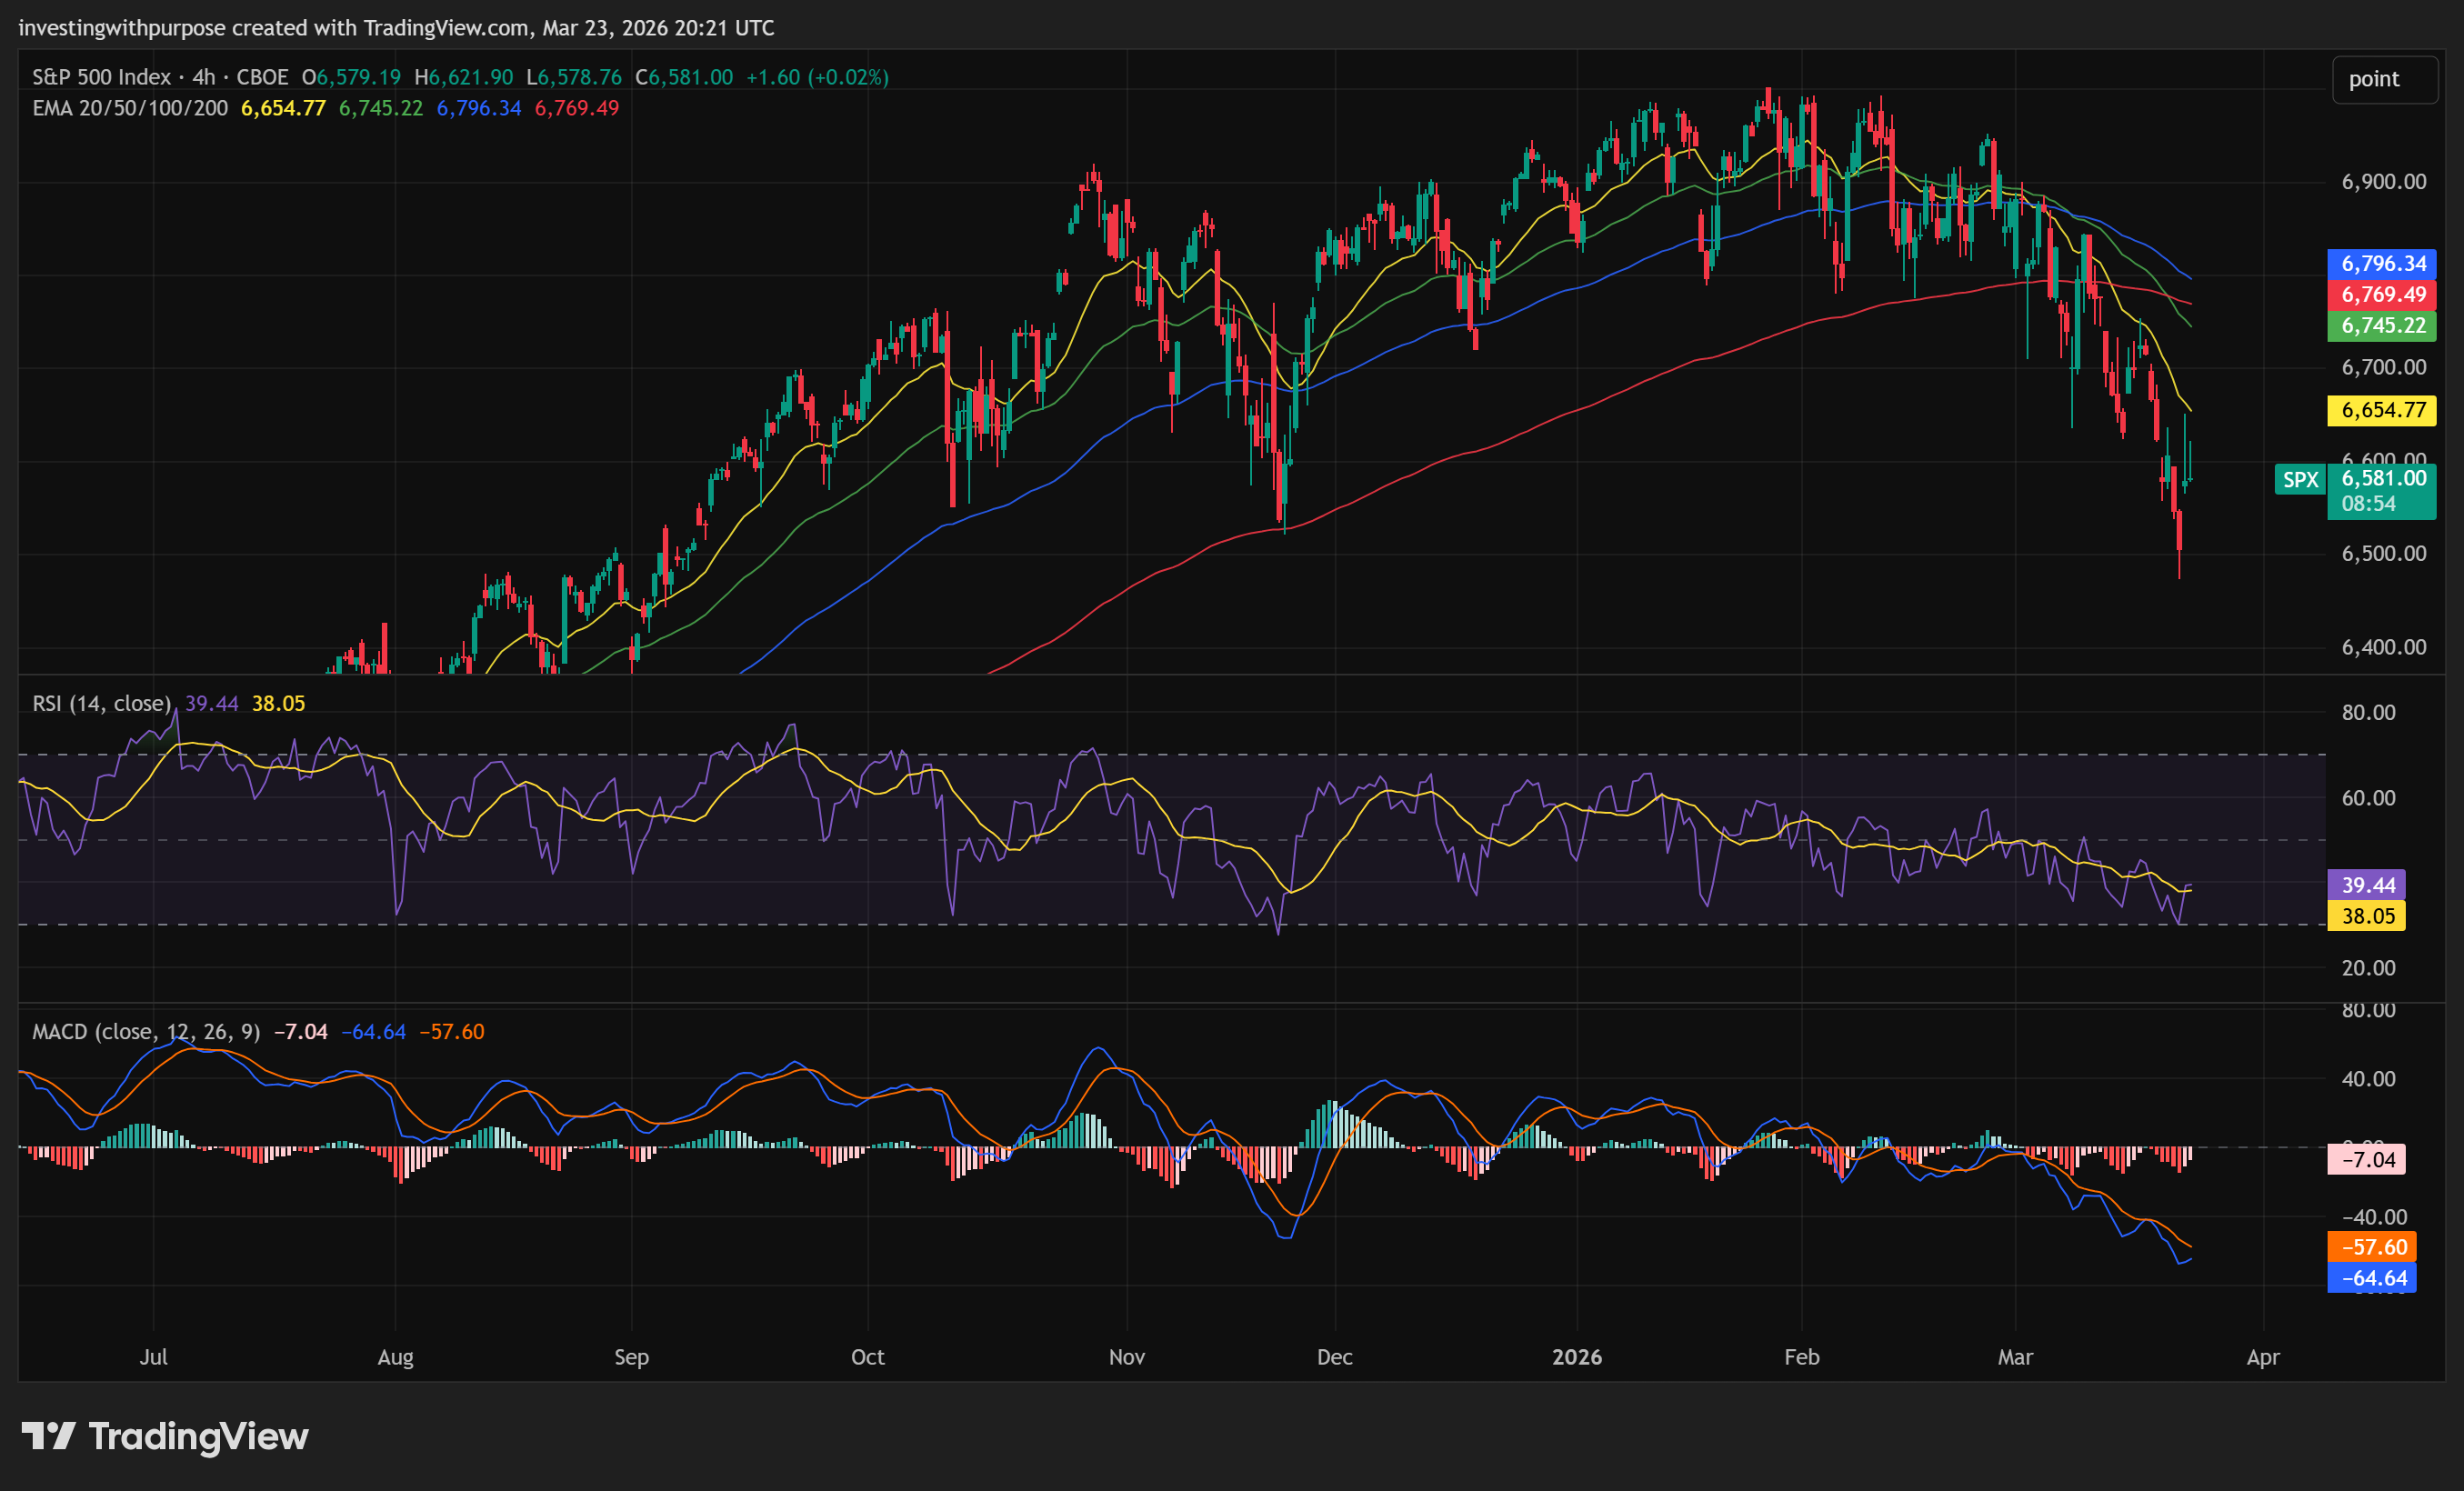
Momentum remains cautious here too. Daily RSI at 40.17 is weak. Daily MACD is still negative. Daily ADX near 36.01 confirms this has been a real trend move lower, not random noise. Ichimoku remains bearish, with price below the Tenkan at 6,642.34, below the Kijun at 6,713.02, and below the cloud.
The first major support zone is 6,595 to 6,520, followed by 6,490 if that area gives way.
The key resistance zone is 6,640 to 6,740. Above that, the next meaningful improvement zone sits near 6,770 to 6,800.
Technical conclusion: The S&P is holding up better than the Nasdaq, but it has not yet done enough to confirm that the correction is over.
Bottom Line
This is not a market that looks broken.
It is a market that still looks priced for a better macro environment than the one it is getting.
That is the distinction.
After three exceptional years, expectations are still high. Inflation is lower, but not fully gone. Energy can still disrupt the whole disinflation narrative. Supply chains and geopolitics remain part of the story. AI is powerful, but monetization may take longer than investors first assumed. And both major indices still lean heavily on the same leadership group.
That is why 2026 could be the year markets move a lot and go nowhere.
The Nasdaq 100 looks more exposed because it carries higher expectations and greater valuation sensitivity.
The S&P 500 looks steadier, but not immune, because broad index strength still depends more than many investors realize on the same concentrated leadership.
So no, this is not a call for panic (not necessarily).
It is a reminder that the easy money phase looks over. Great companies can stay great while index returns become much harder to earn. That may be the real challenge of 2026.
The market can still rally.
It just has to earn higher prices again.
This article is for informational and educational purposes only and should not be considered investment advice or a recommendation to buy, sell, or hold any security or index. Investing involves risk, including possible loss of principal.