
The Real Winners of the AI Spending Boom
Why ASML, AMAT, and LRCX are rewriting the semiconductor cycle, and how to own them with discipline

You do not need more AI hype. You need to understand how the cash flows and the chart structures line up in the three names that quietly tax every chip that matters: ASML, Applied Materials, and Lam Research.
All three sit in the heart of the wafer fab equipment stack. All three are printing software like margins off heavy equipment. All three are plugged directly into AI, HBM, and leading edge logic.
They are not the same trade.
Right now ASML 0.00%↑ trades around $1,100, AMAT 0.00%↑ around $268, and LRCX 0.00%↑ around $159, all near or above prior highs after a powerful run.
The job here is not to cheerlead. The job is to ask, very plainly:
How good are these businesses really
Where are we in their cycles
At what levels does the risk reward actually make sense for medium to long term capital
Below is a clean breakdown of each name, then an integrated view at the end.
Key Takeaways
ASML
Structural compounder with a near monopoly in EUV
Gross margin north of 50%, operating margin around the mid 30s, net cash balance sheet
Weekly chart in a powerful uptrend, but currently in a pullback inside a larger fifth wave advance
Best setup is buy the pullback into 1,060 to 1,020 rather than chase strength above 1,140
Core long term holding if you want AI logic and memory exposure with the strongest moat in the group
Applied Materials (AMAT)
Broadest platform in the group across deposition, etch, packaging, and services
High 40s gross margin, around 30% operating margin, strong free cash flow and net cash
Trend is strong but extended on the daily and four hour charts
Best risk reward appears on a controlled pullback toward 246 to 238
Good candidate as the diversified WFE and advanced packaging workhorse for long duration portfolios
Lam Research (LRCX)
Etch and deposition leader with high torque into DRAM and HBM
Margins and free cash flow at near peak levels, net cash, heavy buybacks and dividends
Technical picture shows a completed impulse and a likely corrective ABC phase
Patience is key, with the real institutional buy zones lower, around 135 then 125 and possibly 110
Excellent business, but at current levels the trade is “wait for the correction” rather than “buy at any price”
Comparative Snapshot
Three world class businesses. Three very different risk profiles.
ASML
The structural compounder.
It owns the bottleneck technology in advanced chips, which gives it the highest moat, the best visibility, and the cleanest long term story. It’s less cyclical than the others, but you pay a premium for that stability. Pullbacks tend to be shallow and fast because institutions buy every dip.
Strengths: EUV monopoly, high margins, net cash, recurring service revenue.
Risks: Export rules, customer concentration, timing of next node ramps.
Applied Materials (AMAT)
The diversified workhorse.
AMAT isn’t defined by one product line. It serves foundry, DRAM, HBM, and packaging, and it has a powerful service business that smooths the cycle. This makes it the most balanced way to own WFE and AI capex without taking concentrated risk.
Strengths: Broad product portfolio, strong services, balanced geographic and end-market exposure.
Risks: China restrictions, late stage momentum in the current impulse.
Lam Research (LRCX)
The high torque memory lever.
When HBM and DRAM boom, Lam outperforms. When memory cools, it feels the pain fastest. It’s a phenomenal business with elite margins, but the cycle exposure is real. That’s why entries matter so much more here.
Strengths: Leadership in etch and deposition, huge leverage to HBM and 3D NAND, best operating leverage in the group.
Risks: Memory cyclicality, highest sensitivity to China, valuation stretched at local highs.
How they fit together
ASML gives you structural quality.
AMAT gives you balanced exposure.
LRCX gives you torque.
A portfolio can own all three, but position sizing and entry discipline should match the specific personality of each name.
ASML
The choke point in AI fabrication

ASML is the one name in this group that is truly non optional for leading edge chips. If TSMC, Intel, or Samsung wants to run at the front of the performance curve, they need ASML’s lithography tools at advanced nodes. There is no practical substitute.
That makes ASML less about “will the product work” and more about “what price are you paying for a very rare asset, and where are you entering in the cycle”.
Business, pipeline, and cycle positioning
ASML’s economic engine is simple and powerful:
Lithography tools for advanced logic and memory, dominated by EUV at the cutting edge
A growing installed base that drives service, upgrades, and software revenue
R and D spending in the mid teens as a percentage of sales to stay years ahead of competitors
Recent financials tell the story:
Revenue in the latest quarter in your data around 8.8 billion
Gross margin a bit above 51%
Operating margin around 34%
Net margin close to 28%
That is software like profitability from very complex hardware.
Working capital is noisy, which is exactly what you would expect when you are building and shipping massive tools on multi quarter contracts. Cash flow from operations can lag net income in individual quarters because inventory and receivables rise when tools are staged for customers.
The balance sheet is robust:
Assets around the low 50 billions
Equity in the low 20 billions
Debt just above 3 billion and cash plus short term investments around 6 billion
That leaves ASML in net cash with a very strong current ratio and plenty of room to fund R and D, capacity, and buybacks.
From a business quality point of view, this is near the top of the listed universe: dominant technology, high margins, recurring service revenue, and a conservative balance sheet. The main risks are regulatory and cyclical, not financial.
Fundamental’s short
ASML is a high margin toll collector on advanced chips. Gross margin a little above 50%, operating margin in the mid 30s, net margin in the high 20s, and free cash flow depressed in some quarters only by working capital timing. The company runs with net cash, invests aggressively in R and D, and still returns substantial capital through buybacks and dividends. The core risk is not “does the model work” but “what happens if EUV and DUV demand wobble under export rules or a pause in node ramps while you are paying a premium multiple”.
Multi timeframe technical view
On the weekly chart the trend is clearly up. Price has reclaimed and accelerated above the 20, 50, 100, and 200 week moving averages, which are all rising and positively stacked. Weekly candles have been printing higher highs and higher lows since the mid 2025 pullback.
Momentum is firm:
Weekly RSI around the high 60s, in a strong trend zone but not yet screaming exhaustion
Weekly MACD in a bullish configuration with the line and signal well above zero and still separated
Bollinger Bands on the weekly have started to expand again, which usually means trend ignition rather than quiet mean reversion.
There is a catch. The long-term Elliott count shows ASML in a larger degree fifth wave that has already tagged a key Fibonacci extension in the 1 140 to 1 150 area. That zone produced a reaction, which is exactly what you would expect when a higher degree wave extension is hit.
On the daily chart:
Price remains above rising 20, 50, 100 and 200 day moving averages
RSI has cooled from overbought into the high 50s, a classic “strong but catching its breath” reading
Daily MACD is still above zero, but the histogram has rolled over, indicating decelerating momentum rather than a reversal
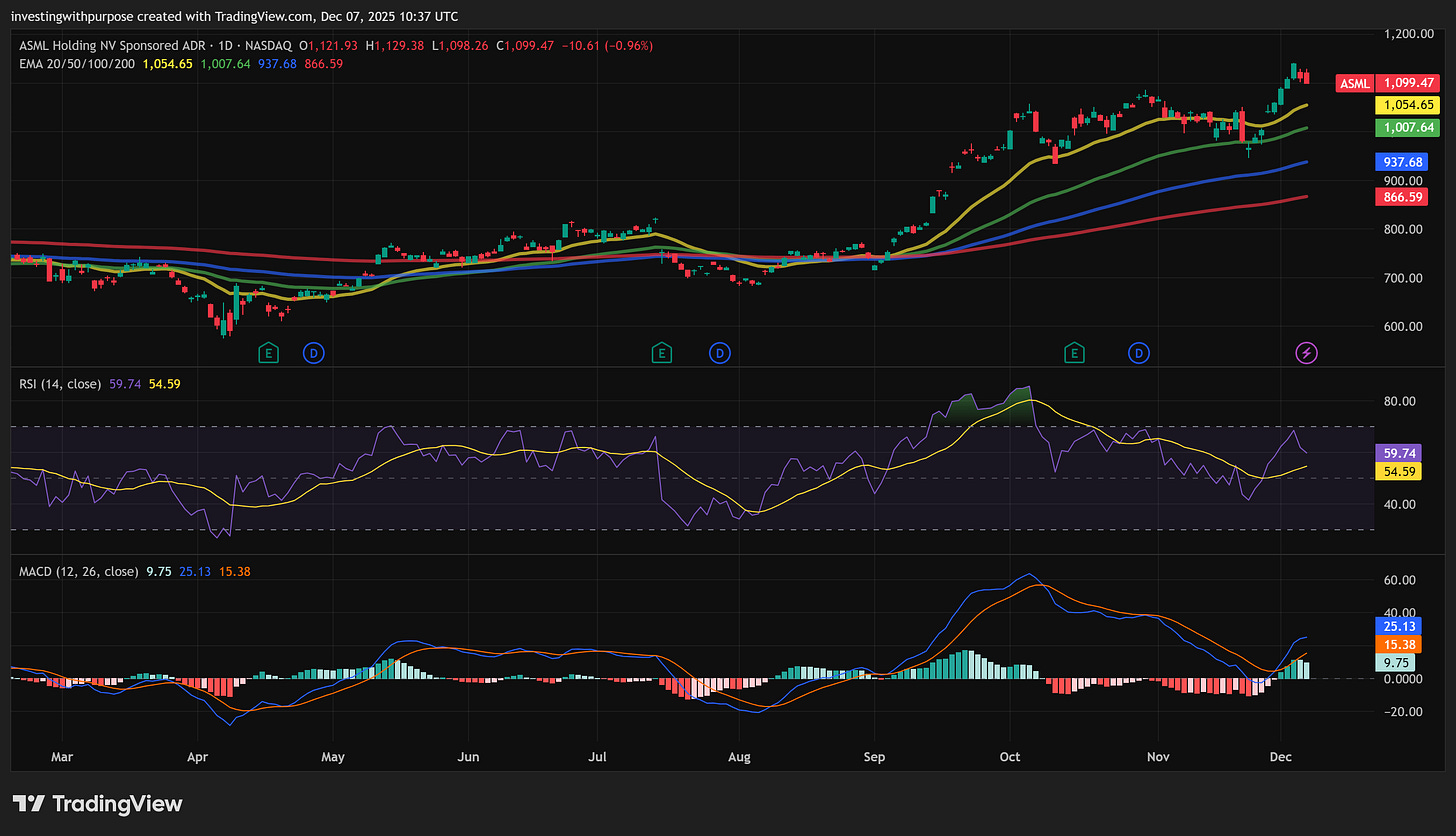

Ichimoku adds a clear structure:
Price is well above the daily cloud, which remains thick and rising
The Kijun line sits around 1 050, which is the first major daily mean reversion level
The top of the cloud in the daily structure sits in the 1 000 to 1 020 region, a major support zone
On the four hour chart, the picture is simple. The stock has pulled back from around 1 140 into the high 1 090s to low 1 100s, with short term moving averages still rising and only a modest loss of momentum. MACD has crossed down on this timeframe, but from above zero, which usually signals a corrective wave within a larger uptrend, not the start of a new downtrend.
From an Elliott perspective, the clean interpretation is:
The move into 1 140 completed a local wave one of the larger fifth wave
The market is now working on a wave two pullback inside that fifth wave
Classical Fibonacci retracements point to 0.382, 0.5, and 0.618 pullbacks into roughly 1 066, 1 043, and 1 020
Those levels line up almost perfectly with the daily Kijun, the top of the daily cloud, and key moving average clusters.
Technical conclusion for ASML
The higher timeframe trend is firmly bullish, but short-term price is extended from its bases and has already reacted from an important extension zone. Everything, from Elliott to Ichimoku to Fibonacci, says the most probable path is a controlled pullback into the 1 060 to 1 020 area before the next leg up.
Simple trade plan for ASML
This is how a medium-to-long-term investor might structure a clean, rules based plan.
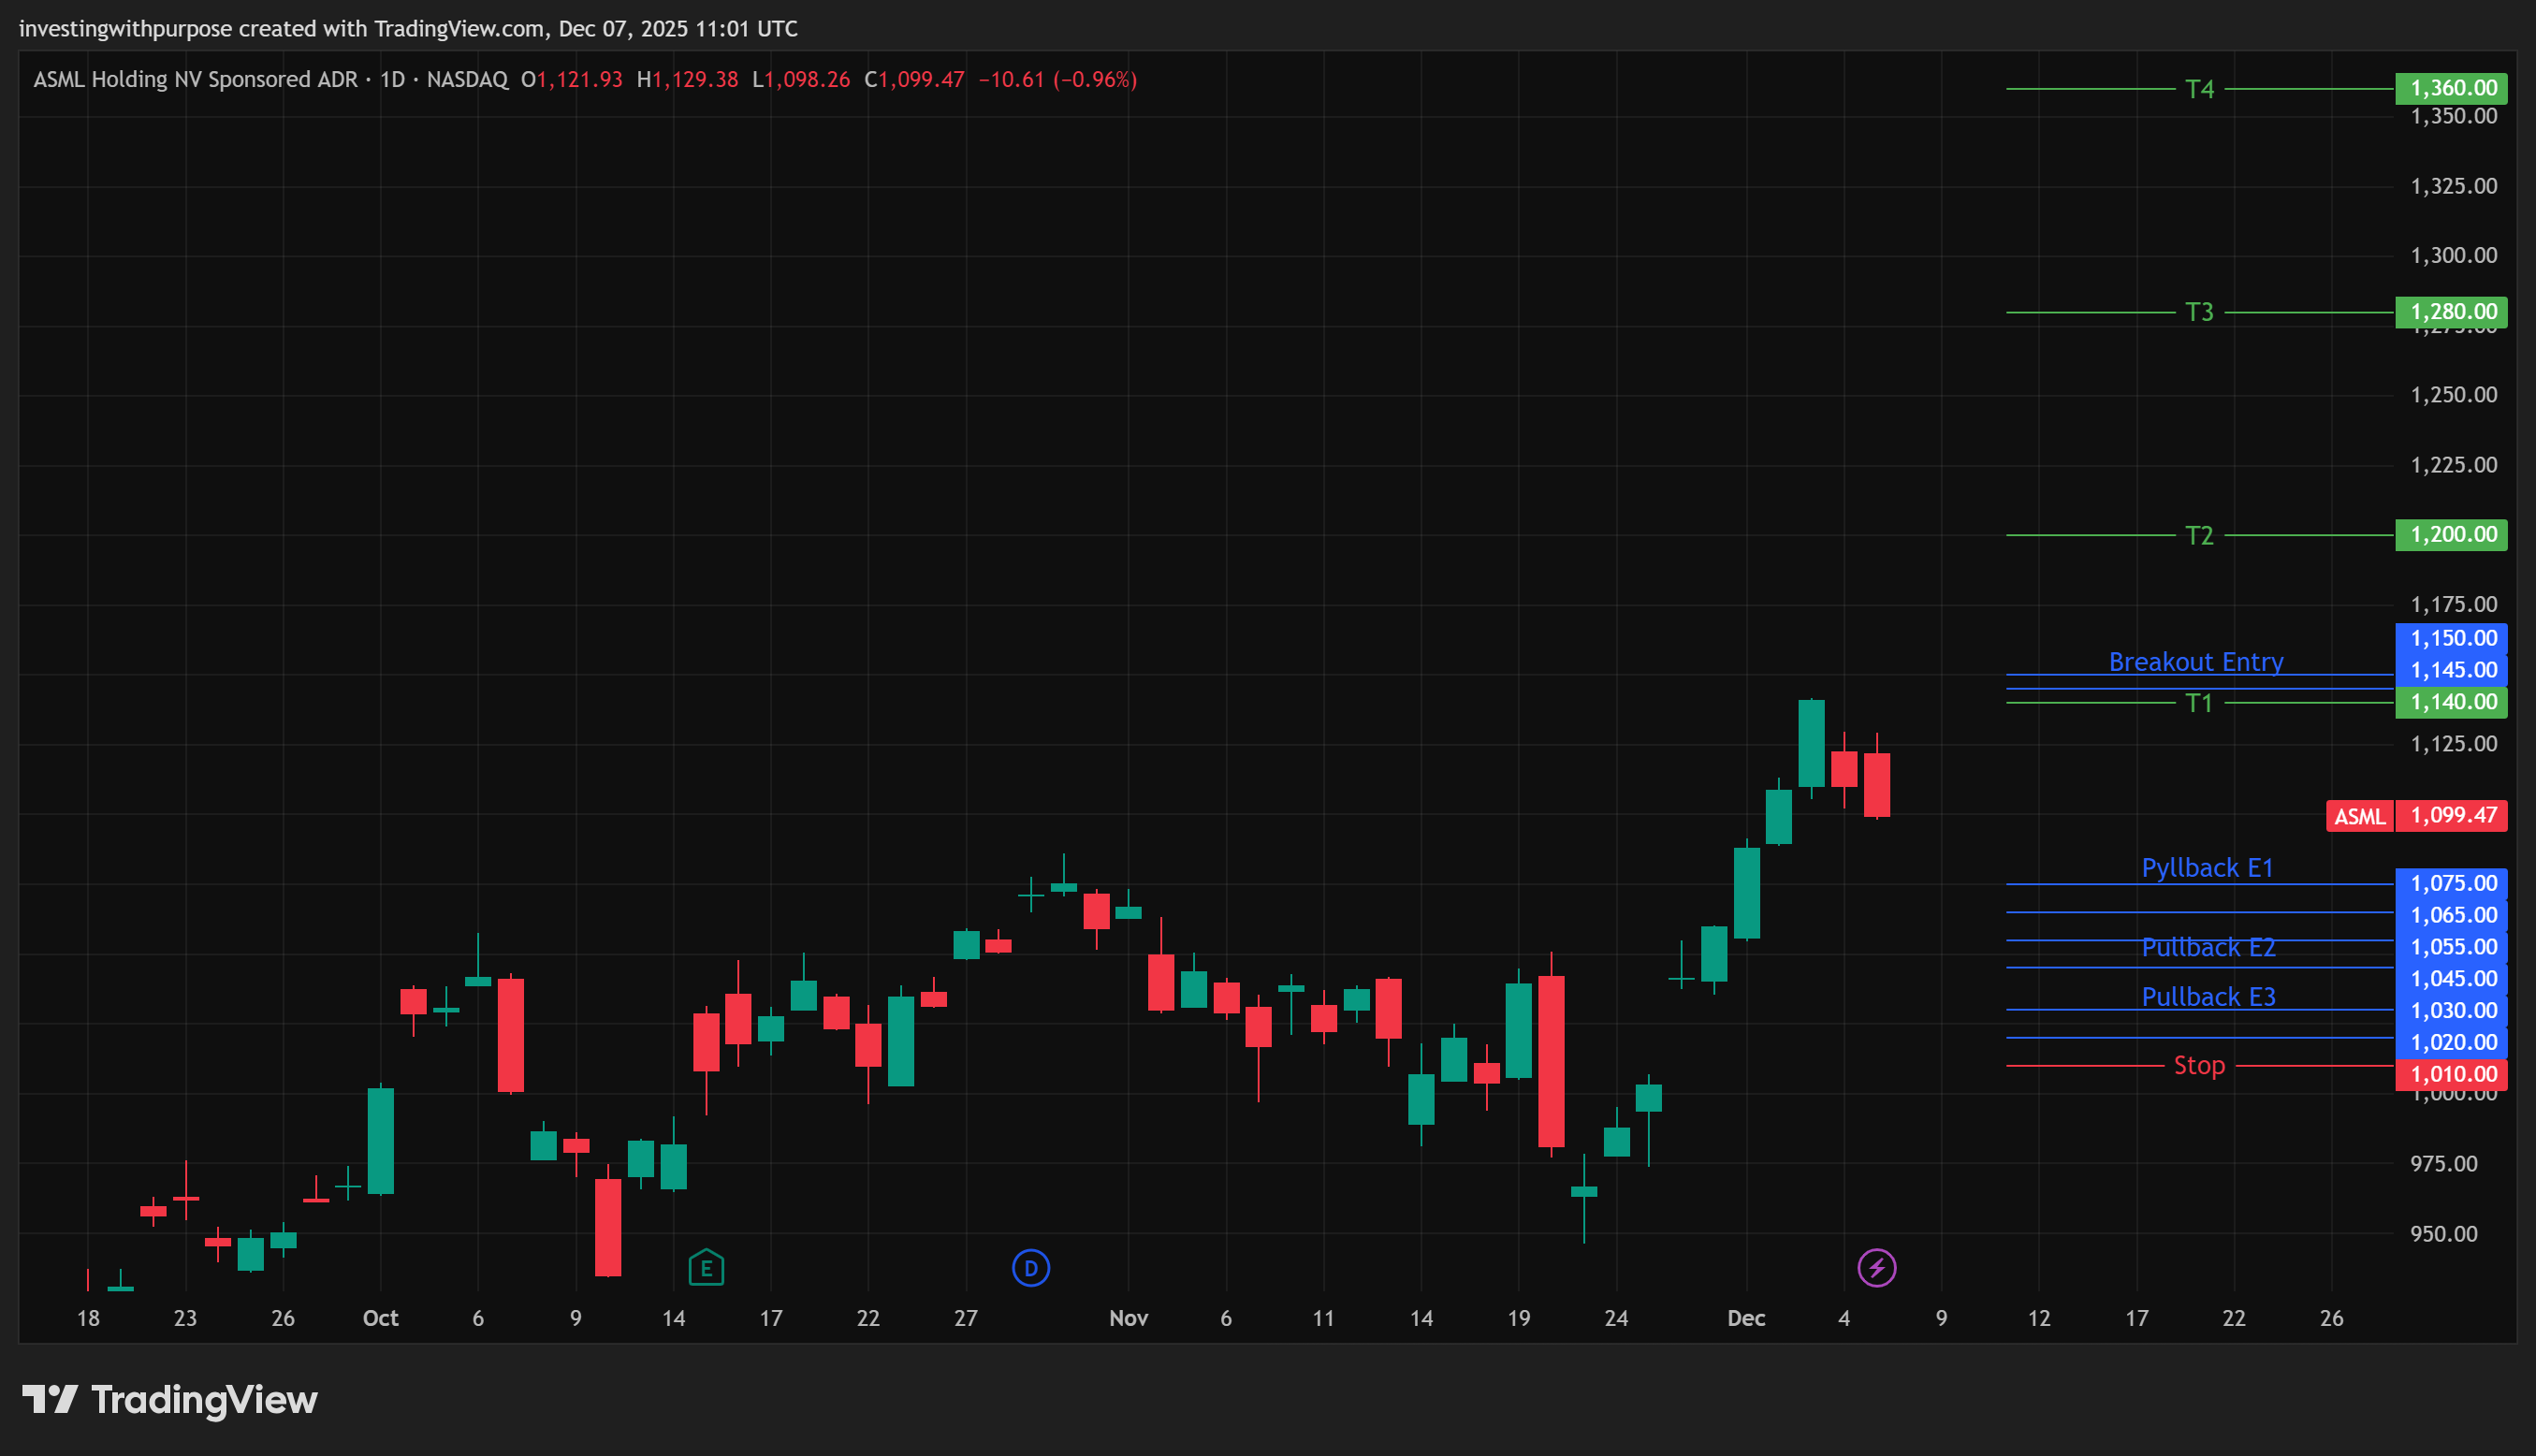
Entries
Zone A: 1,065 to 1,075 First scale in point near the 0.382 retracement of the recent leg and early four-hour support
Zone B: 1,045 to 1,055 Second scale in near the 0.5 retracement and daily Kijun plus EMA cluster
Zone C: 1,020 to 1,030 Final scale in near the 0.618 retracement and top of the daily cloud
Breakout option: daily close above 1,145 to 1,150
Smaller, momentum driven position if price refuses to give you the pullback and breaks the prior high with volume
Protective stop: 1,010 to 1,015
Below the 1,020 support band that aligns with the 0.618 retracement, cloud support, and Elliott wave two structure
Targets
First target: 1,140 to 1,150 Retest of the prior high and first place to take partial profits and lift stops
Second target: 1,185 to 1,200 Standard 1.618 extension of the recent leg, usually where a third wave starts to attract profit taking
Third target: 1,260 to 1,280 Next measured move in the active fifth wave
Fourth target: 1,340 to 1,360 Higher timeframe extension where a deeper consolidation is likely
Stretch band: 1,480 to 1,550 Only in play if AI capex and margins stay at the very high end of expectations
The idea is simple. You buy into weakness within a strong uptrend, you define your risk below the key support band, and you let a series of targets handle the exit rather than trying to call the ultimate top.
Applied Materials (AMAT)
The workhorse of the AI equipment stack
 Stock Drops After Report of US Criminal Probe - Bloomberg")
Applied Materials is not a pure play on any single step like EUV or etch. It is the largest and broadest platform across deposition, etch, CMP, inspection, and advanced packaging, with a large and growing service business tied to its installed base.
If you want diversified exposure to foundry, DRAM, HBM, and packaging rather than a single node or single customer, AMAT is usually the starting point.
Business, catalysts, and sector context
AMAT’s revenue base is split across three main engines:
Semiconductor systems
Applied Global Services
Display and adjacent markets
Semi systems is where the cycle lives. Services are where the durability and recurring cash flows come from.
Recent numbers:
Full year revenue around 28.4 billion
Gross margin close to 49%
Operating margin around 30%
Net margin around 25%
Free cash flow margin around 20%
Cash from operations is strong and very close to net income. Capex is modest for a business of this scale, in the single digit percentage of revenue, which leaves a lot of room for capital returns.
The balance sheet is solid:
Cash and short term investments comfortably above total debt
Net cash a little over 2 billion
Current ratio around 1.8
Capital allocation is straightforward. The company uses its strong free cash flow to:
Fund R and D and modest capex
Pay a growing dividend
Run large and fairly consistent buybacks
Strategically, AMAT is leaning directly into:
Advanced logic nodes for AI and high performance computing
DRAM and HBM capacity for data centers
Advanced packaging technologies like hybrid bonding
That mix gives it leverage to the AI build out without being only about memory or only about one step in the process.
Fundamental conclusion for AMAT
AMAT is a high quality, high margin cyclical with diversified exposure. It does not have ASML’s monopoly, but it compensates with breadth and a large service annuity. Margins are near the top of the company’s historical range. The balance sheet is clean, and capital returns are substantial. The fundamental risk is about cycle timing and China regulation, not solvency or business quality.
Technical setup
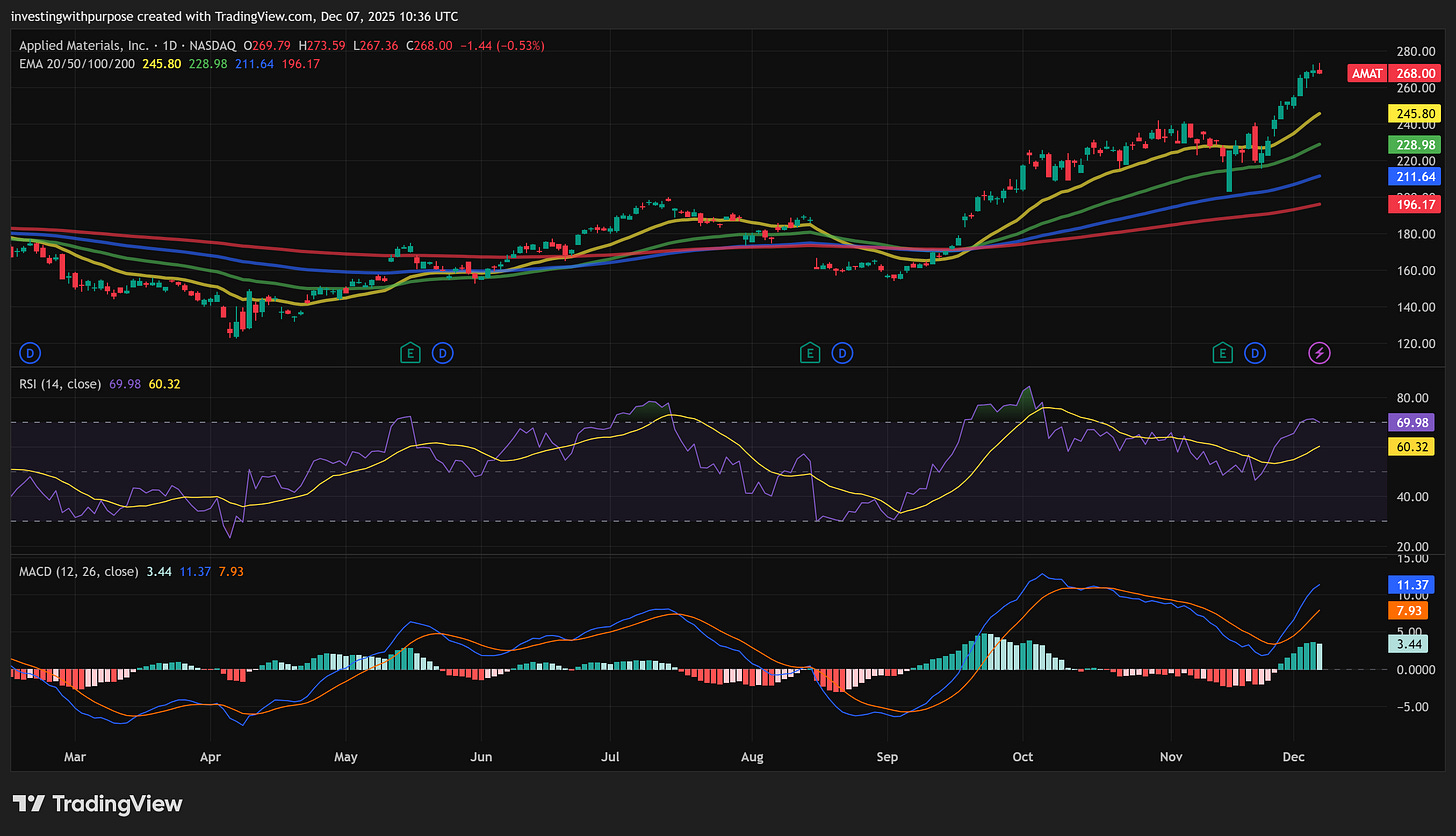
On the weekly timeframe, AMAT is in a very strong uptrend. Price has moved from the 160 area up toward the high 260s, forming a textbook impulsive leg.
Indicators on the weekly:
RSI in the mid 70s, firmly in the strong trend zone
MACD strongly positive, with a wide gap between line and signal
Rising ADX, confirming a strong trend
This is trend strength, not yet a topping pattern, but also not an early entry.
On the daily chart:
Price sits well above the 20 day moving average, which itself is above the 50, 100, and 200 day lines
The distance from price to the daily moving averages is stretched, a sign of late stage impulse
Daily RSI is near 70, elevated but without major divergence
Daily MACD is positive, but the histogram is flattening, which usually signals slowing momentum

Ichimoku on the daily shows:
Price far above both Tenkan and Kijun lines
Tenkan near 248, Kijun near 238
Thick, rising cloud below price, with the lagging span above both price and cloud
That structure says “fully bullish” but “overextended.” A regression toward Tenkan and Kijun, or even toward the top of the cloud, is statistically likely before the next push.
Four hour charts show early signs of exhaustion:
Candle bodies shrinking with longer upper wicks
RSI in the mid 70s with emerging negative divergence
MACD histogram declining despite higher prices
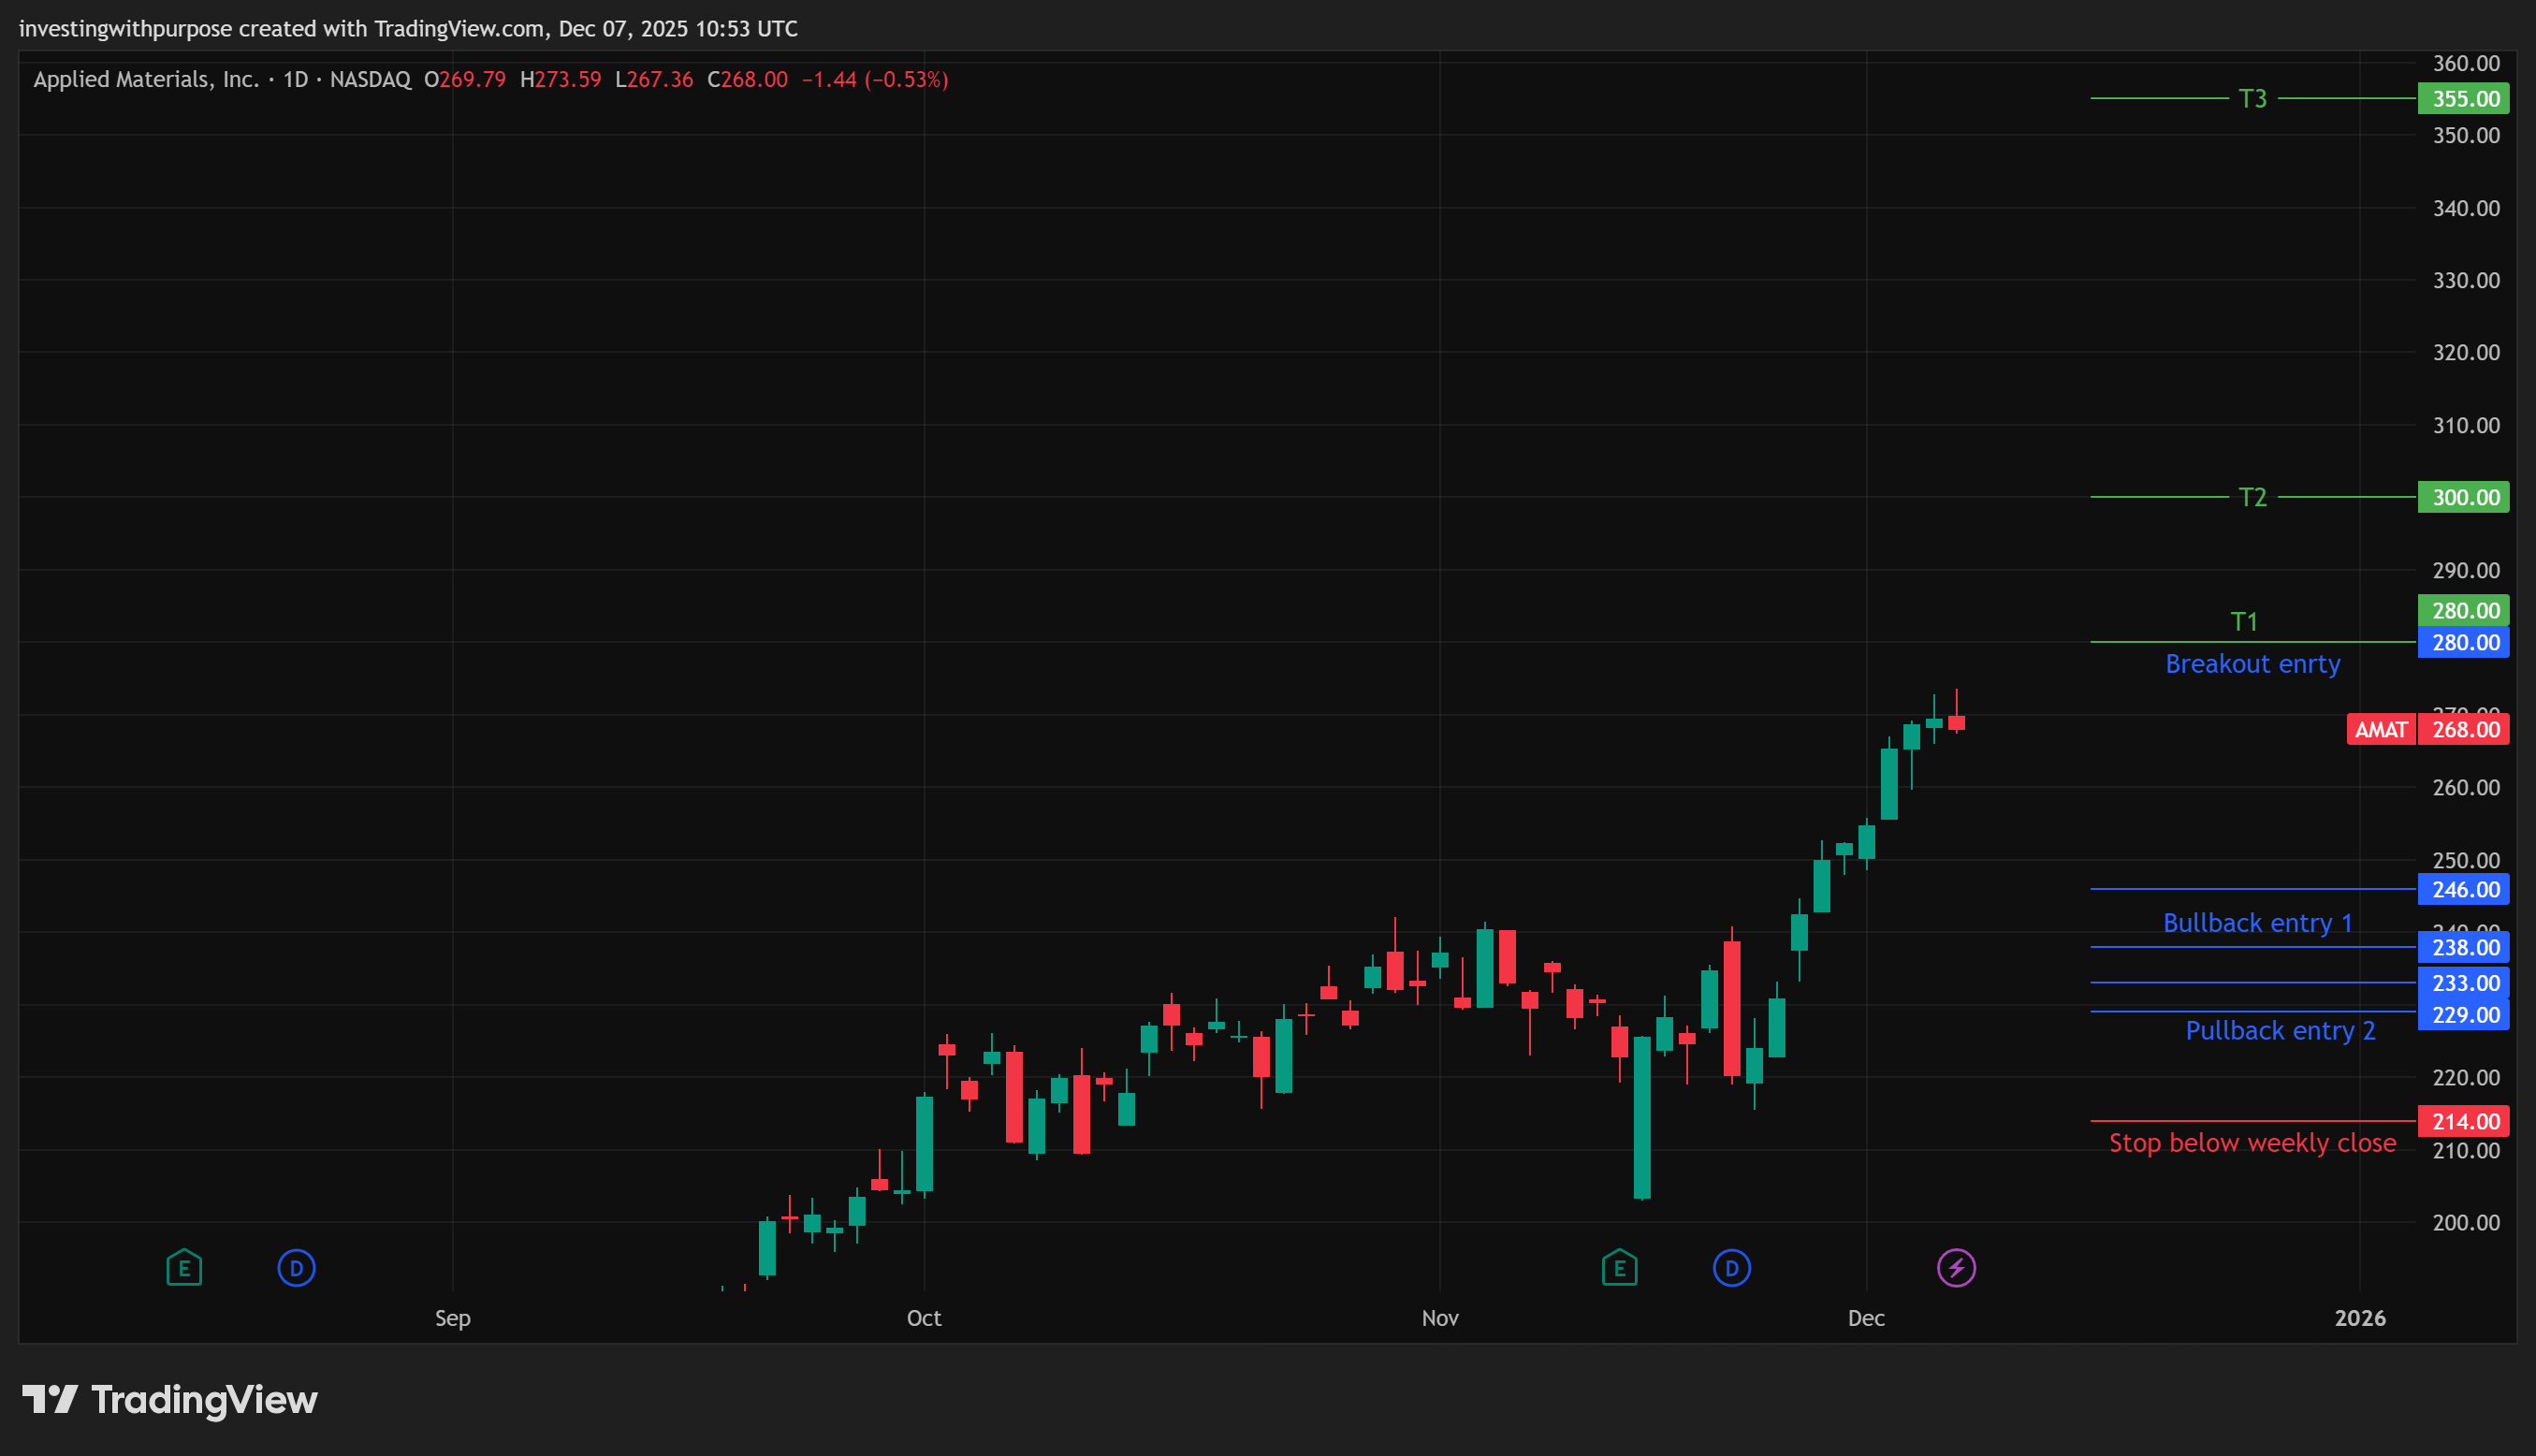
Fibonacci retracements of the recent advance point directly to a mean reversion zone between 246 and 238, then down toward 230.
Technical conclusion for AMAT
AMAT is in a mature impulse within a strong weekly uptrend. The structure favors a pullback or sideways consolidation rather than an immediate further acceleration. The most attractive levels for medium term capital sit below spot, not at it.
Simple trade plan for AMAT
Think of AMAT as a “buy the pullback in a leader” setup rather than a breakout chase.
Entries
Pullback zone 1: 246 to 238
First buy region that lines up with a 0.382 to 0.5 Fibonacci retracement of the recent swing, daily Tenkan and Kijun, and the main moving average clusterPullback zone 2: 233 to 229
Second buy region at the deeper 0.618 retracement and prior consolidationBreakout option: daily close above 280 with follow through
Smaller trend following add if price consolidates and then decisively clears the 1.618 extension and prior resistance
Protective stop: 214 to 215
Below the key structural support shelf; a weekly close below this region would damage the current uptrend and suggests a larger corrective phase
Targets
First target: 276 to 280 Revisit of the extension area and first logical profit taking zone
Second target: 300 to 305 Psychological level and next extension band
Third target: 320 to 322 Higher extension of the current impulse, where risk reward starts to compress
Fourth target: 355 to 360 Long term target for the current cycle, assuming AI and WFE trends stay supportive
The core principle is, again, straightforward. Let the market come back to you. Put on size where the technicals, fundamentals, and risk reward line up, not at peak extensions.
Lam Research (LRCX)
High torque memory exposure that demands patience

Lam is not the broadest name, but it may be the most sensitive in this group to the AI memory story. Its tools sit at the heart of etch and deposition in 3D NAND and DRAM, and its services business is tied to that installed base.
When AI data centers are starved for HBM and DRAM, Lam feels it fast. When the cycle turns down, it feels that fast as well.
Business model and cycle position
Lam’s revenue is split between:
Systems
Customer support and business group (services, upgrades, spares)
Services make up roughly a third of revenue and carry high margins, which helps stabilize cash flow. The rest is classic WFE, heavily skewed to memory and, increasingly, HBM related flows.
Recent financials:
Trailing twelve month revenue around 19.6 billion
Gross margin around 50%
Operating margin around 33%
Net margin just below 30%
Free cash flow margin close to 28%
Cash conversion is excellent, with free cash flow nearly matching net income. Capex is low relative to revenue. The balance sheet runs with net cash, current ratio comfortably above two, and no near-term debt pressure.
Lam’s capital allocation is shareholder friendly and aggressive:
Dividend paid from robust cash flow
Large and consistent buybacks, with a clear policy to return a high share of free cash flow over time
Strategically, Lam is pressing its advantage in:
3D NAND staircase etch and deposition
DRAM and HBM processing
Advanced packaging and back-end steps that benefit from the same AI trends
This is exactly the kind of business you want to own in a powerful memory upcycle. It is also the kind of business you do not want to chase at any price when margins and multiples are both at the high end.
Fundamental conclusion for LRCX
Lam is a superb franchise with elite margins and free cash flow. The model is structurally sound, and the balance sheet is strong. The main fundamental risks are the depth and length of future memory downturns and regulatory constraints on China, where Lam has meaningful exposure. At current valuation levels, the business is being treated by the market as a premium structural winner, not as a cyclical bargain.
Technical setup
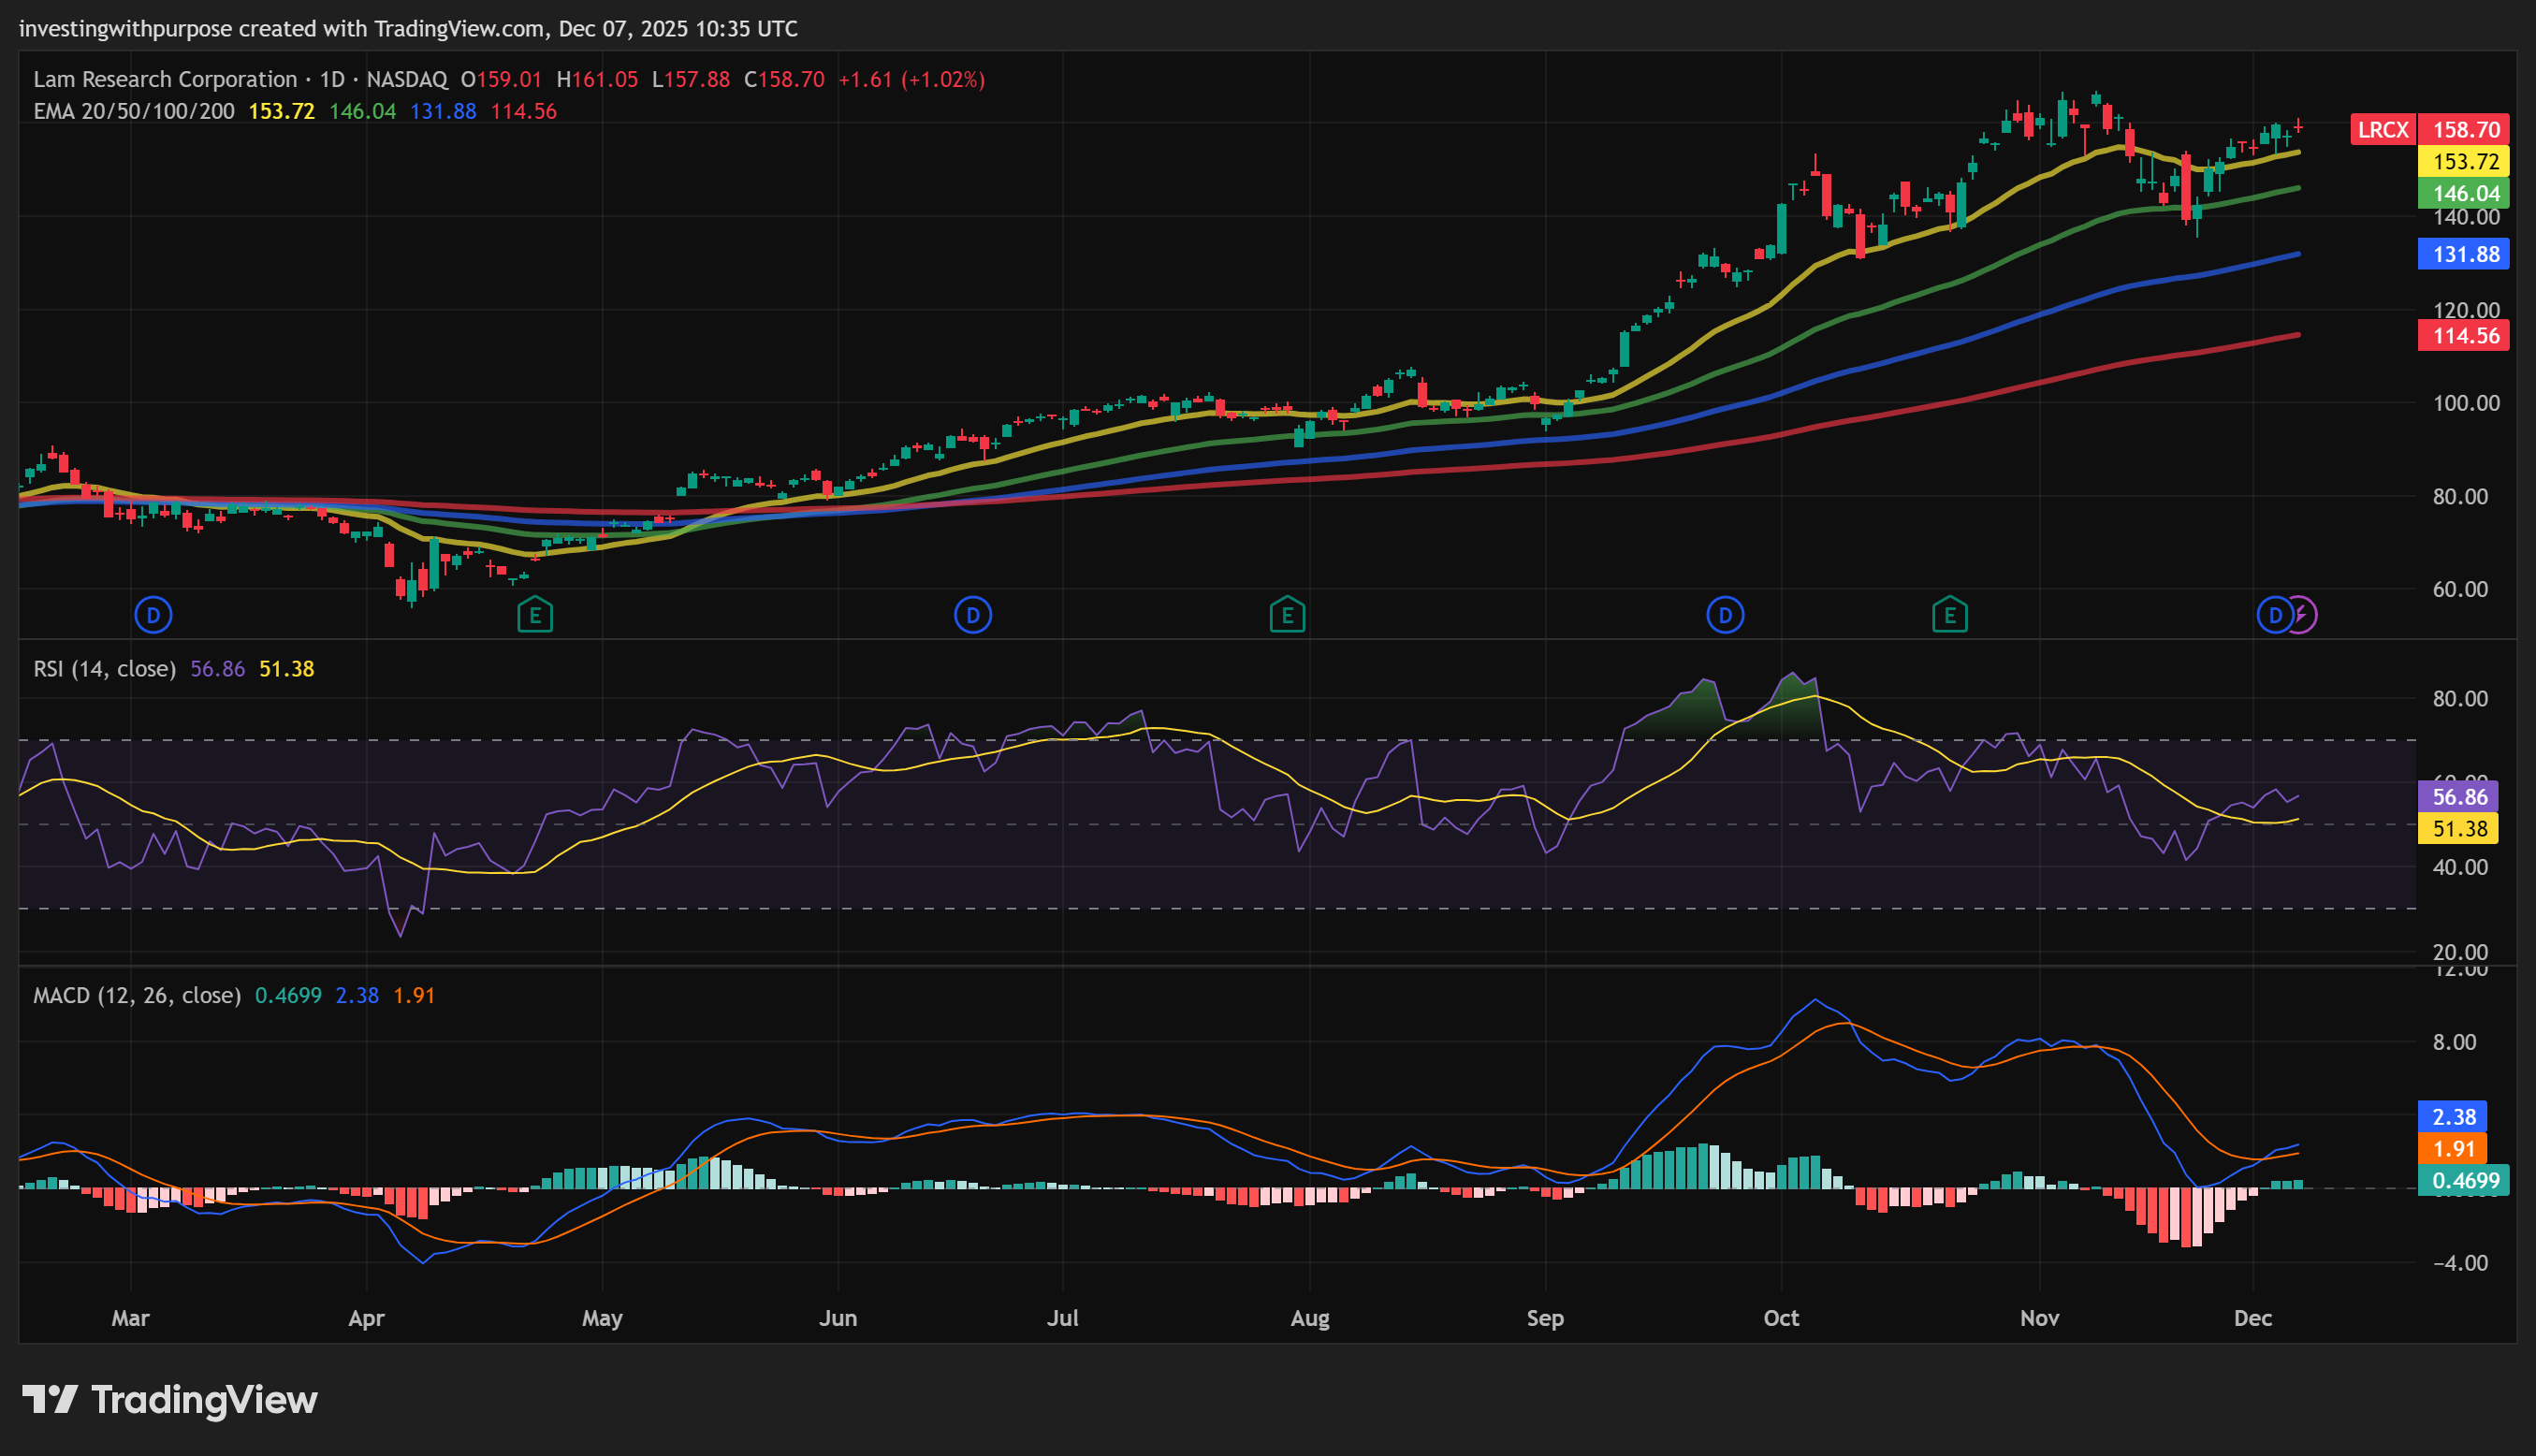
The weekly chart shows a clear five wave advance from mid-2024 into the recent highs in the mid-160s. That pattern is confirmed by:
Weekly RSI pushing into the low 70s, then rolling over
Weekly MACD strong but starting to lose slope
Weekly Bollinger Bands expanding, followed by stalling candles with upper wicks
Moving averages on the weekly:
20-week EMA near 132
50-week EMA near 110
100-week EMA near 95
200-week EMA near 78
All are rising, which confirms the bull regime, but price is extended above these “home bases,” which is a classic sign of a trend near a consolidation or corrective phase.
On the daily chart, the Elliott structure suggests:
A completed local fifth wave high around 166
A pullback into a wave a
A current rally that fits best as a wave b retracement, not a new impulse
Momentum:
Daily RSI has shifted from trend regime above 60 into the 50 to 60 range, which is typical for a corrective environment
Daily MACD has turned back up but is doing so from below its local peak, with a shallow histogram, which is again more consistent with a countertrend bounce than the start of something new

Ichimoku on daily:
Price sits just above the cloud and Kijun, which cluster around the low 150s
Kijun is flat, which tends to act as a magnet
The future cloud is thinning, which is usually a warning of a weakening trend
On four-hour charts, price action is choppy with:
RSI oscillating without strong trend
MACD shallow
Bollinger Bands narrowing
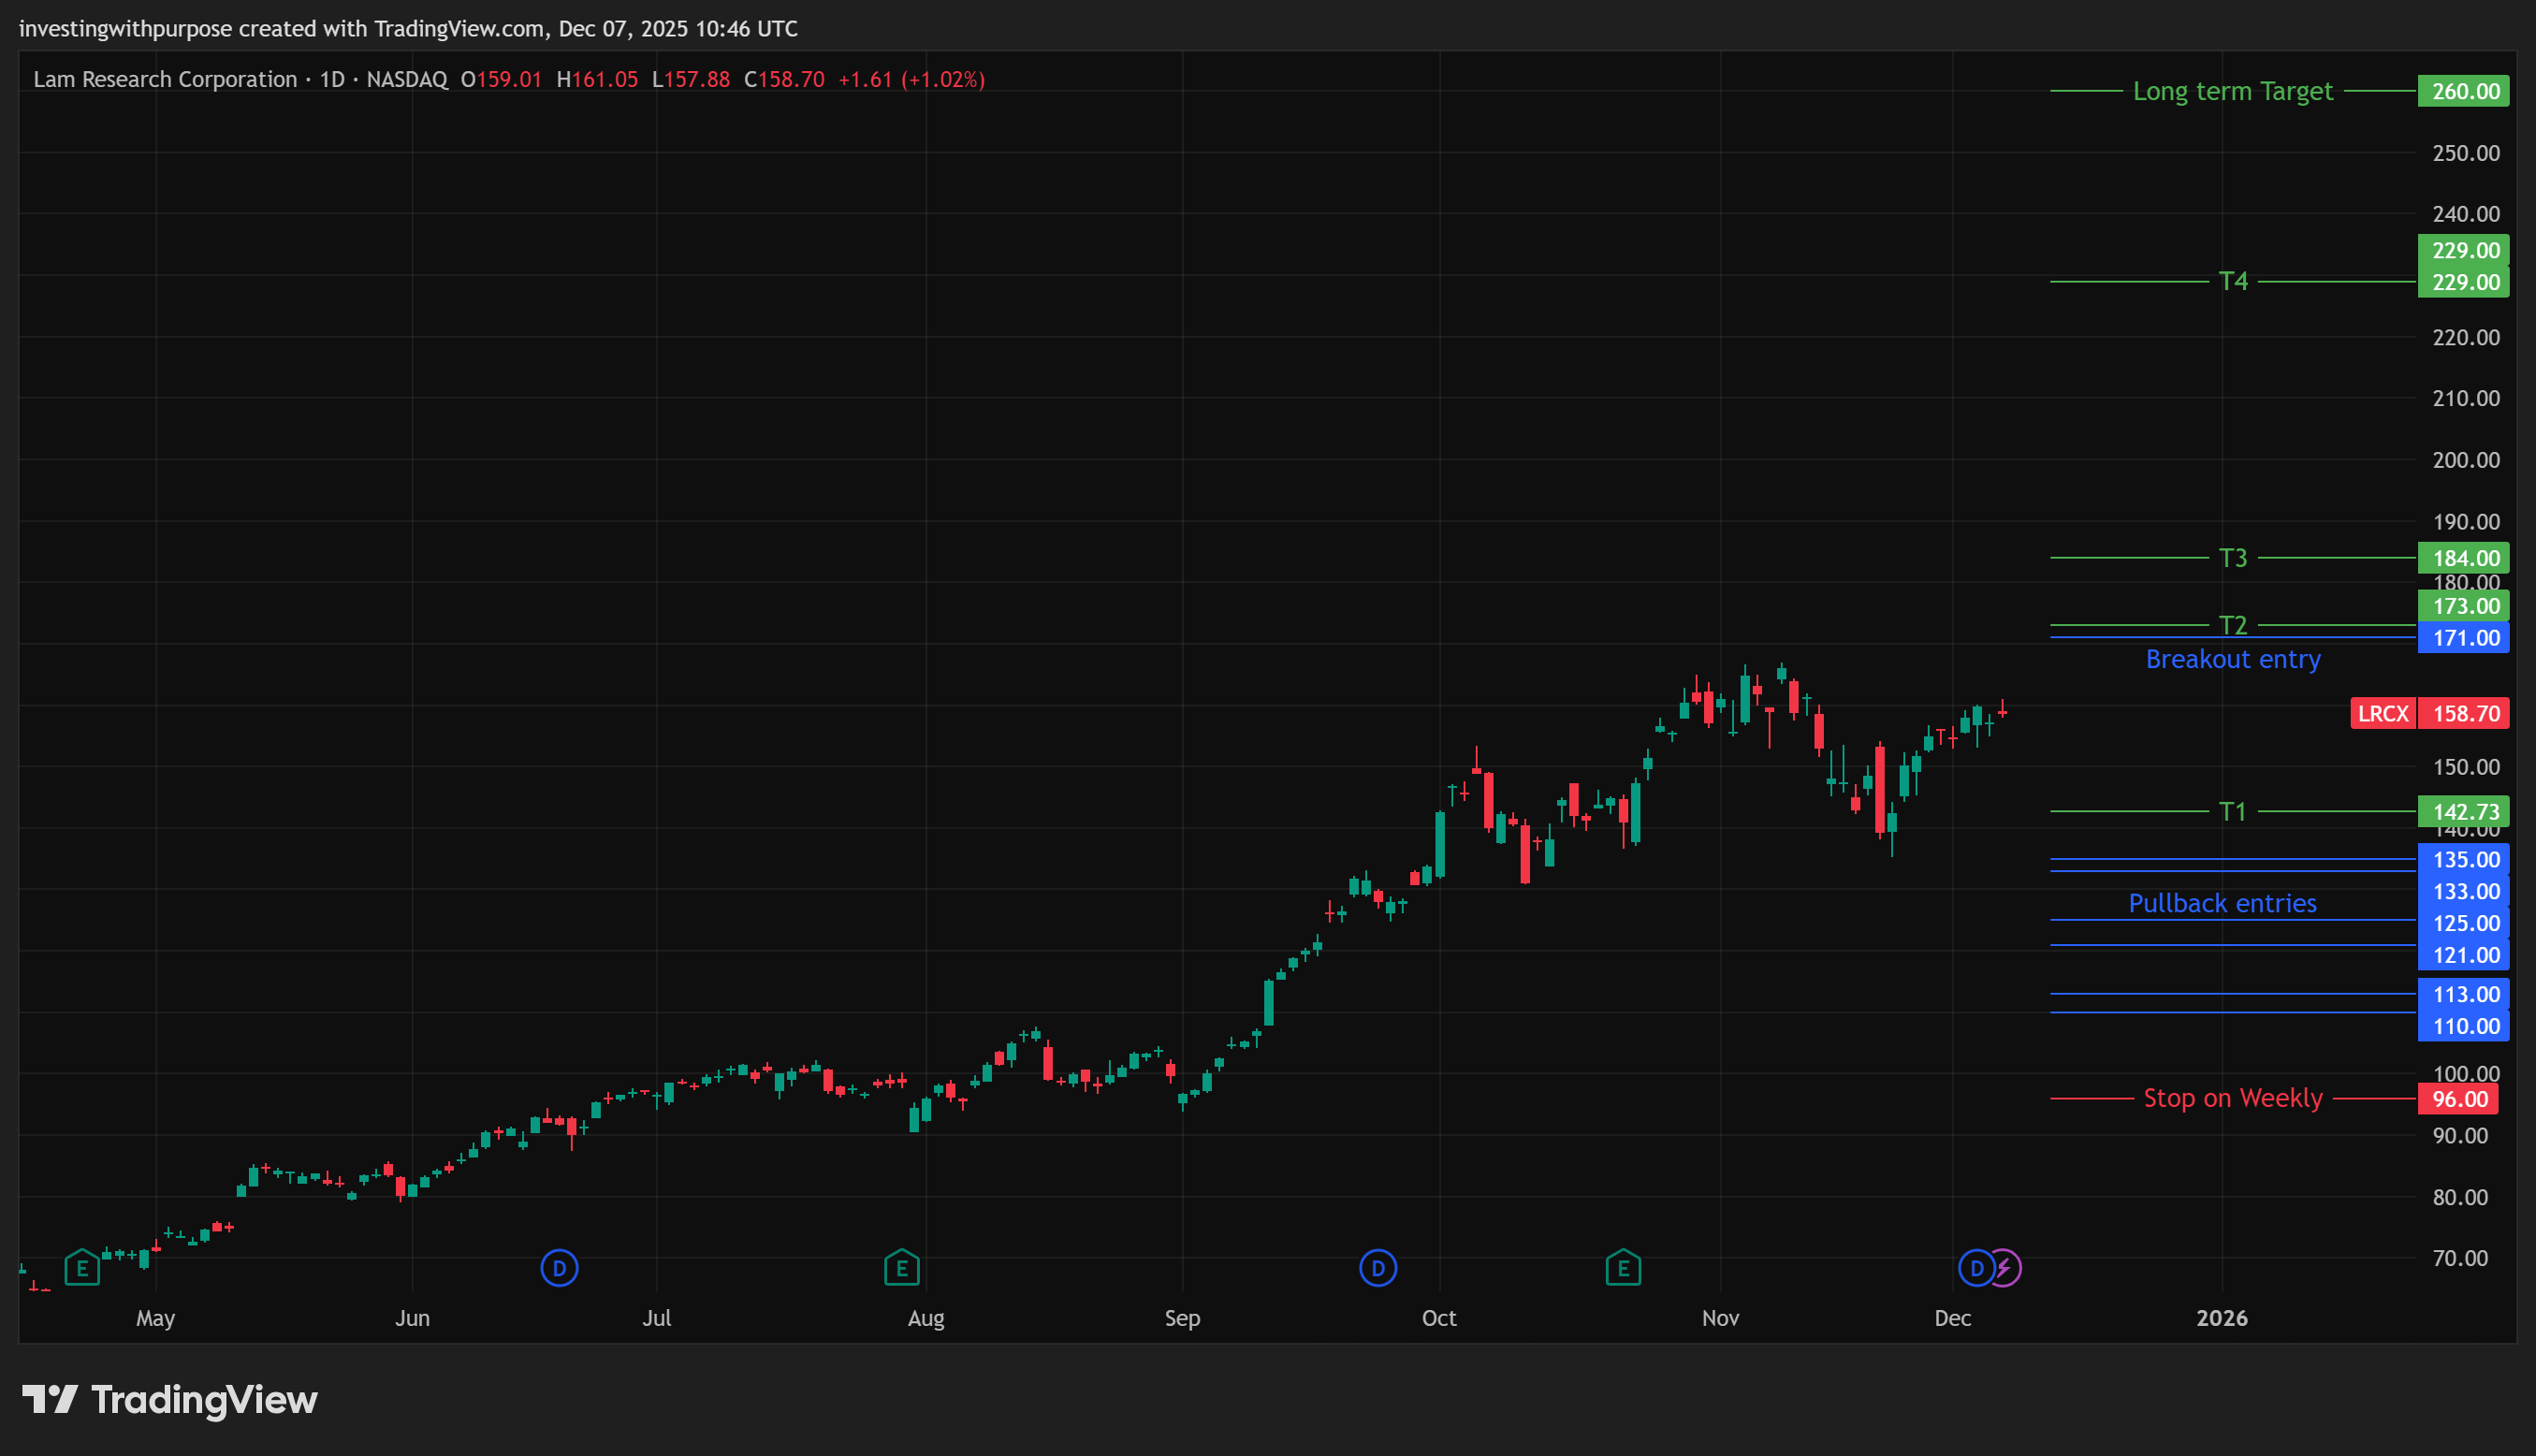
Fib retracements and extensions across weekly, daily, and four-hour charts keep pointing to the same downside zones:
First band: 135 to 130 - 0.382 retracement of the main swing and early ABC target
Second band: 125 to 121 - 0.5 retracement and stronger demand shelf
Third band: 113 to 110 - 0.618 retracement and 1.618 extension level for the C wave on the four-hour structure, plus proximity to the weekly 50 period average
Technical conclusion for LRCX
The long term trend is still up, but the impulse looks mature and the weight of evidence points to a multi week to multi month corrective phase rather than a fresh extension. The current bounce is more likely a wave b within that correction. That makes this a “wait for better levels” chart, not a “buy it here and hope” chart.
Simple trade plan for LRCX
If you think of Lam as a high-quality cyclical, the trade plan is about insisting on being paid for taking that cyclicality.
Entries
Entry band A: 135 to 133 Initial scale in at the first major retracement and support cluster
Entry band B: 125 to 121 Second scale in at the 0.5 retracement region and prior demand
Entry band C: 113 to 110 Final scale in at the 0.618 retracement and 1.618 C wave extension area
Breakout option: daily close above 171 with confirmation
Smaller momentum style entry only if price invalidates the corrective count with strength and volume
Protective stop: 96 on a weekly close basis
Below the deeper 0.618 weekly retracement and key structural higher low from the 2024 base
Targets
First target: 166
Retest of the prior high and first point to take partial profits and lift stopsSecond target: 171 to 173
Slight extension above the peak, which often marks the end of a corrective recoveryThird target: 183 to 185 Next extension band, good place to reassess risk reward
Fourth target: 200 Round number and higher extension where the market may start to price another cycle peak
Longer term bands: 229 to 235 then 260 to 270 Higher degree extensions suited for investors who are willing to ride a full cycle and manage with trailing stops
For Lam, the discipline is simple. Do not chase the late-stage part of the impulse. Let price come back toward the 130s, 120s, or even 110s. If it does, you are getting much better compensation for taking on a business that will always be tied to the memory cycle.
Bottom Line
These three names are not interchangeable AI exposure.
ASML is the structural monopolist. You buy it when the chart gives you a pullback inside a clear uptrend and you are willing to hold through noise in working capital and export headlines. The trade is “own the choke point,” not “time every quarterly wiggle.”
AMAT is the diversified workhorse. You buy it when the impulse cools down, price reconnects with the 240s area, and the risk reward against the low 210s makes sense. It is a very reasonable core holding for investors who want broad AI capex exposure with strong free cash flow and balanced risk.
LRCX is the high torque memory lever. You get paid more here when the market panics about DRAM or China and sends price toward the 130s, 120s, or 110s. Until then, patience is a position.
Across all three, the common thread is this:
The businesses are excellent. The balance sheets are strong. The key edge is not finding the “right” story. It is having the discipline to only act when the technical structure and the fundamental picture combine to give you asymmetric risk reward, with very clear numbers for where you are wrong.
You do not control the cycle. You do control what you pay, and where you place your stops.
This content is for educational purposes only and isn’t investment advice or a recommendation to buy or sell any security.