


If you spent last week watching your account you’d be forgiven for thinking something had broken. Alphabet fell 12.6% across the 5 sessions. Robinhood fell 10.6%. Boeing fell 8.9%. Friday closed with the S&P 500 down 1.8% on the heaviest volume of the month.

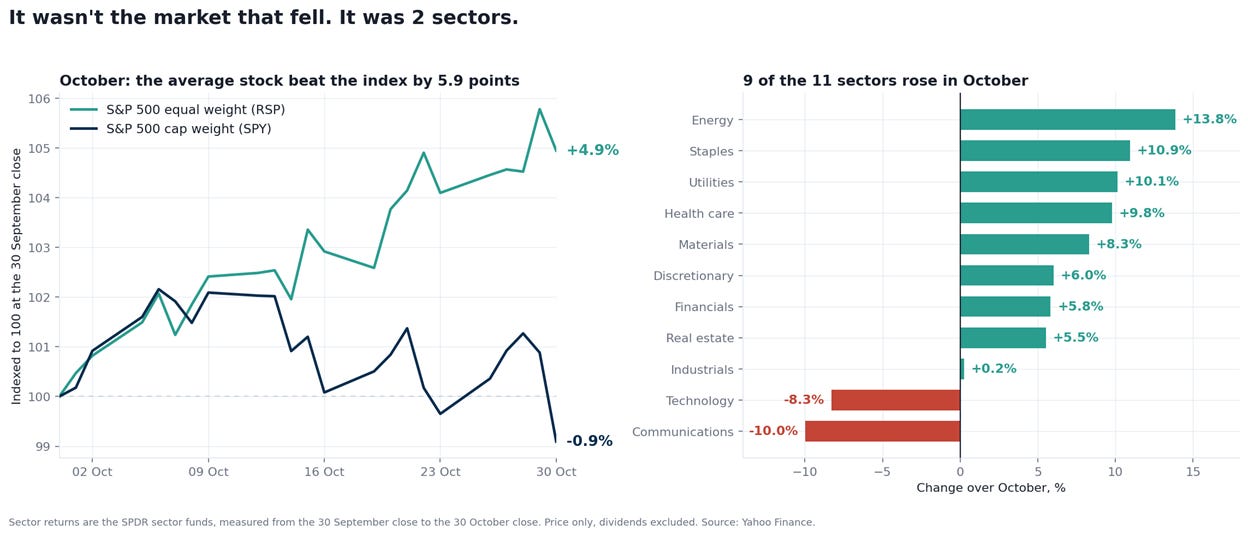
The other version: the SPDR S&P 500 fund (SPY) finished the week down 0.56% and October down 0.91%, while the equal-weighted S&P fund (RSP) rose 0.82% and 4.95%. An equal-weighted fund holds every member in the same size and rebalances back to equal periodically, which gives a broader view of how constituents participated, though it isn’t a direct measure of the median stock. 9 of the 11 SPDR sector funds were higher on both counts.
Both pictures are accurate. The gap between them is what October was actually about.
Participation Held. The Theme Didn’t.
Technology fell 8.3% in October and communication services 10.0%. Everything else rose: energy 13.9%, staples 10.9%, utilities 10.1%, health care 9.8%.
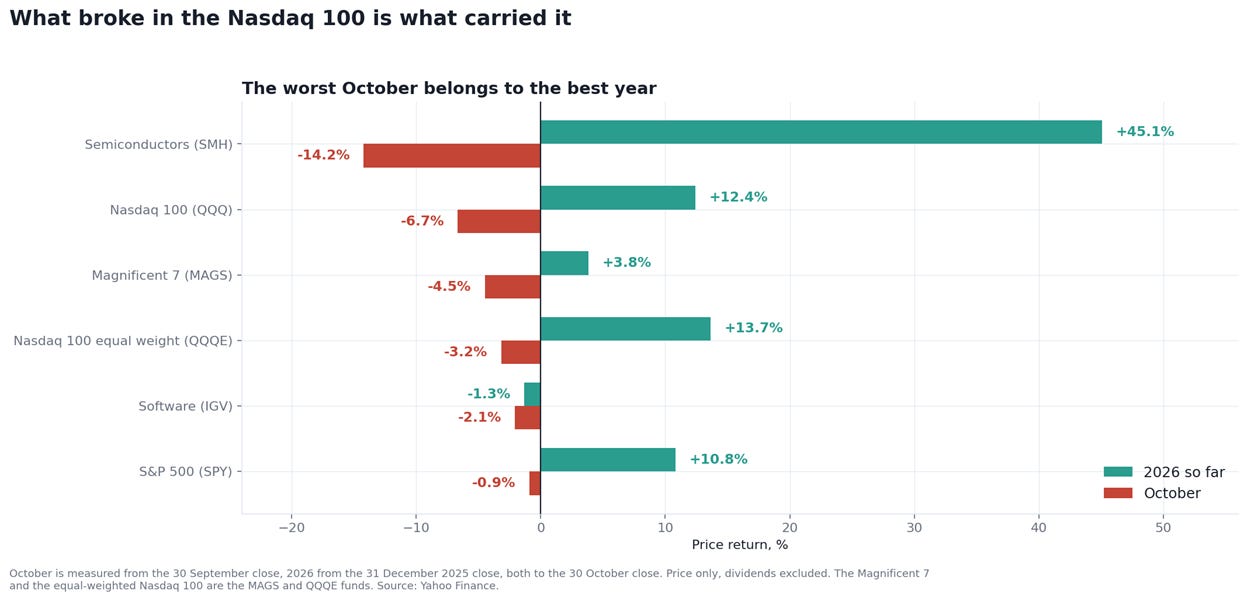
The same split runs through the Nasdaq. QQQ fell 6.66% in October while the equal-weighted QQQE fell 3.18%. The VanEck semiconductor fund fell 14.2%, the Roundhill Magnificent 7 fund 4.48% and the iShares software fund 2.1%.
Zoom out and the year reorders them. The semiconductor fund is up 45.1% in 2026, QQQE 13.7%, QQQ 12.4%, the Magnificent 7 fund 3.8%, software down 1.3%. Semiconductors were among the strongest performers of the year, and October marked that trade down hardest.
This is the first useful conclusion. Broad participation and severe losses in a concentrated portfolio can happen in the same month. An investor in the equal-weighted index had a good October. A portfolio concentrated in the AI and semiconductor exposures above had a bad one. Neither experience describes “the market.”
What Changed, And What Didn’t
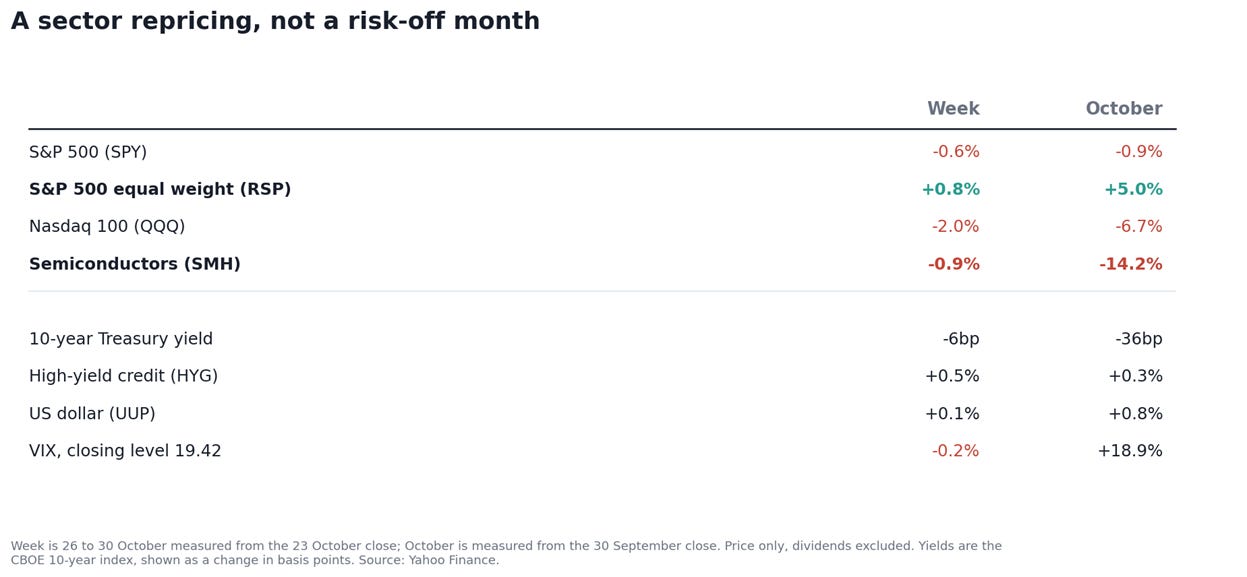
Rising nominal yields can’t account for this: the 10-year Treasury yield fell 36 basis points over October, to 4.93%. Real yields, earlier rate moves, risk premiums and earnings expectations can all still matter, but the simplest rate story is unavailable.
Credit is more interesting than the bond funds suggest. High-yield and investment-grade funds both rose last month, yet positive bond returns concealed modestly wider credit spreads. An option-adjusted spread is the extra yield a bond pays over comparable Treasuries once embedded options are stripped out. The ICE BofA US high-yield measure went from 3.12% on 30 September to 3.26% on 29 October, the latest reading given the series’ 1-day lag, and investment grade from 0.84% to 0.89%. Over the past 3 years high yield has ranged between 2.59% and 4.61% with a median of 3.02%, so October’s 3.26% is higher than about 78% of the daily readings in that period while sitting well inside the range. Investment grade’s 0.89% is a little above its own 3-year median of 0.84%, within a range of 0.73% to 1.33%. Neither reading on its own indicates a credit crisis, though both widened during October.
So there is no visible credit crisis. That is a narrower claim than it sounds, and separate from the question of whether equities offer good prospective returns. Share prices can fall a long way on valuation and earnings alone.
Gold fell 6.6% and bitcoin 7.6% in the month. Those moves are consistent with positioning being reduced across crowded trades, though price co-movement alone can’t establish it and both assets fall for their own reasons.
Friday is the one piece that doesn’t fit neatly. Intel guided fourth-quarter revenue to $15.0bn to $16.0bn with non-GAAP earnings of $0.25, against consensus nearer $17.1bn and $0.43, and fell 28.6%, taking semiconductors with it. Amazon had also reported the previous evening. But the selling reached banks and health insurers too, while staples and energy rose. Intel was the catalyst for the semiconductor leg, not an explanation for the whole session, and whether Friday was an interruption of the rotation or the start of something broader is genuinely open.
The Evidence That Makes This Specific
The strongest support for an AI-specific reading sits in the filings rather than the price action. What follows is an interpretation of that evidence, not a demonstrated cause of every move last month.
Alphabet grew revenue 25% and reported negative free cash flow of $9.1bn, on $51.4bn of capital spending. Separately, operating cash flow absorbed a $5.2bn cash payment in July for a previously accrued European Commission fine, disclosed in Note 10. That payment was real money out of the door, but it isn’t infrastructure spending, and this particular settlement is non-recurring. Excluding it as an illustration, free cash flow would have been about minus $3.9bn rather than minus $9.1bn. Negative either way, on the largest quarterly capital budget the company has ever run.
Alphabet has also stopped buying back stock, after $39.8bn over the first 9 months of 2025, and raised roughly $62bn of equity and preferred this year. Most of that, about $49.5bn, came in June through a public offering, a private placement to a Berkshire Hathaway affiliate and mandatory convertible preferred, with the filings naming capital expenditure to scale AI infrastructure among the intended uses. The remaining $12.4bn is a third-quarter at-the-market program whose proceeds are, per the filing, primarily intended to meet tax obligations on employee equity grants. Those are different things and shouldn’t be added together carelessly.
Intel, meanwhile, reports a completed $23bn public equity offering. So Alphabet isn’t alone, though 2 issuers establish a pattern worth watching rather than a sector-wide funding problem.
What follows is narrower than it first appears. New equity increases the share count, and whether existing holders end up better off depends on the returns the new capital earns and the price at which the shares were sold. External equity financing does not automatically raise a project’s required return. What it does is make the consequences explicit: returns now have to be judged alongside issuance prices, potential dilution and financing terms, including the preferred’s dividend. Investment funded from operating cash flow faces the same test against the cash shareholders could otherwise have received. External financing just puts the terms on paper.
Which gives the second conclusion. Strong earnings don’t guarantee strong shareholder returns. Alphabet earned $40.6bn of operating income in the quarter and Microsoft $45.9bn. A sector can matter enormously to the economy and still disappoint its owners if the capital intensity, the share count and the entry valuation all move the wrong way at once.
What History Offers, And What It Doesn’t
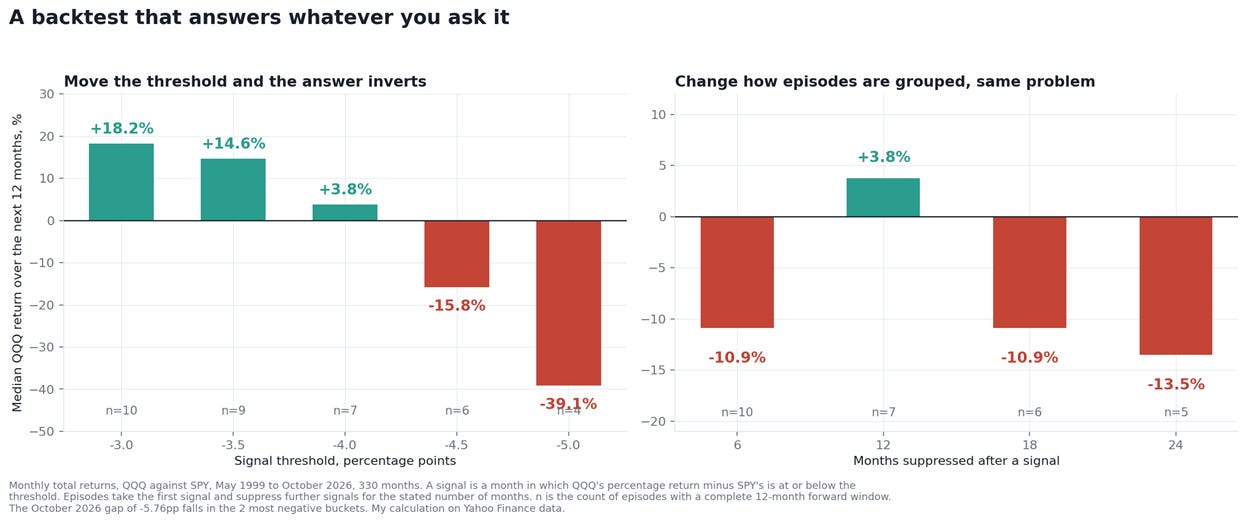
I tested whether October’s divergence has historically predicted anything. Since May 1999, QQQ has trailed SPY by 4 percentage points or more in 28 months, which collapse to 8 distinct episodes under a consistent rule. Their median subsequent 12-month return is below the unconditional median for the same period. But move the threshold from 4 points to 3 and the answer turns strongly positive; move it to 5 and it turns sharply negative, and changing how episodes are grouped flips it again. With 7 complete observations, this sample does not provide a stable forecasting rule.
Individual episodes teach more than the aggregate. March 2000 is the uncomfortable one: capital spending funded externally, followed by a 64% decline over the next year. What differs is the starting point. Speculative internet companies with no earnings were a large part of that market, though plenty of profitable, established technology leaders also fell hard, which is the real lesson: profits don’t protect you from paying too much.
April 2022 is the more useful comparison. QQQ was up 3.8% a year after that signal, yet fell 21.7% peak to trough along the way. A satisfactory annual number can hide a genuinely difficult year, which matters if you’re deciding what you can hold through.
What Would Change The Reading
Earnings expectations outside technology. Broader downgrades would undercut the concentrated-repricing interpretation and point to something economy-wide.
Credit spreads, measured as spreads. October’s widening was modest; sustained widening would signal real financing stress and change the character of the decline.
Convergence between the equal-weighted and cap-weighted indices, which can happen 2 ways. Laggards recovering is a healthy resolution. Equal-weight weakness alongside further technology declines is the opposite, and would say the selling is broadening.
The AI capital cycle itself: spending against incremental revenue, utilization, depreciation and how it’s financed. Note that lower capital spending guidance isn’t uniformly good news. It would help free cash flow at the companies buying infrastructure while cutting revenue expectations at the chipmakers and equipment suppliers selling it, and might signal softer demand. Buyers, suppliers and the businesses monetizing AI services face different versions of this question, and several large companies sit in more than one category.
Bottom Line
October didn’t deliver indiscriminate selling. It delivered a repricing of one dominant theme while the rest of the market carried on, and that distinction is more useful than any forecast I could offer about what comes next.
The practical work is to look at your own concentration, what you paid, and whether the companies you own are converting growth into per-share cash generation rather than into capital commitments. Guidance over the next few quarters will supply evidence on that; returns on multi-year infrastructure take considerably longer to establish. A portfolio outside AI infrastructure wasn’t automatically fine last month either, since that depends entirely on what it held instead.
Reinvestment isn’t the problem; it’s how these businesses got large. The question October asked, and the one worth putting to anything you own, is whether that reinvestment will generate enough future cash per share to justify what you’re paying today.
Sources and method. Fund and index figures in the body are unadjusted price returns from Yahoo Finance daily closes, with October measured from the 30 September close to the 30 October close; the funds named are SPY, RSP, QQQ, QQQE, SMH, IGV, MAGS and the SPDR sector series. The historical study separately uses dividend-adjusted total returns, month-end to month-end, from May 1999 to October 2026, with episodes formed by taking the first signal month and ignoring further signals for 12 months, and drawdowns measured as the largest fall from a running daily closing peak to a later trough inside the following 12 months. Credit spreads are FRED series BAMLH0A0HYM2 and BAMLC0A0CM; the 3-year ranges reflect the history available from FRED’s public download. Alphabet figures are from its Form 10-Q (SEC accession 0001652044-26-000084) for the quarter ended 30 September 2026, Notes 3, 10 and 11, where the preferred raise is $19.0bn net against $19,063m in the cash flow statement. Intel figures are from its third-quarter 2026 results release of 29 October 2026, exhibit 99.1 to its Form 8-K.
This is research and commentary, not personal investment advice. The author may hold positions in names discussed.