


Most investors chasing defense and space exposure are looking at RKLB 0.00%↑, LUNR 0.00%↑, and a handful of other names. Satellogic SATL 0.00%↑ is not that. It is smaller, less followed, and trades at a fraction of the revenue multiples commanded by its peers.
What it does have is a 20-satellite constellation delivering 50cm high-resolution Earth observation imagery at what management claims is one-tenth the cost of small satellite peers, a technology roadmap that is fully funded by customer contracts rather than dilutive equity raises, and a growing list of sovereign defense customers across the US, Europe, Asia Pacific, and the Middle East who are actively writing checks.
This is still an early-stage, pre-profitability business with real execution risk. But the underlying operating business is improving steadily. The question for investors is whether the commercial momentum that started building in 2025 is durable, and whether the Merlin constellation, launching in October 2026, creates a big change in addressable market and recurring revenue potential.
The stock has moved. Up roughly 30% on the week of writing, pressing near its highest levels since 2022. The setup requires patience rather than chasing.

Key Takeaways
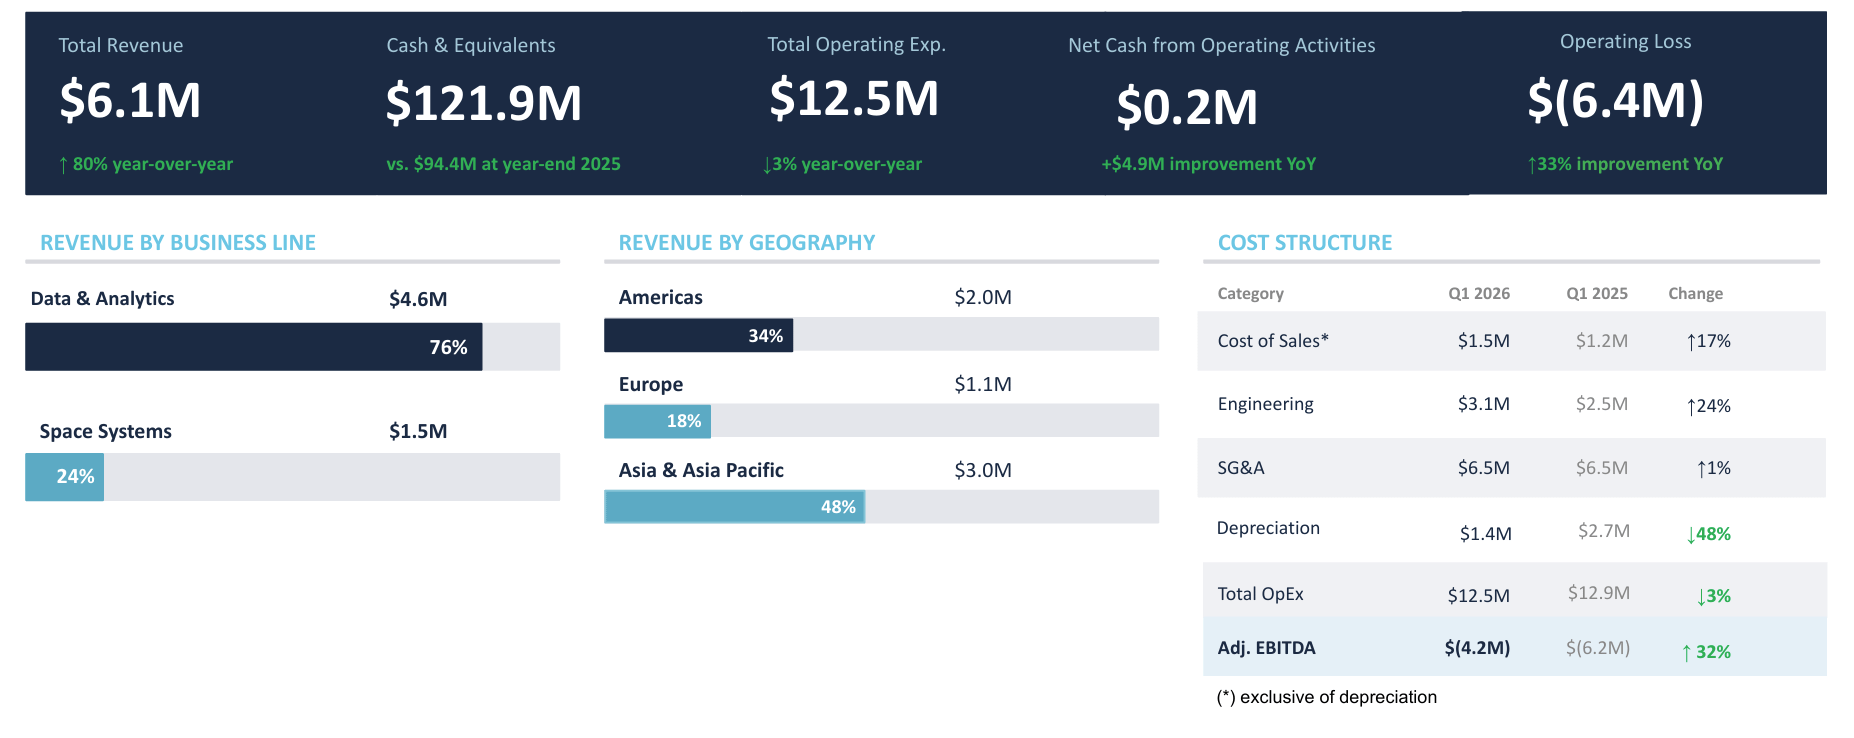
Q1 2026 revenue up 80% year over year, continuing a multi-quarter acceleration
Q1 2026 operating cash flow turned positive at +$0.2M, the first positive operating cash flow quarter in the company’s recent history
Headline net loss of $(118.3M) driven almost entirely by a $(113M) non-cash change in fair value of financial instruments; not reflective of operating performance
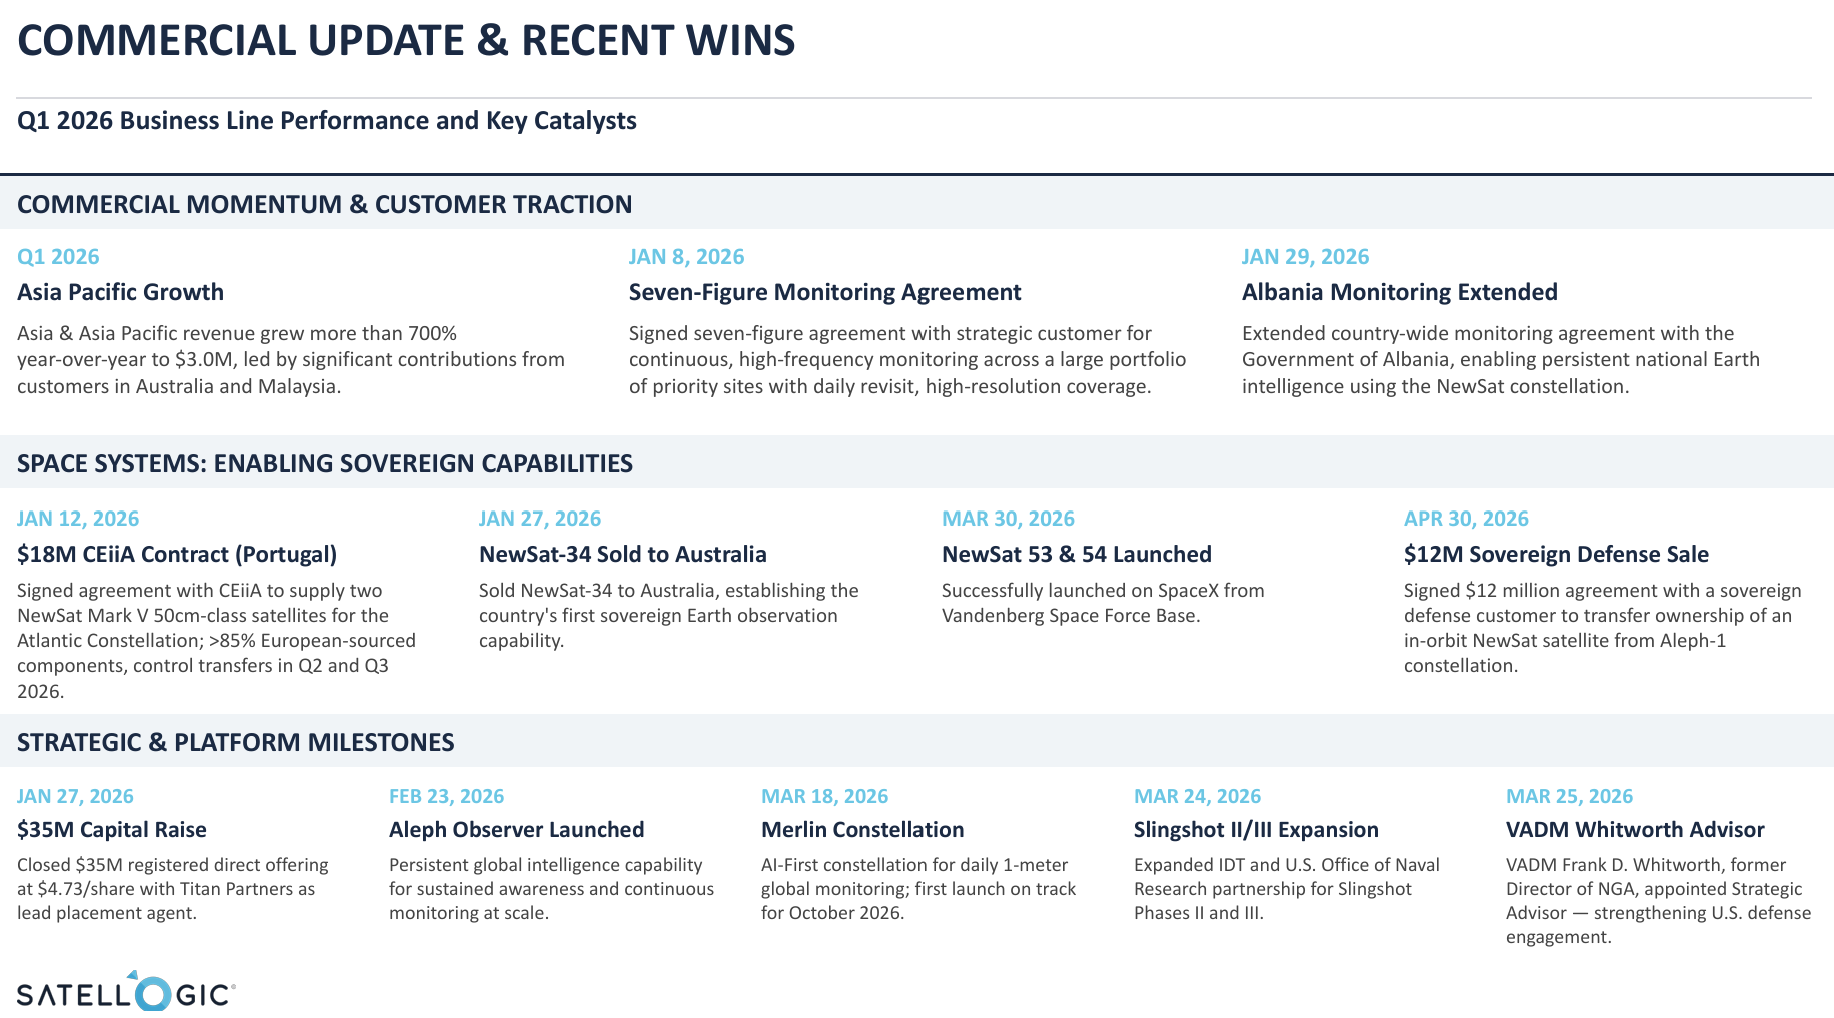
Asia and Asia Pacific revenue grew more than 700% year over year to $3.0M in Q1 2026, driven by Australia and Malaysia
$64.8M in non-cancellable remaining performance obligations (RPO) as of March 31, 2026
Merlin AI-first constellation on track for October 2026 launch; H1 2027 initial operational capability
What Satellogic Does
SATL 0.00%↑ builds, launches, and operates a constellation of Earth observation (EO) satellites that capture high-resolution imagery and deliver it to defense, intelligence, and commercial customers. Its 20-satellite NewSat constellation provides 50cm resolution imagery at what the company describes as the lowest unit cost in the sub-meter commercial EO market, backed by a patent-protected pushframe camera design that gives each satellite roughly 10x the capture capacity of small satellite peers.
The business operates across three lines.
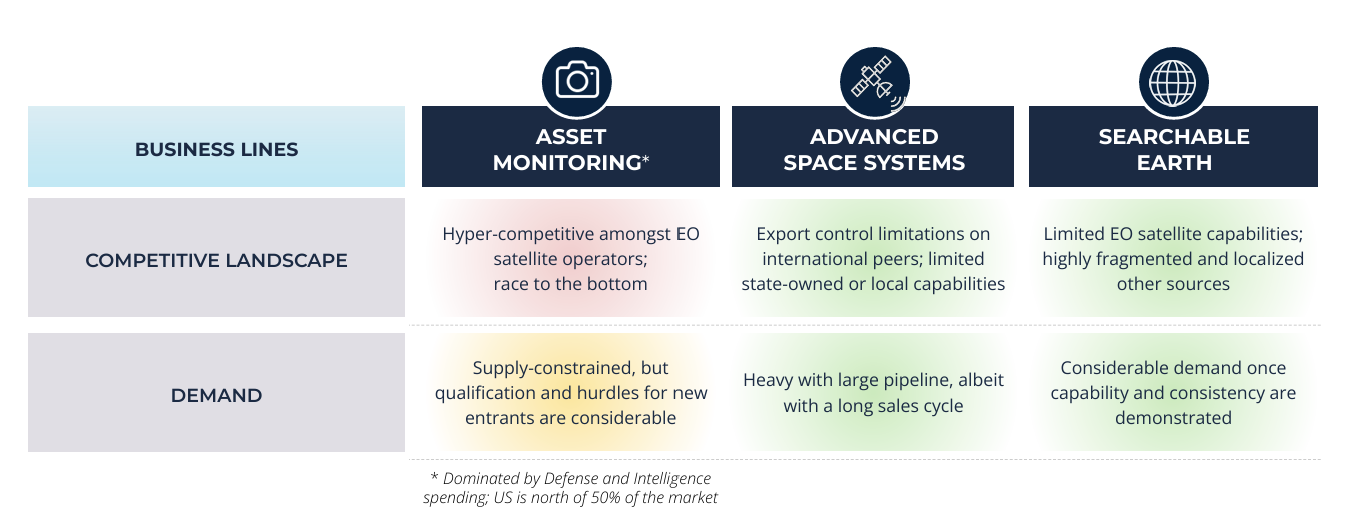
Asset Monitoring is the core product, providing high-resolution imagery and analytics via the Aleph platform to defense and intelligence customers including NGA, NASA’s Commercial Satellite Data Acquisition program, US Space Force, Palantir, and Vantor (formerly Maxar Intelligence).
Advanced Space Systems is the sovereign business, where governments pay Satellogic to build and transfer satellite ownership to them, including in-country technology transfer and manufacturing. This segment generated the $18M Portugal contract (CEiiA), the $12M sovereign defense satellite sale in April 2026, and agreements in Malaysia and India.
Searchable Earth is the emerging AI-first product layer, anchored by the $30M multi-year contract for near-daily ultra-low latency analytics from the Merlin constellation.
What makes Satellogic structurally interesting right now is the convergence of three forces that did not exist twelve to eighteen months ago.
The company finalized its US domicile in March 2025, which opens direct access to US government defense and intelligence contracting in a way that was previously unavailable. This is not a small unlock. The appointment of VADM Frank D. Whitworth, former Director of the National Geospatial-Intelligence Agency, as strategic advisor in Q1 2026 signals that Satellogic is actively pursuing that market.
The Aleph Observer product, launched in February 2026, shifts the commercial model from transactional per-image sales toward recurring subscription-based monitoring. This is a meaningful model transition. Persistent monitoring contracts generate predictable, multi-year revenue rather than lumpy project-based income, and the company already has a strategic D&I customer under a $30M multi-year contract as the anchor.
The Merlin constellation, launching October 2026, is the first Earth observation system designed for daily 1-meter global coverage with real-time AI alerts. It is fully funded by existing customer contracts. Management is not asking investors to fund this. That is a material distinction from most pre-revenue space companies.
Fundamental Analysis
Revenue and Earnings
SATL 0.00%↑ ’s quarterly revenue trend is the clearest signal of what is changing in the business.
Quarterly revenue (in $M):
Q4 2024: $3.2M
Q1 2025: $3.4M
Q2 2025: $4.4M
Q3 2025: $3.6M
Q4 2025: $6.2M (+94% YoY)
Q1 2026: $6.1M (+80% YoY)
Annual revenue:
FY2023: ~$9.7M (annualized from quarterly data)
FY2024: $12.8M
FY2025: $17.7M (+38% YoY)
The acceleration is real. Q4 2025 and Q1 2026 represent a significant change from the $3-4M quarterly run rate that characterized most of 2024 and early 2025. The company is not yet at a revenue scale that makes traditional earnings multiples meaningful, but the direction of travel is unambiguous.
FY2025 net loss available to stockholders was $(4.8M) on a GAAP basis, but that figure included a large positive swing from fair value changes. The noise in these GAAP numbers is significant and requires stripping back to Adj. EBITDA and operating cash flow to understand the actual trajectory.
Margins and Profitability
Gross margin trend:
Q1 2025: 63.5%
Q2 2025: 73.2%
Q3 2025: 67.8%
Q4 2025: 79.5%
Q1 2026: 76.2%
Gross margins are expanding meaningfully and are now consistently above 70%. For a hardware-intensive satellite business, these are exceptional margins. They reflect the low marginal cost of incremental imagery delivery on an already-deployed constellation combined with the high-value defense and sovereign contracts dominating the revenue mix.
Cash Flow and Balance Sheet
The operating cash flow inflection in Q1 2026 is the most important fundamental development in recent quarters.
The company generated +$0.2M in cash from operations, compared to $(4.7M) in Q1 2025. This is the first quarter of positive operating cash flow in the company’s recent history and is a signal, not yet a trend, but a signal that the revenue scale is beginning to cover operating costs.
Cash position:
FY2023: $23.5M
FY2024: $22.5M
FY2025: $94.4M
Q1 2026: $121.9M (following capital raises)
The $121.9M cash balance is the strongest in company history and provides a meaningful operational runway. Capital expenditures were $5.5M in Q1 2026, higher than prior quarters, reflecting investment in the Merlin constellation build-out.
The balance sheet has a complexity worth flagging: total debt stood at $149.7M as of March 31, 2026, up from $63.4M at year-end 2025. The increase is primarily driven by the convertible notes whose fair value swings are responsible for the GAAP net loss volatility. Common equity is negative at $(25.5M) due to the accumulated deficit. This is not a traditional balance sheet analysis situation; the company is pre-profitability and the debt structure requires monitoring.
Total assets grew to $188.1M from $151.3M at year-end 2025, supported by the cash build and growing receivables.
Non-cancellable backlog of $64.8M breaks down as follows:
Under 1 year: $29.2M
Years 1-2: $7.9M
Years 2-3: $7.5M
Thereafter: $20.2M
For a company generating $6M per quarter, $29.2M in near-term backlog is substantial forward visibility.
The honest framing: SATL 0.00%↑ at current price is a momentum and catalyst trade, not a value trade. The intrinsic value case builds materially as revenue scales and the Adj. EBITDA loss narrows toward breakeven.

Technical Analysis
The Big Picture: Weekly Chart
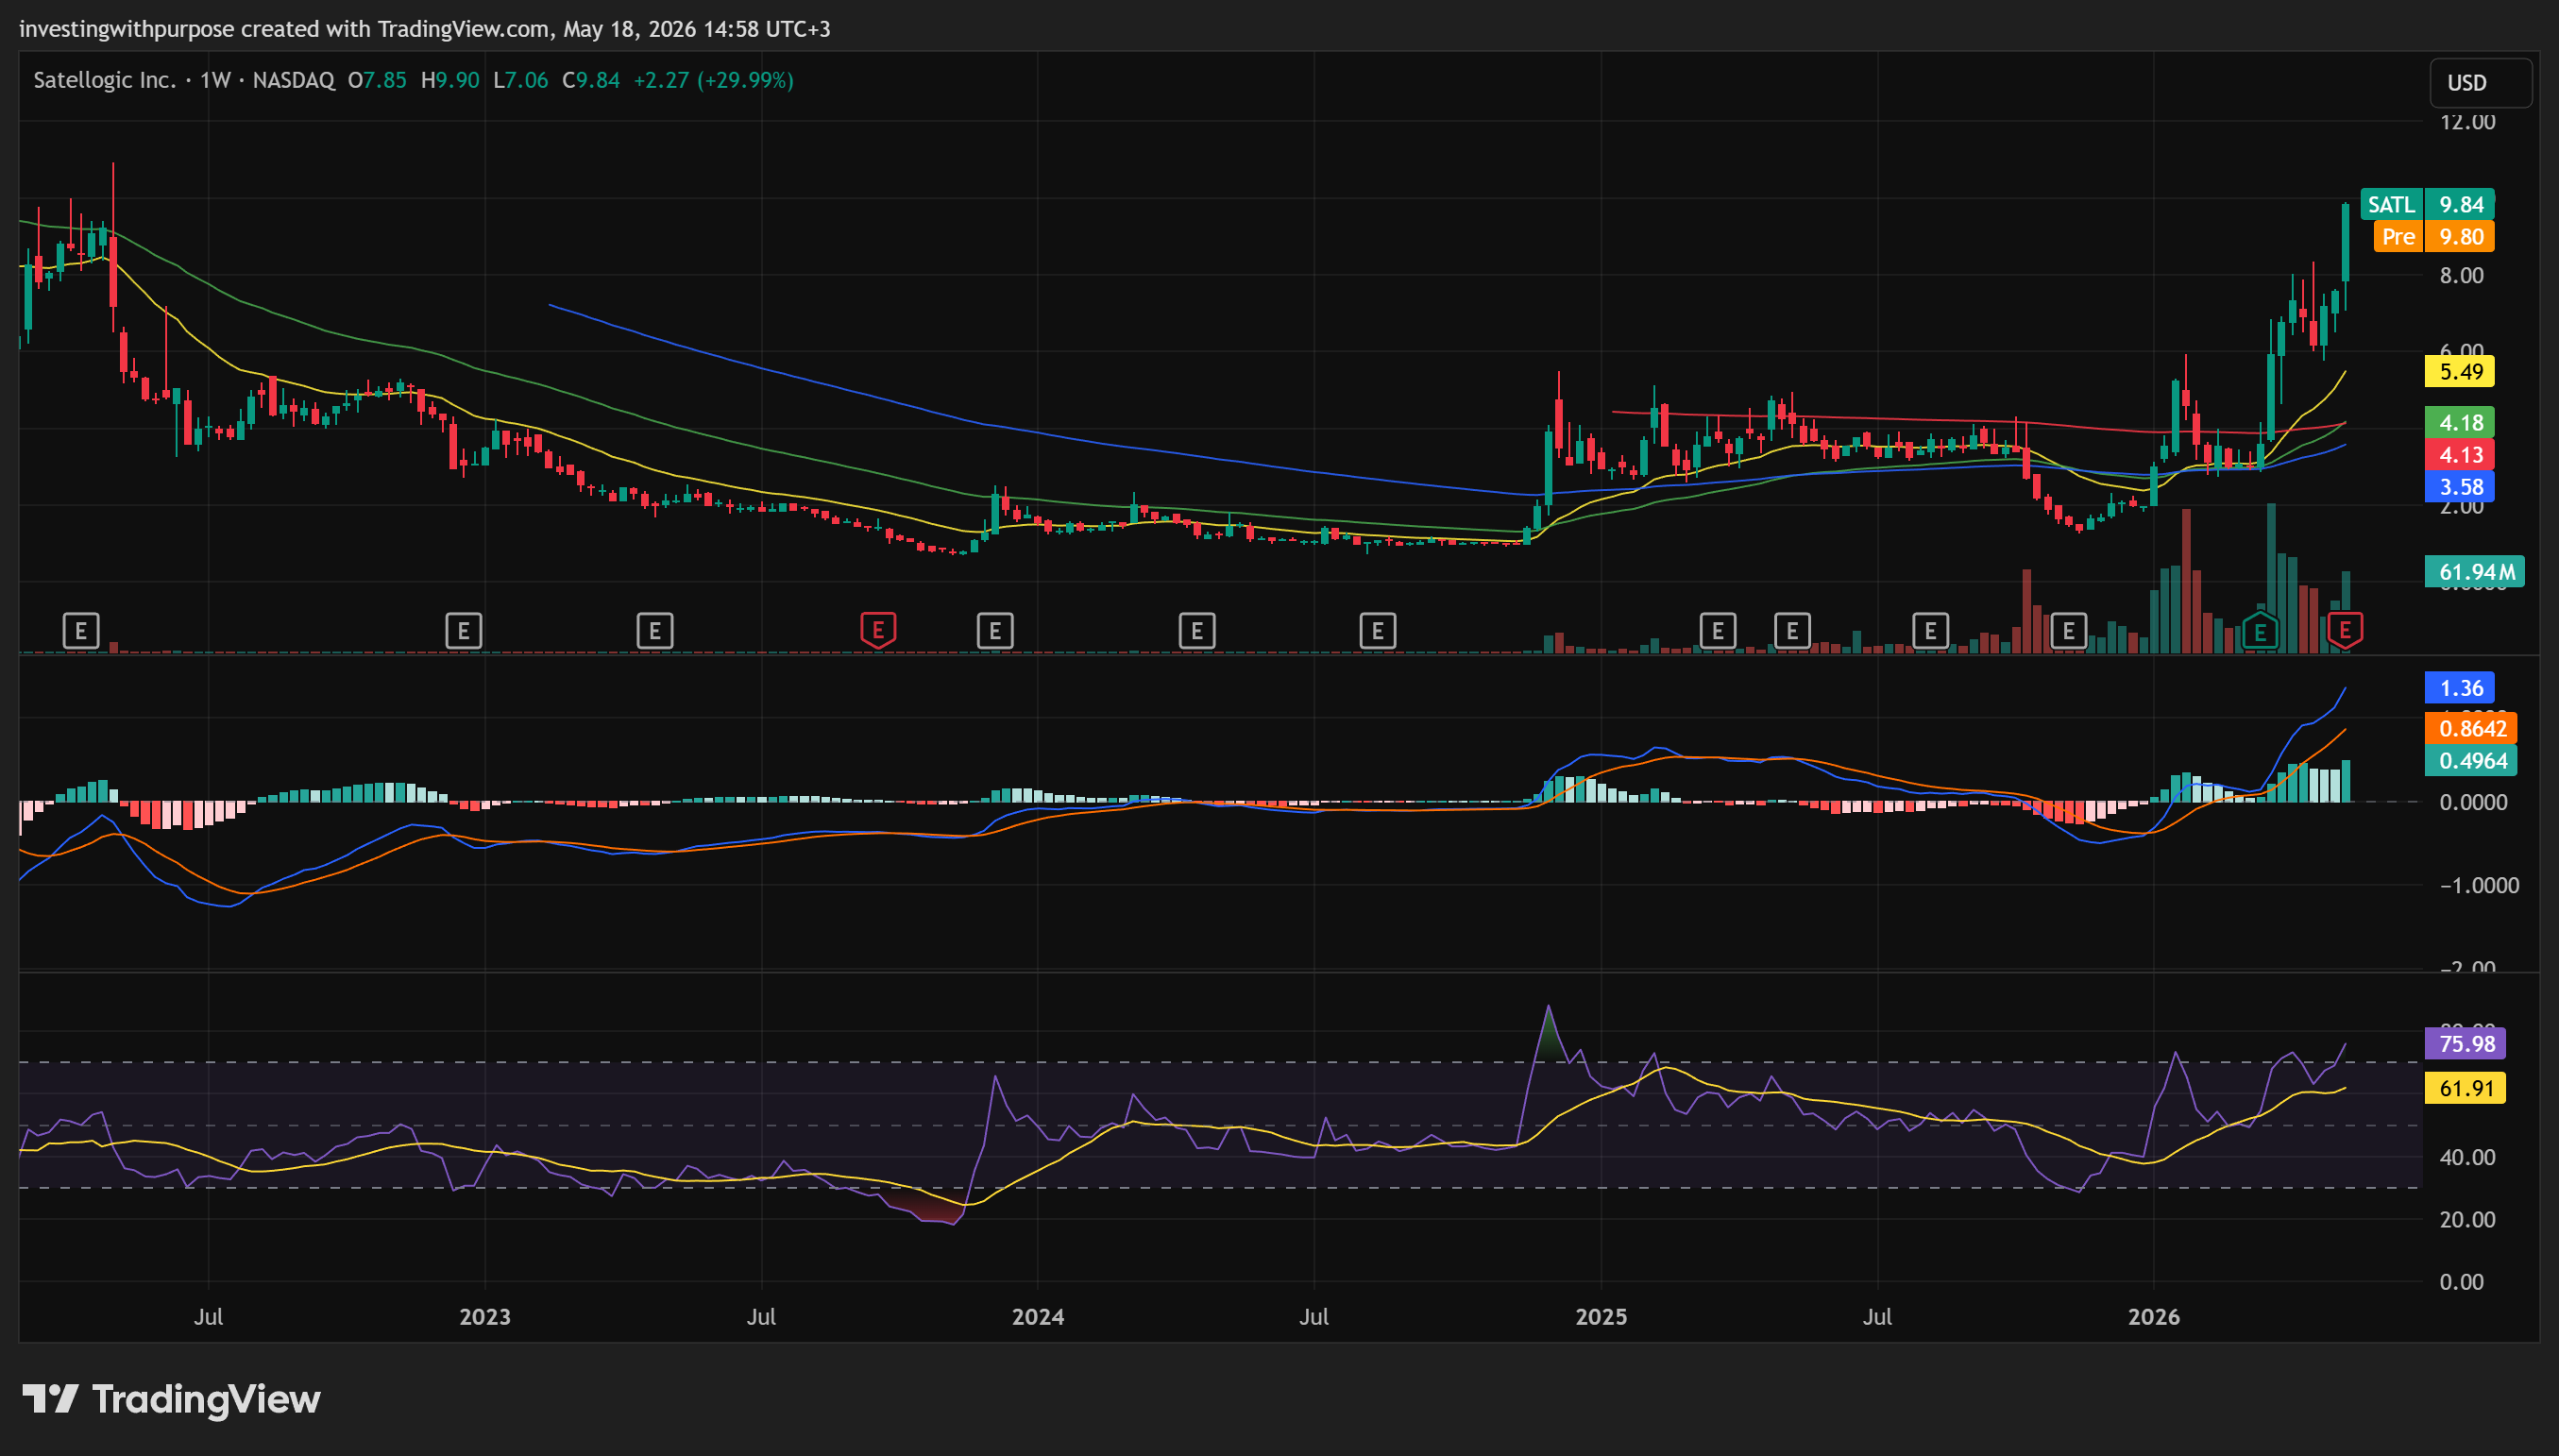
The weekly chart tells the story of a long, brutal decline followed by a base and an explosive recovery that is only now beginning to show up at the weekly level. From its 2022 highs near $12-13, SATL spent roughly two and a half years grinding lower through a complete five-wave corrective structure, bottoming near $1.50 in early 2026.
The recovery from that bottom has been extraordinary. Price has now cleared all four weekly EMAs, with the 20 EMA at $5.49 and the 50 EMA at $4.18 both turning sharply upward. The weekly RSI is at 75.98, entering overbought territory at this timeframe, and the MACD has completed a strong bullish crossover with histogram bars expanding positively.
The weekly chart points toward $9.90 as the immediate target for the current leg which price has essentially reached last week. This is a natural pause zone. The structure above $9.90 needs to consolidate and form a new base before the next impulsive advance becomes probable.
Daily Chart
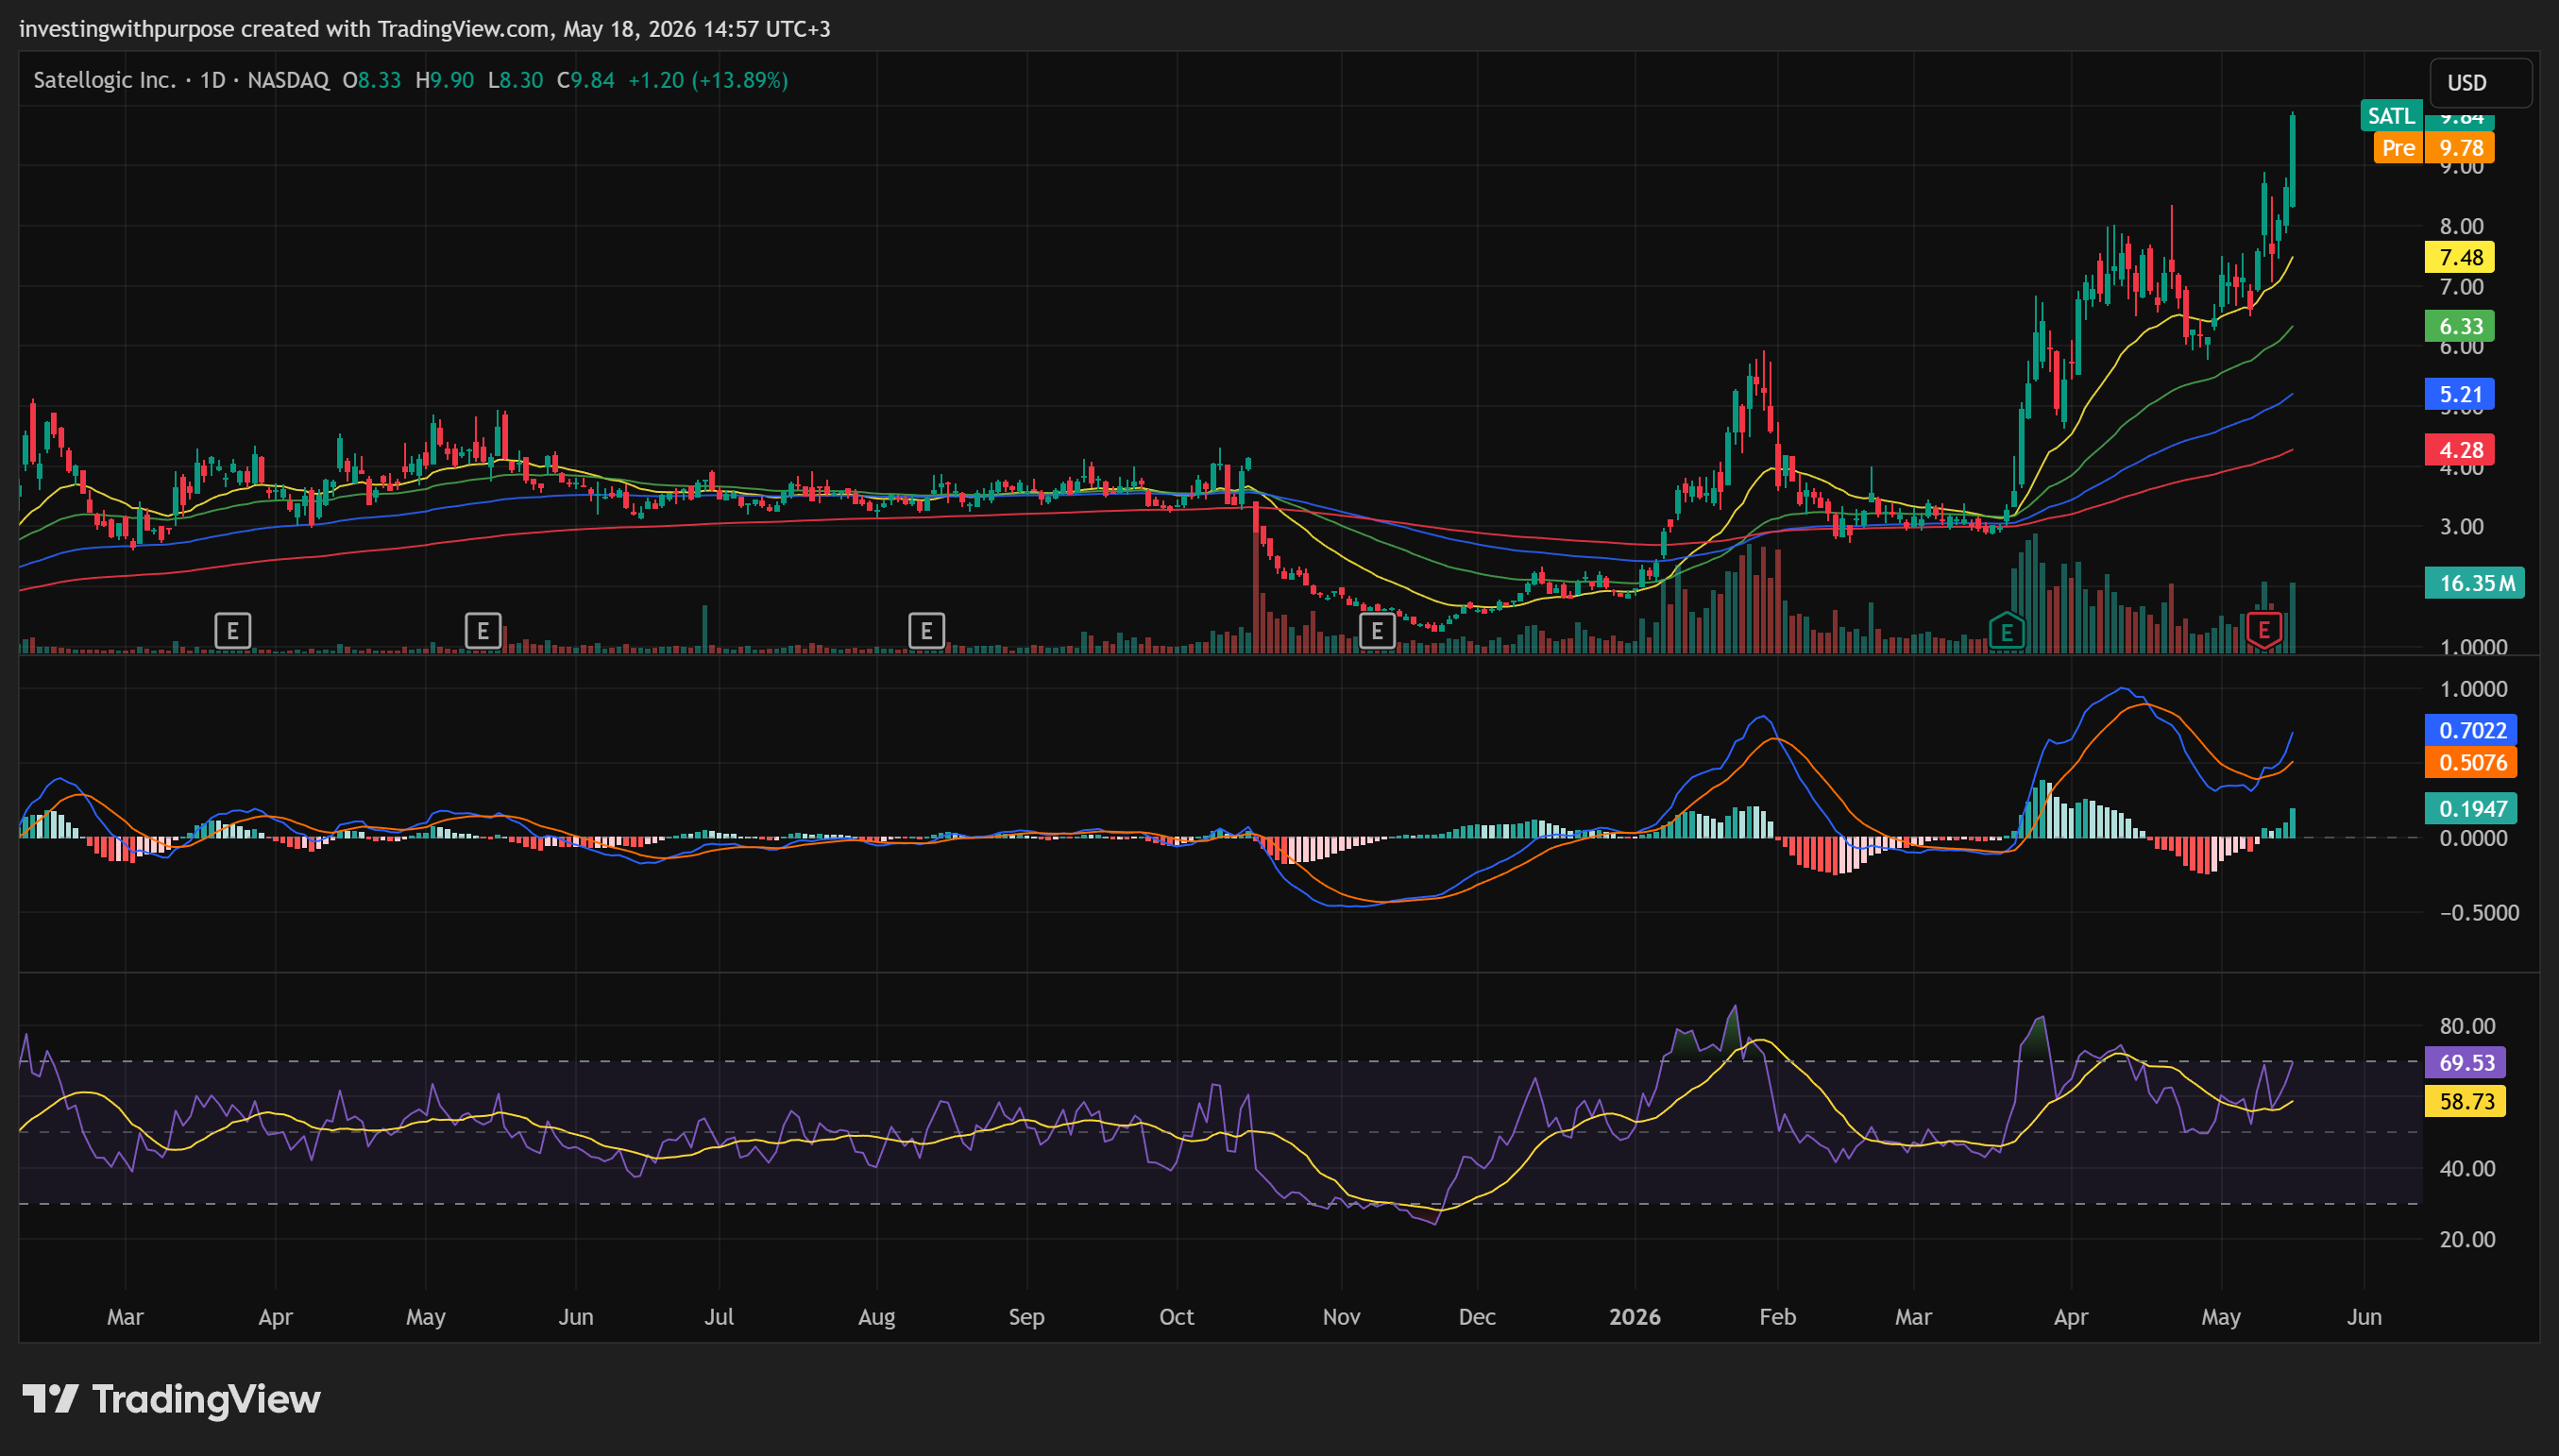
The daily chart shows a stock that launched aggressively from its April lows around $3.50-4.00 and has not looked back. Two significant gap-and-go sessions drove the bulk of the advance: the initial breakout in mid-April and the earnings week surge in May. Volume on both moves was exceptional relative to the prior three months of quiet accumulation.
Price is now well above all four daily EMAs, with the 20 EMA at $7.48 sitting roughly 25% below the current price. The daily RSI reached 69.53 and the MACD remains deeply positive. This is a healthy daily trend with the characteristic of a momentum-driven move where pullbacks have been shallow and brief.
The risk for new entrants is buying into the vertical phase of a move that has already covered most of its near-term distance.
The daily chart does not yet show signs of exhaustion at current levels. But it does not need to show exhaustion to offer a better entry 10-15% lower than current prices.
Momentum Across Timeframes
Weekly: RSI 75.98, MACD strong bullish crossover, EMA stack aligned bullish. Entering overbought but not extreme at weekly level.
Daily: RSI 69.53, MACD deeply positive, price well above all EMAs. Constructive trend, not extended enough to panic but not offering good risk-reward for new entries right now.
2-hour: RSI 75.64, MACD positive with histogram beginning to flatten. Short-term momentum peaking.
1-hour: RSI 73.64, MACD constructive, EMA stack bullish. Elevated but not extreme.
30-min: RSI 72.20, MACD positive, Kalman bands rising steeply. Extended intraday.
5-min: RSI 65.26, MACD flat to slightly positive. Near-term cooling from the hot readings seen earlier this week.
The dominant read: the weekly and daily structures are genuinely bullish and the trend is intact. Short-term timeframes are extended from the week’s move and suggest patience rather than immediate entries.
Key Levels
Support:
$8.80-9.00: 20 EMA on the 1-hour and recent intraday consolidation base; first pullback zone
$8.00-8.20: Kalman band support and prior breakout area from the May surge; primary dip-buy zone
$7.10-7.50: Daily 20 EMA and intermediate support shelf; deeper reset zone with better risk-reward
$6.00-6.30: Pre-May consolidation base; structural support for any larger pullback
Resistance:
$9.84-10.00: Current zone; psychological round number and wave projection target
$10.50-11.00: Next extension zone above the current consolidation
$12.00-13.00: Prior 2022 highs and long-term structural resistance
Trade Plan
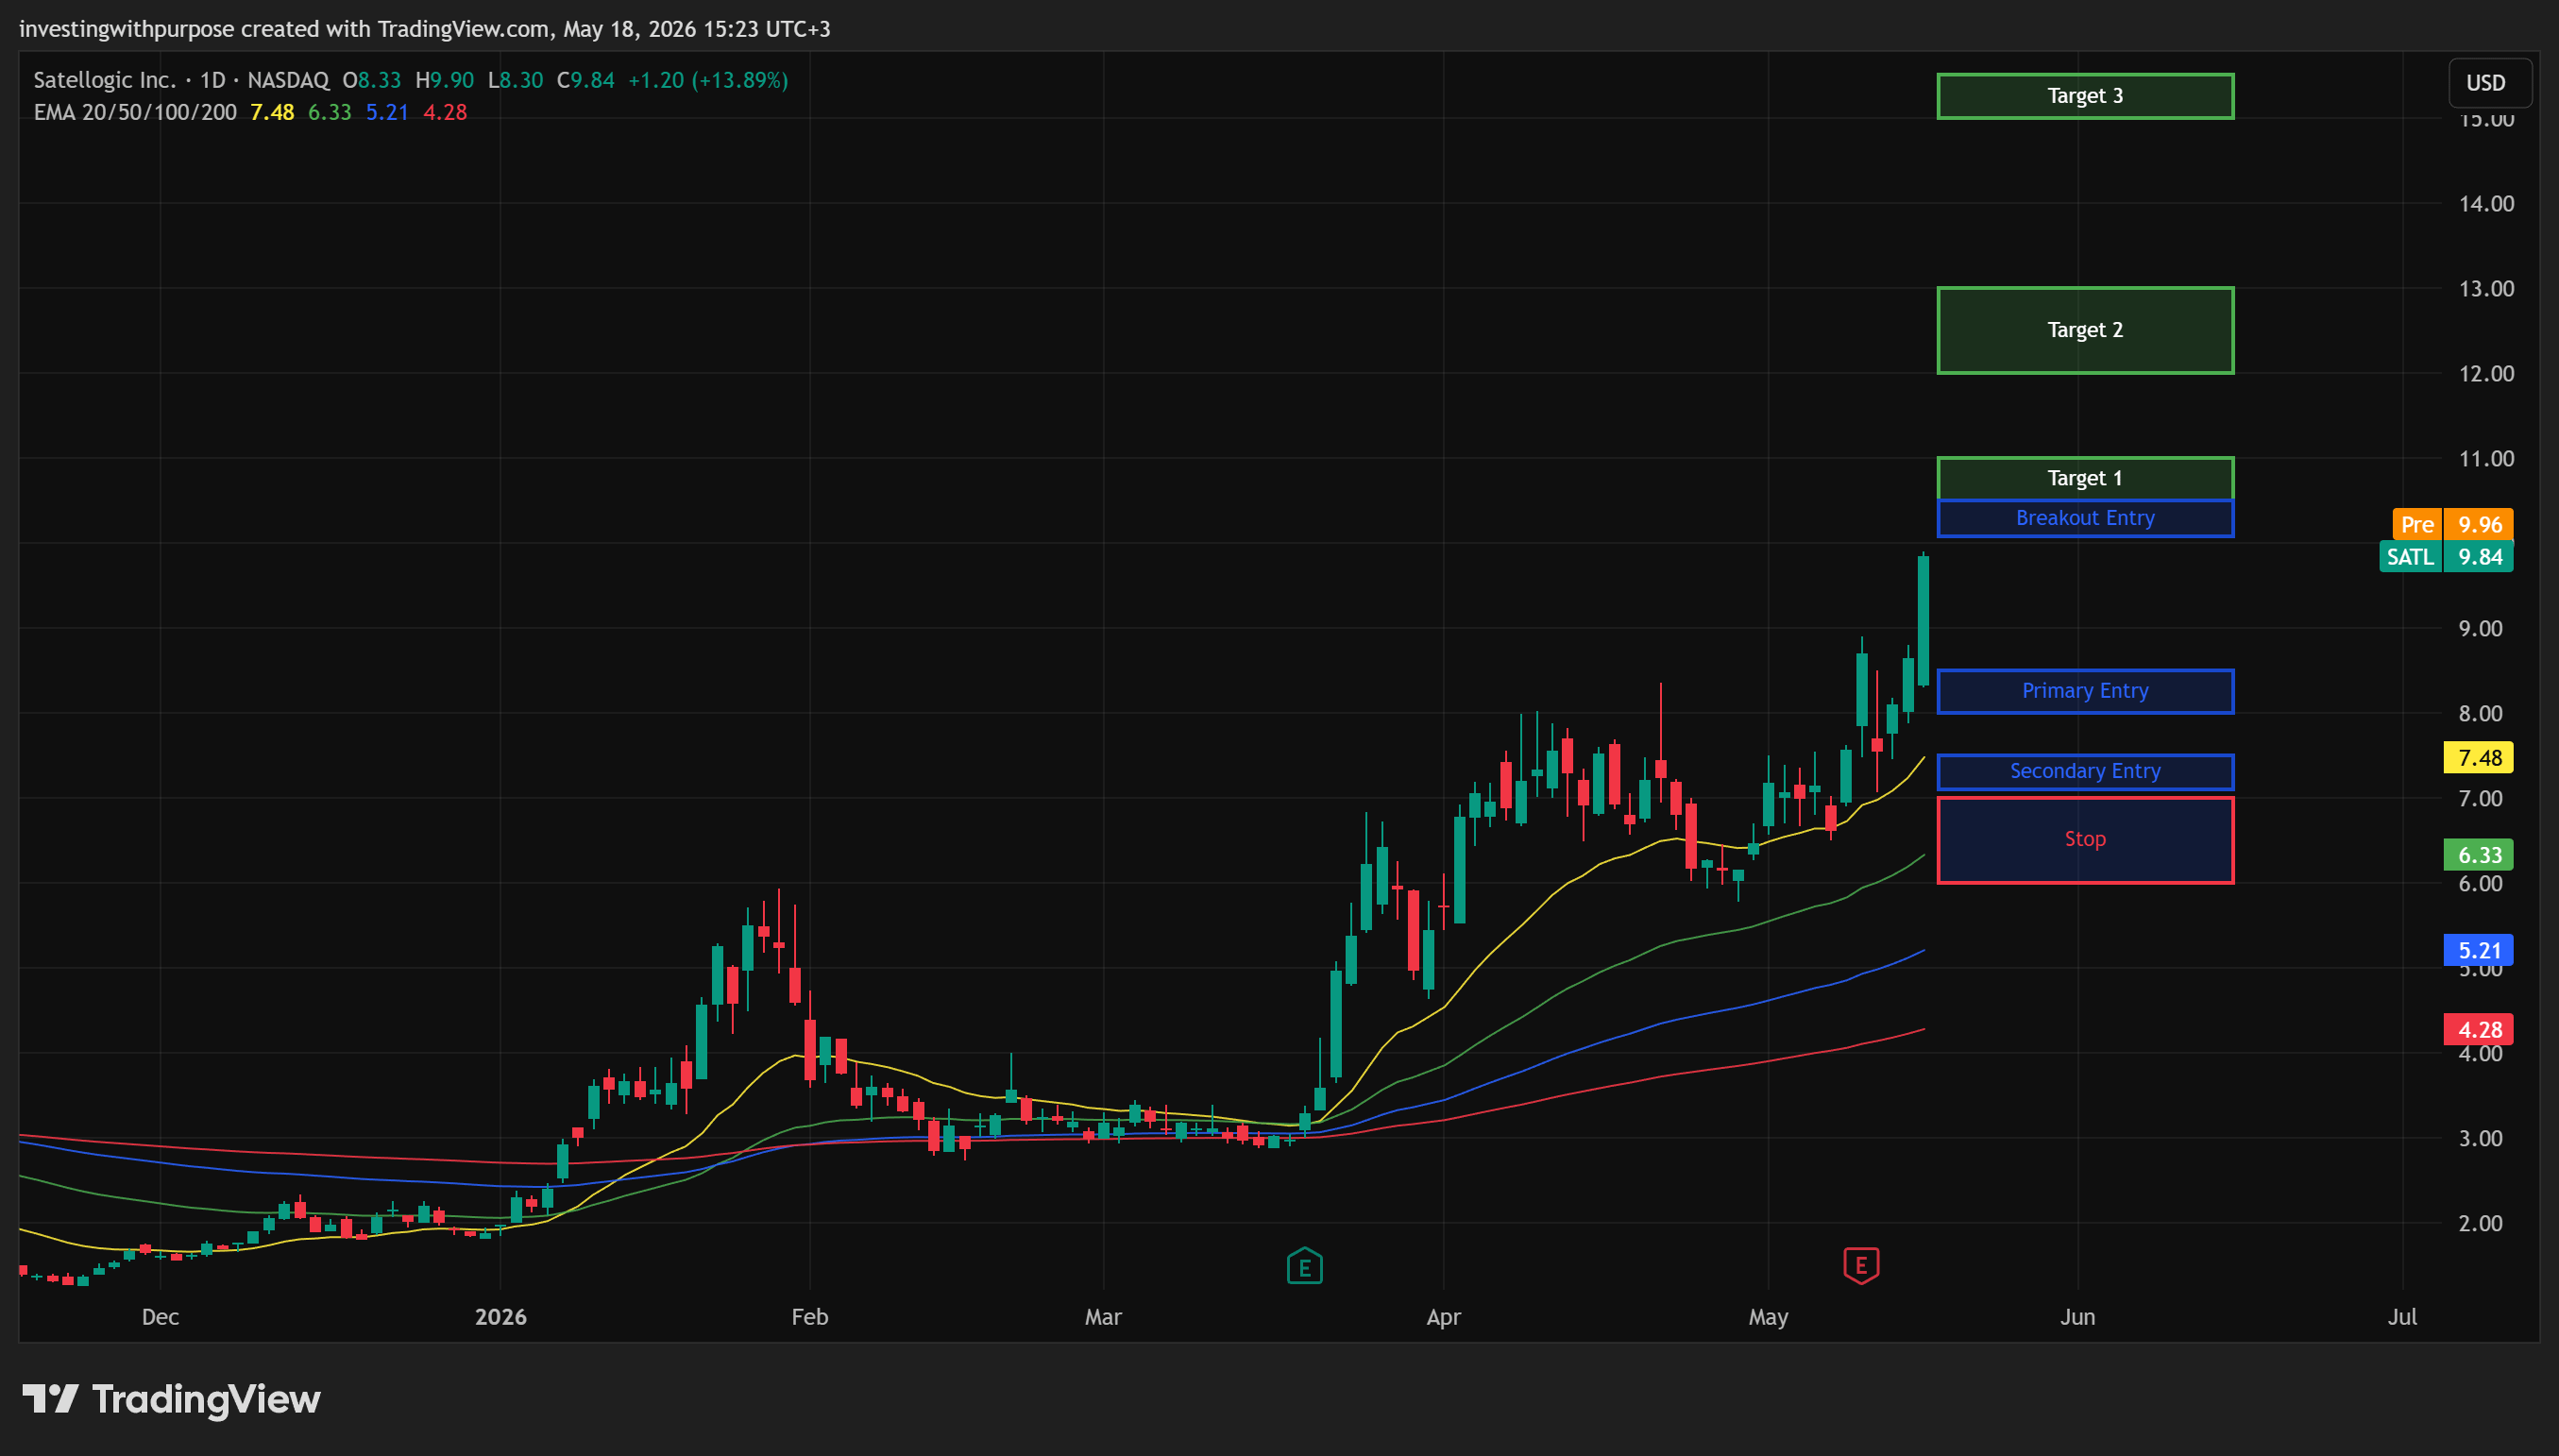
Position bias: Long, trend-following. The trend is real and the catalysts are real. Do not chase the current vertical move. Wait for consolidation or a pullback to defined entry zones.
Time horizon: 2-4 months (swing), with the Merlin October 2026 launch as the next major catalyst to frame around. Q2 2026 earnings in August is the intermediate checkpoint.
Entry zones:
Primary entry: $8.00-8.50 The ideal pullback zone where the support, prior breakout shelf, and the beginning of the daily moving average cluster converge. Look for a stabilization candle and reclaim of $8.50 on a closing basis before entering. This is the highest-quality entry if the trend remains intact.
Secondary entry: $7.10-7.50 Deeper pullback and daily 20 EMA zone. If price reaches this area and shows clear buying absorption, the risk-reward improves meaningfully. Confirmation preferred over anticipation.
Breakout entry: Above $10.30 on a daily close with volume. If price consolidates in the $9.50-10.00 range for several sessions and breaks cleanly higher, that continuation is tradeable with a stop just below the consolidation base.
Stops / invalidation:
Tactical stop: Below $7.00 A close below this level after entering in the primary zone weakens the near-term structure. Reduce or exit.
Structural stop: Below $6.00 Below the pre-May base and structural demand shelf. This level being lost means the post-earnings thesis is broken. Step aside entirely and wait for a new base.
Targets:
T1: $10.50-11.00 First extension and logical pause zone. Book partial profits here.
T2: $12.00-13.00 Prior 2022 structural highs. Consider full or near-full exit at this level.
T3 (stretch): $15.00+ Only viable in a strong momentum environment with Merlin launch confirmation, major defense contract wins, and volume expansion. Do not plan around this; let it come if it comes.
The Bottom Line
SATL 0.00%↑ is not a polished, proven compounder. It is a capital-light, technically differentiated Earth observation platform that is finally generating the commercial momentum its technology always promised, at a moment when sovereign defense demand for non-ITAR satellite intelligence has never been stronger.
The bull case: Revenue accelerating at 80% year over year. Operating cash flow positive for the first time. Gross margins above 75% and expanding. $64.8M in non-cancellable backlog. $121.9M in cash. A fully funded next-generation constellation launching in four months. Board members including a former US Treasury Secretary and a former Chairman of the Joint Chiefs. A strategic advisor who ran the National Geospatial-Intelligence Agency. US domicile completed and direct government contracting now accessible.
The bear case: Still loss-making on an operating basis. Revenue of $6M per quarter is tiny relative to the $1.5B market cap. The backlog is promising but contract-to-revenue conversion in sovereign defense is slow and lumpy. The balance sheet carries $149.7M in convertible debt that creates GAAP noise and dilution risk. The stock has already moved 200%+ from its lows. The fair value model implies the current price reflects an optimistic scenario that is not yet in the numbers.
The institutional view here is selective and patient. SATL has the technology, the customers, and the catalysts to justify a position at the right price. The right price is not today’s price after a 30% week. It is the pullback into the $8.00-8.50 zone, where the risk-reward lines up against a thesis that is now supported by the best financial quarter this company has ever reported and a product roadmap that is, for the first time, fully funded.
SATL doesn’t need to become Maxar to work from here. It just needs to keep executing.
This content is for informational and educational purposes only and reflects our views at the time of writing. It is not investment advice or a recommendation to buy or sell any security. Markets involve risk, prices can move against you, and outcomes are never guaranteed. Always do your own research and consider your risk tolerance before making investment decisions.