
The Stock Wall Street Is Panic-Selling While Management Is Panic-Buying
INTU has lost 50% from its peak while delivering its best operating leverage in years. The gap between price and reality is now wide enough to act on.

The panic is priced in. The platform is not.
Intuit Inc INTU 0.00%↑ peaked at $813.70 on July 30, 2025. By February 23, 2026, it had touched $349.00. That is a 57% drawdown in 147 trading days, the kind of decline that makes investors assume something fundamental has gone wrong… It hasn’t.
The stock is sitting near $403 today, bouncing off a double bottom that formed with genuine technical conviction. And the earnings report that came out yesterday, February 26, was not the story of a business in trouble. It was the story of a platform firing on multiple engines simultaneously, with operating leverage widening, AI monetization moving from story to data, and management buying back stock aggressively because they believe it’s cheap.
This piece integrates both sides of the picture. The fundamental case is strong and getting stronger. The technical case is fragile but improving. For medium-to-long-term investors, the setup is starting to become actionable.

Key Takeaways
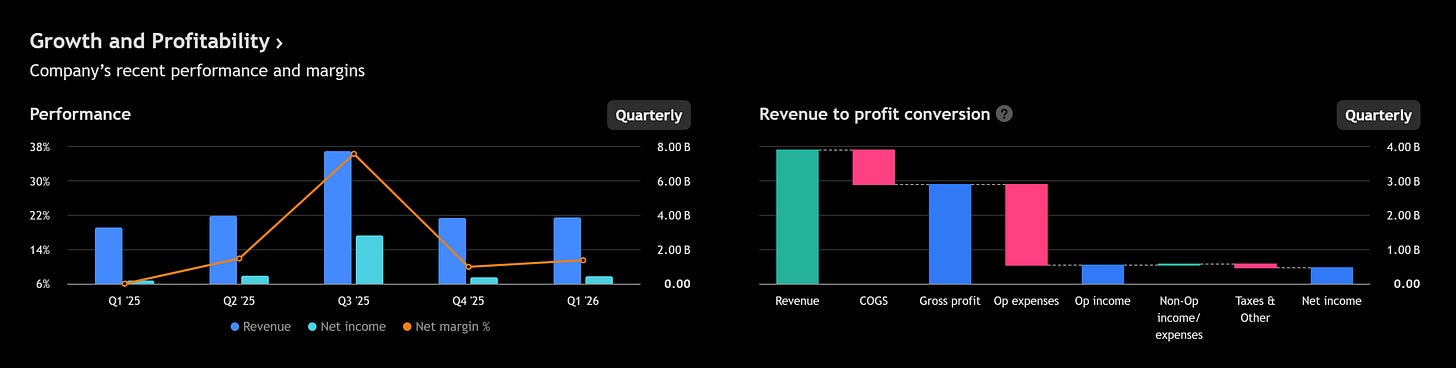
Q2 FY26 revenue grew 17.4% year-over-year to $4.651B. GAAP operating income grew 44%. GAAP EPS grew 49%. This is not a company in distress.
First-half operating margin expanded 440 basis points. Revenue grew 18%, operating expenses grew 12%. The leverage gap is real, structural, and widening.
Credit Karma grew 25% in H1, the single biggest positive surprise vs. expectations. Personal loans, credit cards, and insurance all accelerating.
Intuit Enterprise Suite (mid-market) had new contracts grow 50% quarter-over-quarter. The accountant channel now influences a third of new contracts. This business is in early S-curve acceleration.
AI agents categorized 237 million transactions in January alone. 85%+ of customers who use AI agents come back. That is a retention metric, not a feature metric.
Intuit announced a multi-year strategic partnership with Anthropic, making its platform the financial intelligence layer for Claude Agent Builder. This distribution is not in the current numbers.
Management is explicitly accelerating buybacks at current prices. In January, they repurchased shares at an average of $559.85. They are telling you something.
Mailchimp is declining. QuickBooks Capital charge-offs have roughly doubled year-over-year. Both are real risks. Neither is existential.
The February 23 low of $349 is the technical line in the sand. A clean daily close above $420 is the first confirmation that this bounce has legs.
The Business and Latest Earnings
The fundamentals don’t match the stock price. That’s the opportunity.
Intuit operates 4 interconnected platforms: TurboTax and the consumer tax ecosystem, QuickBooks and the growing mid-market enterprise suite, Credit Karma, and Mailchimp. The thesis is simple. Each platform generates proprietary financial data that makes the others smarter, creating a compounding moat that gets harder to replicate every year.

Q2 FY26 was clean at every level. Revenue of $4.651B grew 17.4%. GAAP operating income of $855M grew 44%. Non-GAAP EPS of $4.15 grew 25%. The first half is even more telling: H1 operating income of $1.39B is up 61% on 18% revenue growth. When revenue grows 18% and operating expenses grow 12%, you are watching a business genuinely scale. Management credited AI-driven efficiency, and the specifics back it up.
Credit Karma’s comeback is the biggest fundamental surprise. H1 revenue grew 25% to $1.267B. Personal loans contributed $115M of incremental H1 growth. Credit cards contributed $92M. Insurance added $38M. The market had treated Credit Karma as structurally impaired since rate hikes began in 2022. This quarter proves that thesis wrong. The 130 million member base is now monetized with AI tools designed to generate engagement 12 months a year, not just during tax season. The CK flywheel is rotating into the consumer tax platform, with Credit Karma AI assistants generating “exceptionally strong” early TurboTax demand.
The mid-market inflection is the most underappreciated part of the story. Online Ecosystem revenue for QuickBooks Online Advanced and Intuit Enterprise Suite grew roughly 40% in Q2. New IES contracts grew approximately 50% quarter-over-quarter. Intuit signed Citrin Cooperman and Eide Bailly as reseller partners, part of a Top 20 accounting firm strategy that is now influencing roughly a third of all new IES contracts. The dedicated mid-market sales team is expanding 30%. This is a classic enterprise SaaS land-and-expand motion with visible velocity. The $90 billion mid-market TAM is still largely untouched.
AI metrics are past the narrative stage. The accounting agent categorized 237 million transactions in January, more than 50% of all transactions that month. The business tax agent uncovered an average of more than $1,000 in incremental deductions per customer. The stock basis agent reduced taxable income by an average of $12,000 per customer. More than 3 million customers used AI agents in the quarter, with 85%+ repeat engagement. These numbers are per-customer, auditable, and directly tied to retention and average revenue per customer expansion. They also represent Intuit’s deepest competitive moat against generalist AI platforms: 30 years of proprietary financial data that cannot be replicated.

The Anthropic and OpenAI partnerships open an entirely new distribution layer. All 4 Intuit apps are now in the OpenAI app directory. The Anthropic partnership makes Intuit the financial intelligence layer inside Claude Agent Builder, meaning that when AI assistants handle financial questions, Intuit’s tax, accounting, and financial data powers the answer. This is pull-based distribution at a scale that doesn’t yet appear in any financial model. As large language models become commoditized, Intuit’s domain-specific data becomes the scarce, valuable differentiator. The more powerful AI gets, the stronger this moat.
The honest negatives. Mailchimp revenue was down slightly year-over-year in Q2. Management pushed recovery to “beyond fiscal 2026,” a public admission of extended underperformance. The SMB base is churning faster than expected. Mailchimp represents roughly $300 to $400 million per quarter, so it is meaningful: reported Online Services growth of 18% would be 28% excluding Mailchimp. It dilutes the headline number but it doesn’t define the business.
QuickBooks Capital originated $2.6B in H1 SMB loans, up 73% year-over-year. The charge-off rate has risen to approximately 4.7%, roughly double prior-year levels. Management is actively increasing reserves and the forward-flow program distributes credit risk to institutional investors, but if the charge-off rate climbs toward 6 to 7% and holds there, it becomes material. Watch it every quarter.
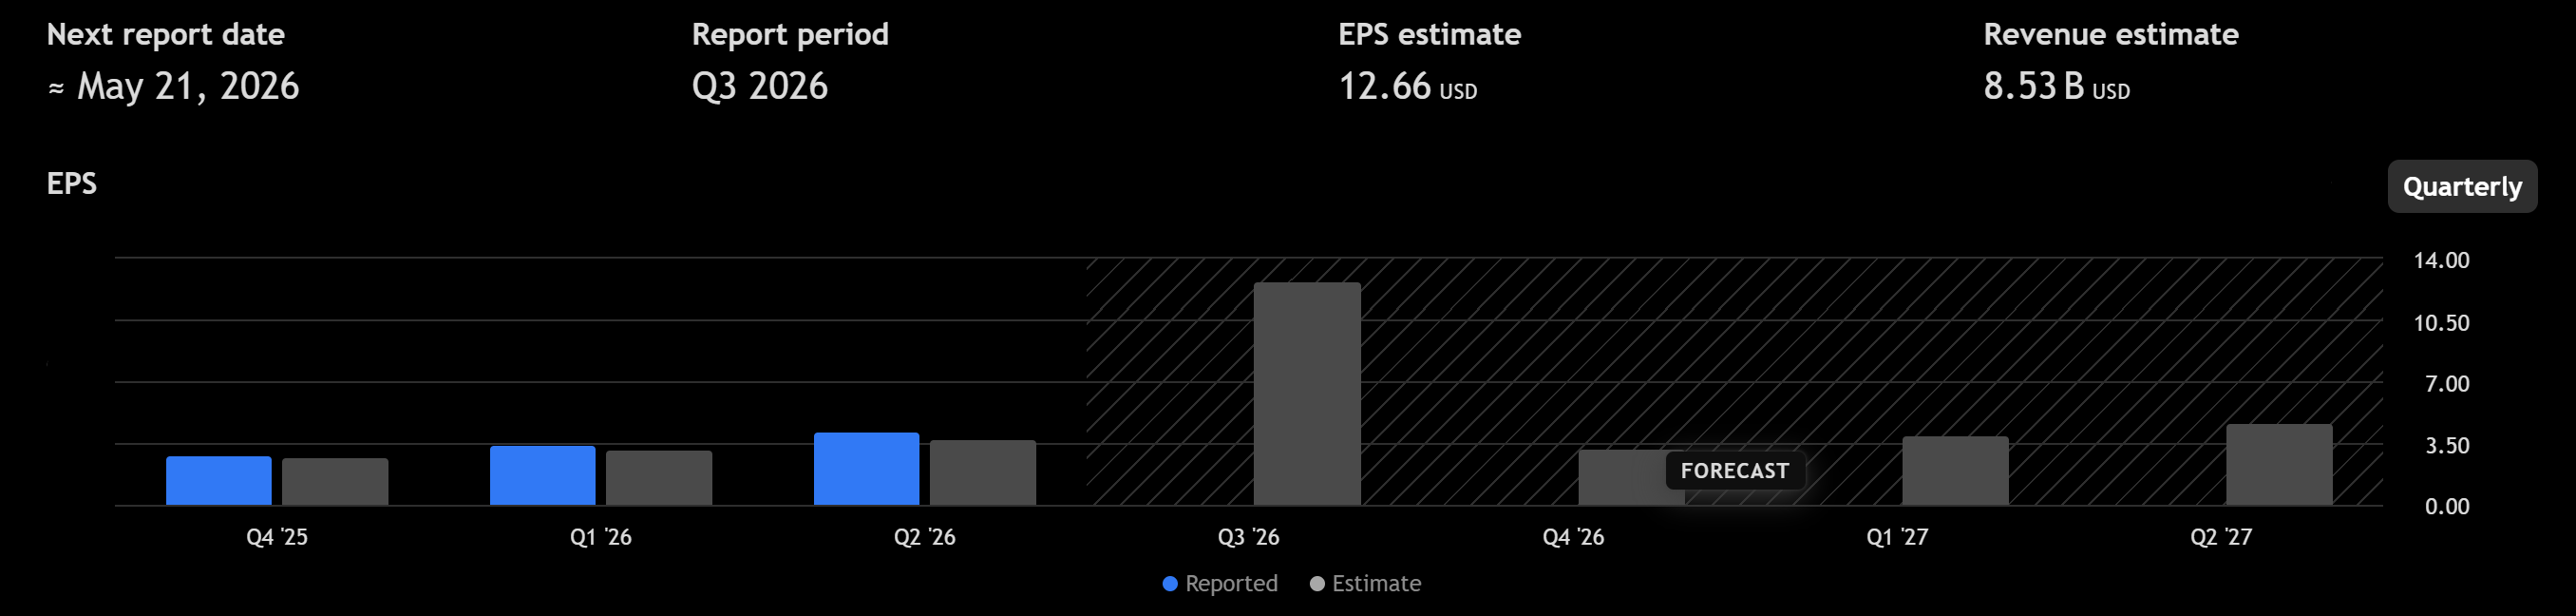
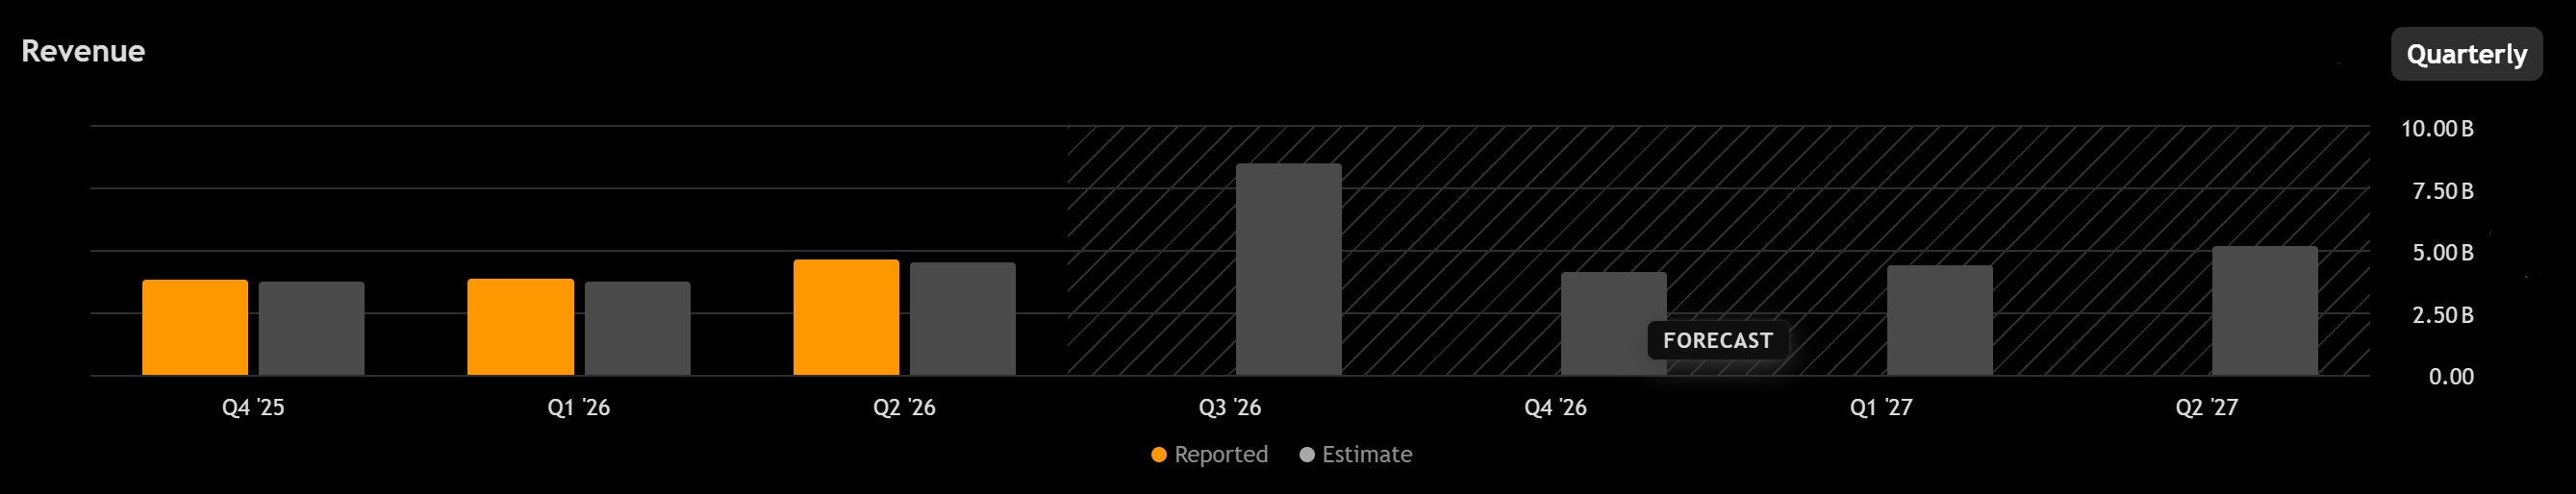
Guidance was reaffirmed in full. FY26 revenue guidance of $20.997B to $21.186B (12 to 13% growth), non-GAAP EPS of $22.98 to $23.18 (14 to 15% growth). With H1 already printing $8.54B at 18% growth, the implied H2 is achievable and the guide looks conservative. A raise may come with Q3 earnings in May once the tax season is fully counted.
Fundamental Analysis
The numbers say quality compounder. The price says fallen growth stock. One of them is wrong.
Revenue: $4.651B in Q2, $8.54B in H1. Full-year guide midpoint: $21.09B. Implied H2: $12.55B, which requires approximately 12.4% growth on a seasonally heavy half. Very achievable given current trajectory.
Operating leverage: H1 revenue growth of 18% vs. operating expense growth of 12%. The 6-point gap is generating 440 basis points of margin expansion. G&A fell as a percentage of revenue. This is structural efficiency, not cost cutting.
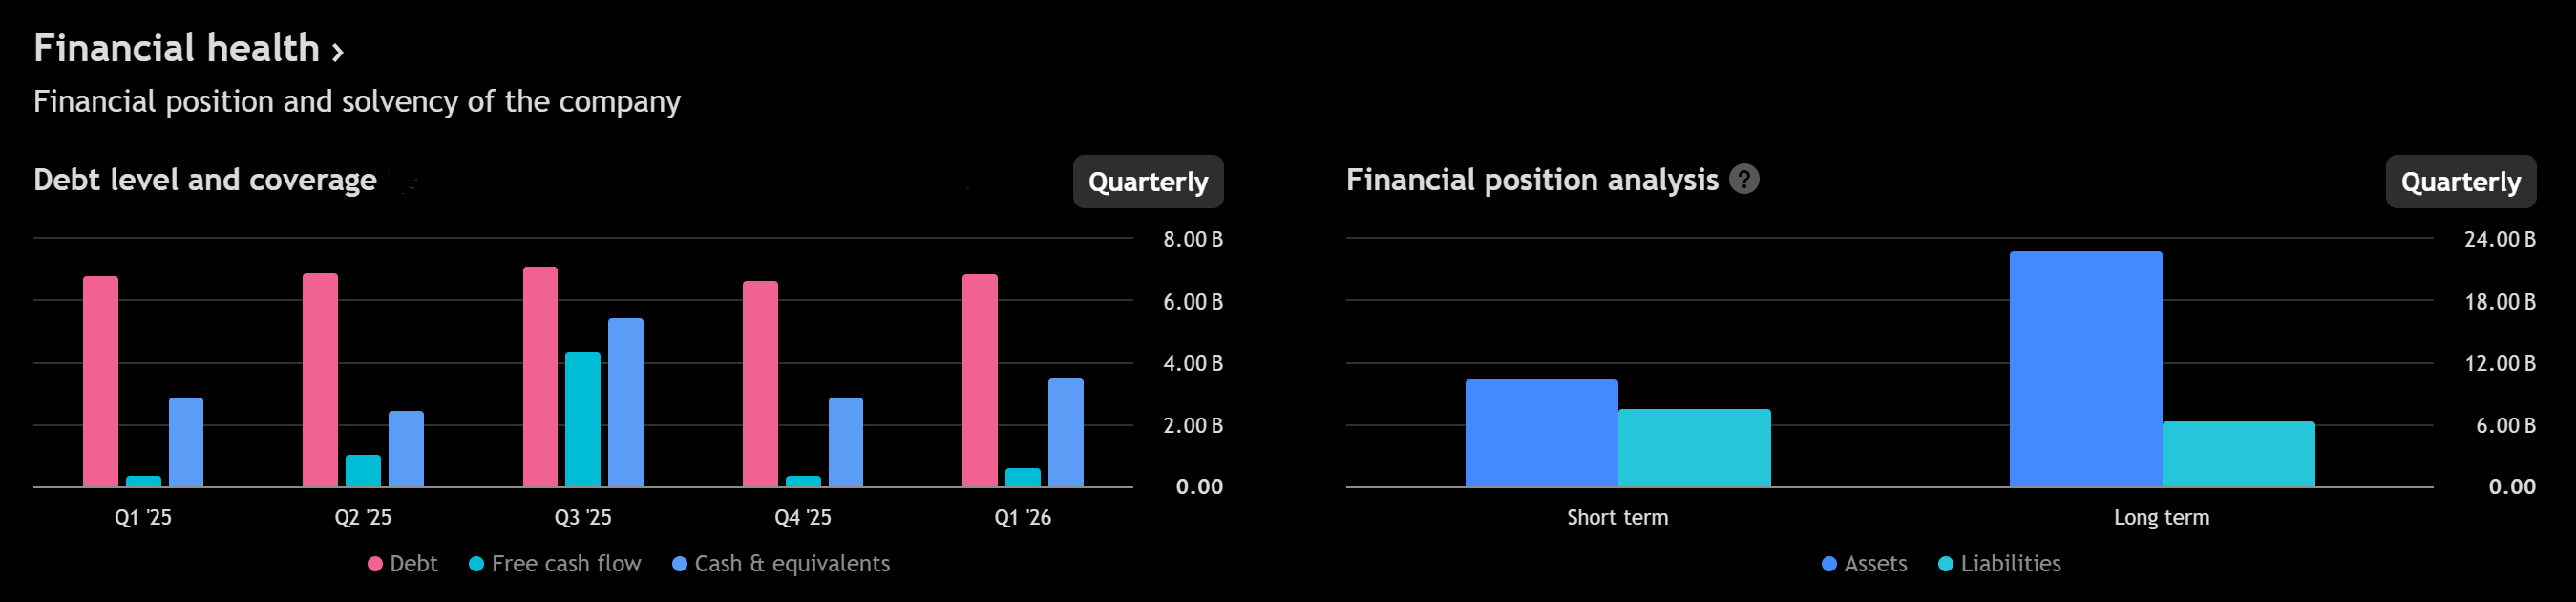
Capital return: $2.5B returned to shareholders in H1, representing 164% of free cash flow. $961M in buybacks in Q2 alone. Dividend raised 15% for April 2026. Management explicitly stated they are “meaningfully increasing” repurchases given confidence in the business. In January, they bought 802,791 shares at an average of $559.85. At $403 today, that conviction has only grown.
Balance sheet: $2.2B unsecured revolver extended to 2031. $750M in notes maturing September 2026 is well-covered by operating cash generation. No refinancing risk.

Valuation: At $403 and approximately 277.5 million shares outstanding, the market cap is roughly $112B. Against FY26 non-GAAP EPS guidance of approximately $23, the non-GAAP P/E is around 17.5x. That is not expensive for a business growing earnings 25%+ with widening margins and multiple long-duration growth drivers. On a GAAP basis, the multiple is higher and demands continued execution.
TAM context: Management cites a $300B total addressable market. At roughly $17B in annual revenue, Intuit is at approximately 5.7% penetration. The IES mid-market alone represents an estimated $90B TAM that is barely touched.

Base case: Guidance holds, IES continues accelerating, Credit Karma sustains double-digit growth, Mailchimp remains a drag but stabilizes. That path implies low-to-mid teens EPS growth, supporting a stock price in the $450 to $500 range over 12 to 18 months.
Bull case: IES becomes a breakout growth driver in FY27 and FY28, Anthropic and OpenAI partnerships generate incremental high-margin revenue, and Credit Karma sustains 15%+ annual growth. That scenario, on a 3 to 5 year view, supports a materially higher valuation.
Bear case: IRS free-file disruption returns under a different political environment, macro stress hits SMB credit quality above 7% charge-offs, and consumer spending weakness pressures both TurboTax and Credit Karma simultaneously. Low joint probability, but not zero.
The asymmetry favors the bull case. Each bear case element requires a separate, independent negative event. The bull case requires only the continuation of trends already demonstrably in motion.
Intuit is executing well by every measurable standard. The stock has been sold as if the business is deteriorating. It isn’t. At current prices, long-term investors are being given a quality entry point that doesn’t appear often in large-cap software.
Technical Analysis
The damage is real. So is the first cluster of genuine reversal signals in months.
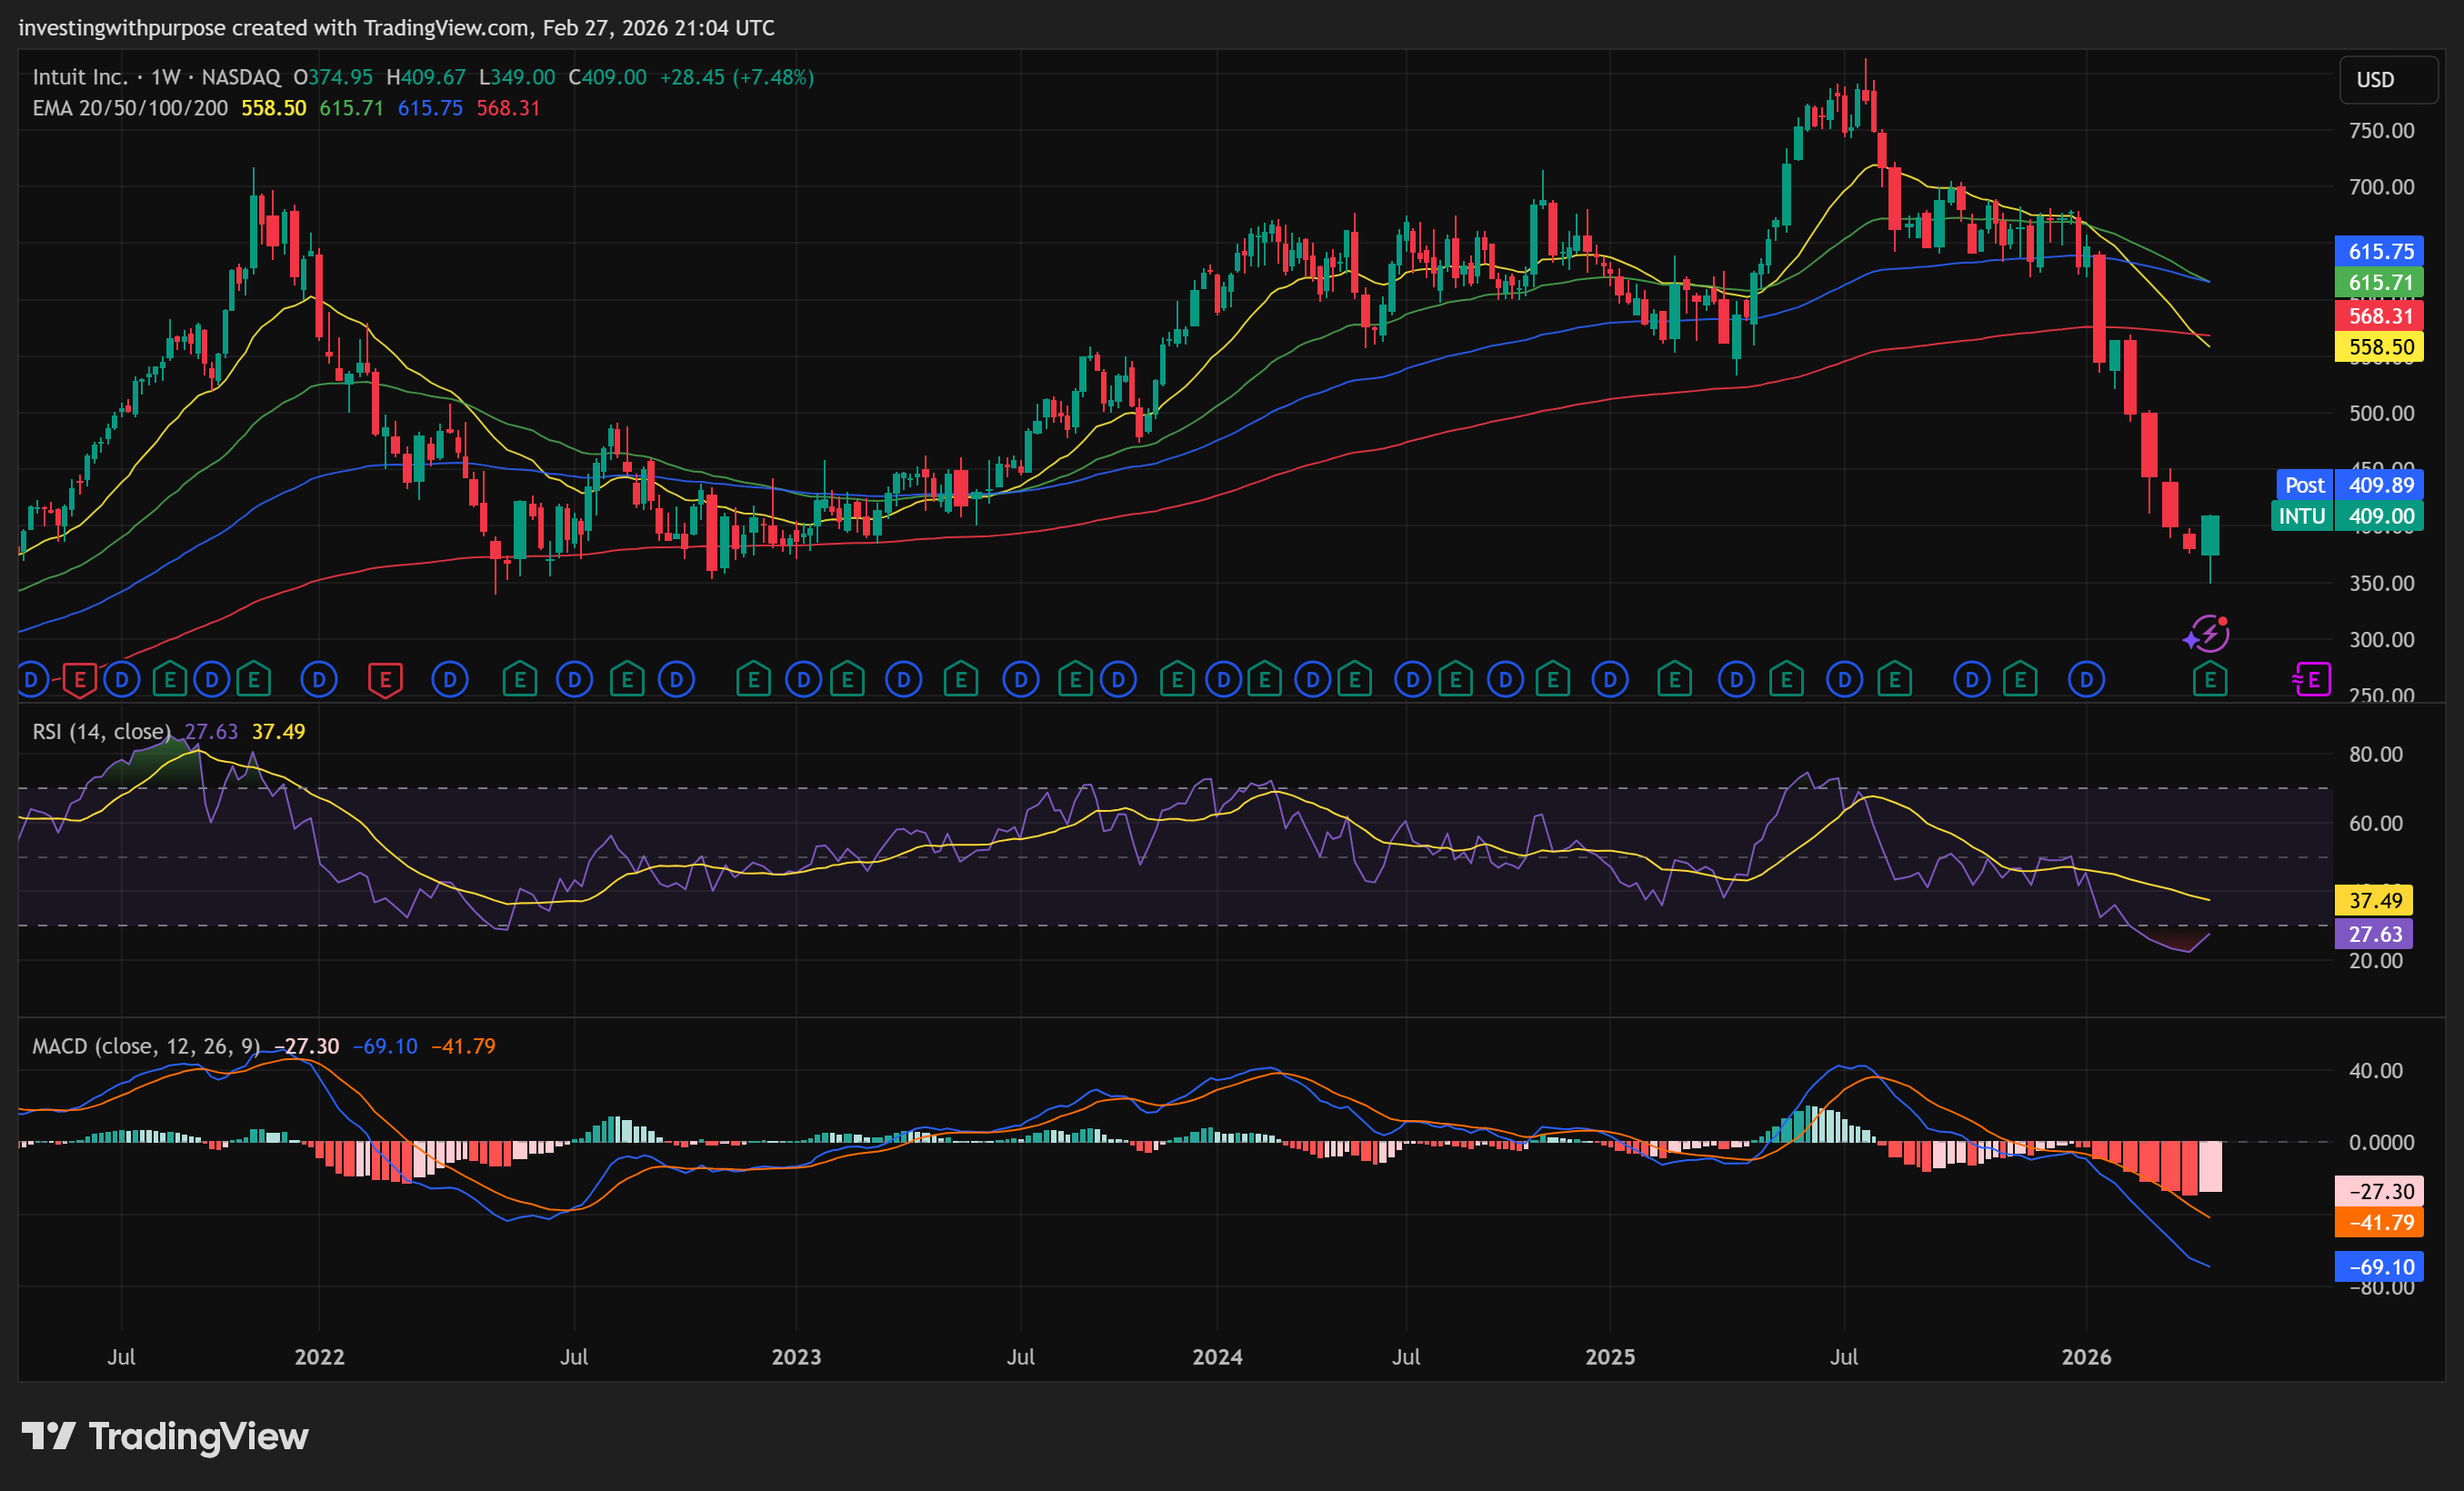
The structural reality is severe and should not be minimized. INTU fell 57% from its $813.70 all-time high to the $349.00 low on February 23. Every major moving average is declining and stacked bearishly. The 20-day exponential moving average sits at $420.56, the 50-day near $500, and the 200-day near $611. Price has not closed above the 20-day EMA since early January. The Ichimoku cloud spans roughly $418 to $515 overhead, and the projected cloud remains bearish for weeks forward. This is a stock in a structural downtrend, and treating it otherwise would be dishonest.
That said, the February 23 to 27 price action is the first genuine cluster of positive signals since the August 2025 peak.
The double bottom and divergence. Price made a lower low at $349 on February 23 versus the February 3 low of $427. But the 14-period RSI at the February 23 low was 18.4, higher than the 17.1 reading at the February 3 low. That is a confirmed multi-week bullish RSI divergence, meaning downside momentum was fading even as price made a new low. Divergences of this length and severity, on weekly RSI readings of 26, on a fundamentally sound large-cap, are historically associated with major lows or the early stages of base formation.
The reversal candle sequence. February 25 produced one of the cleanest bullish reversal candles of the entire decline: an 88% body candle closing at $395 with no meaningful upper wick. That is exhaustion selling resolving into genuine buying. February 26 and 27 showed upper wicks above $407, signaling that overhead sellers are present above that level but haven’t overwhelmed the buyers yet.
Momentum is shifting in sequence. The MACD histogram turned positive on February 25, before price had recovered meaningfully. That is a leading indicator: momentum is improving before price confirms. The directional indicator gap (a measure of trend strength) has collapsed from minus 43 in mid-February to approximately minus 6 today, meaning the directional crossover that would formally confirm a new uptrend is close. The ADX, a trend strength reading, peaked at 77.49 on February 24. It is now pulling back from extreme levels. When trend strength peaks at that magnitude and reverses, it is a meaningful signal.
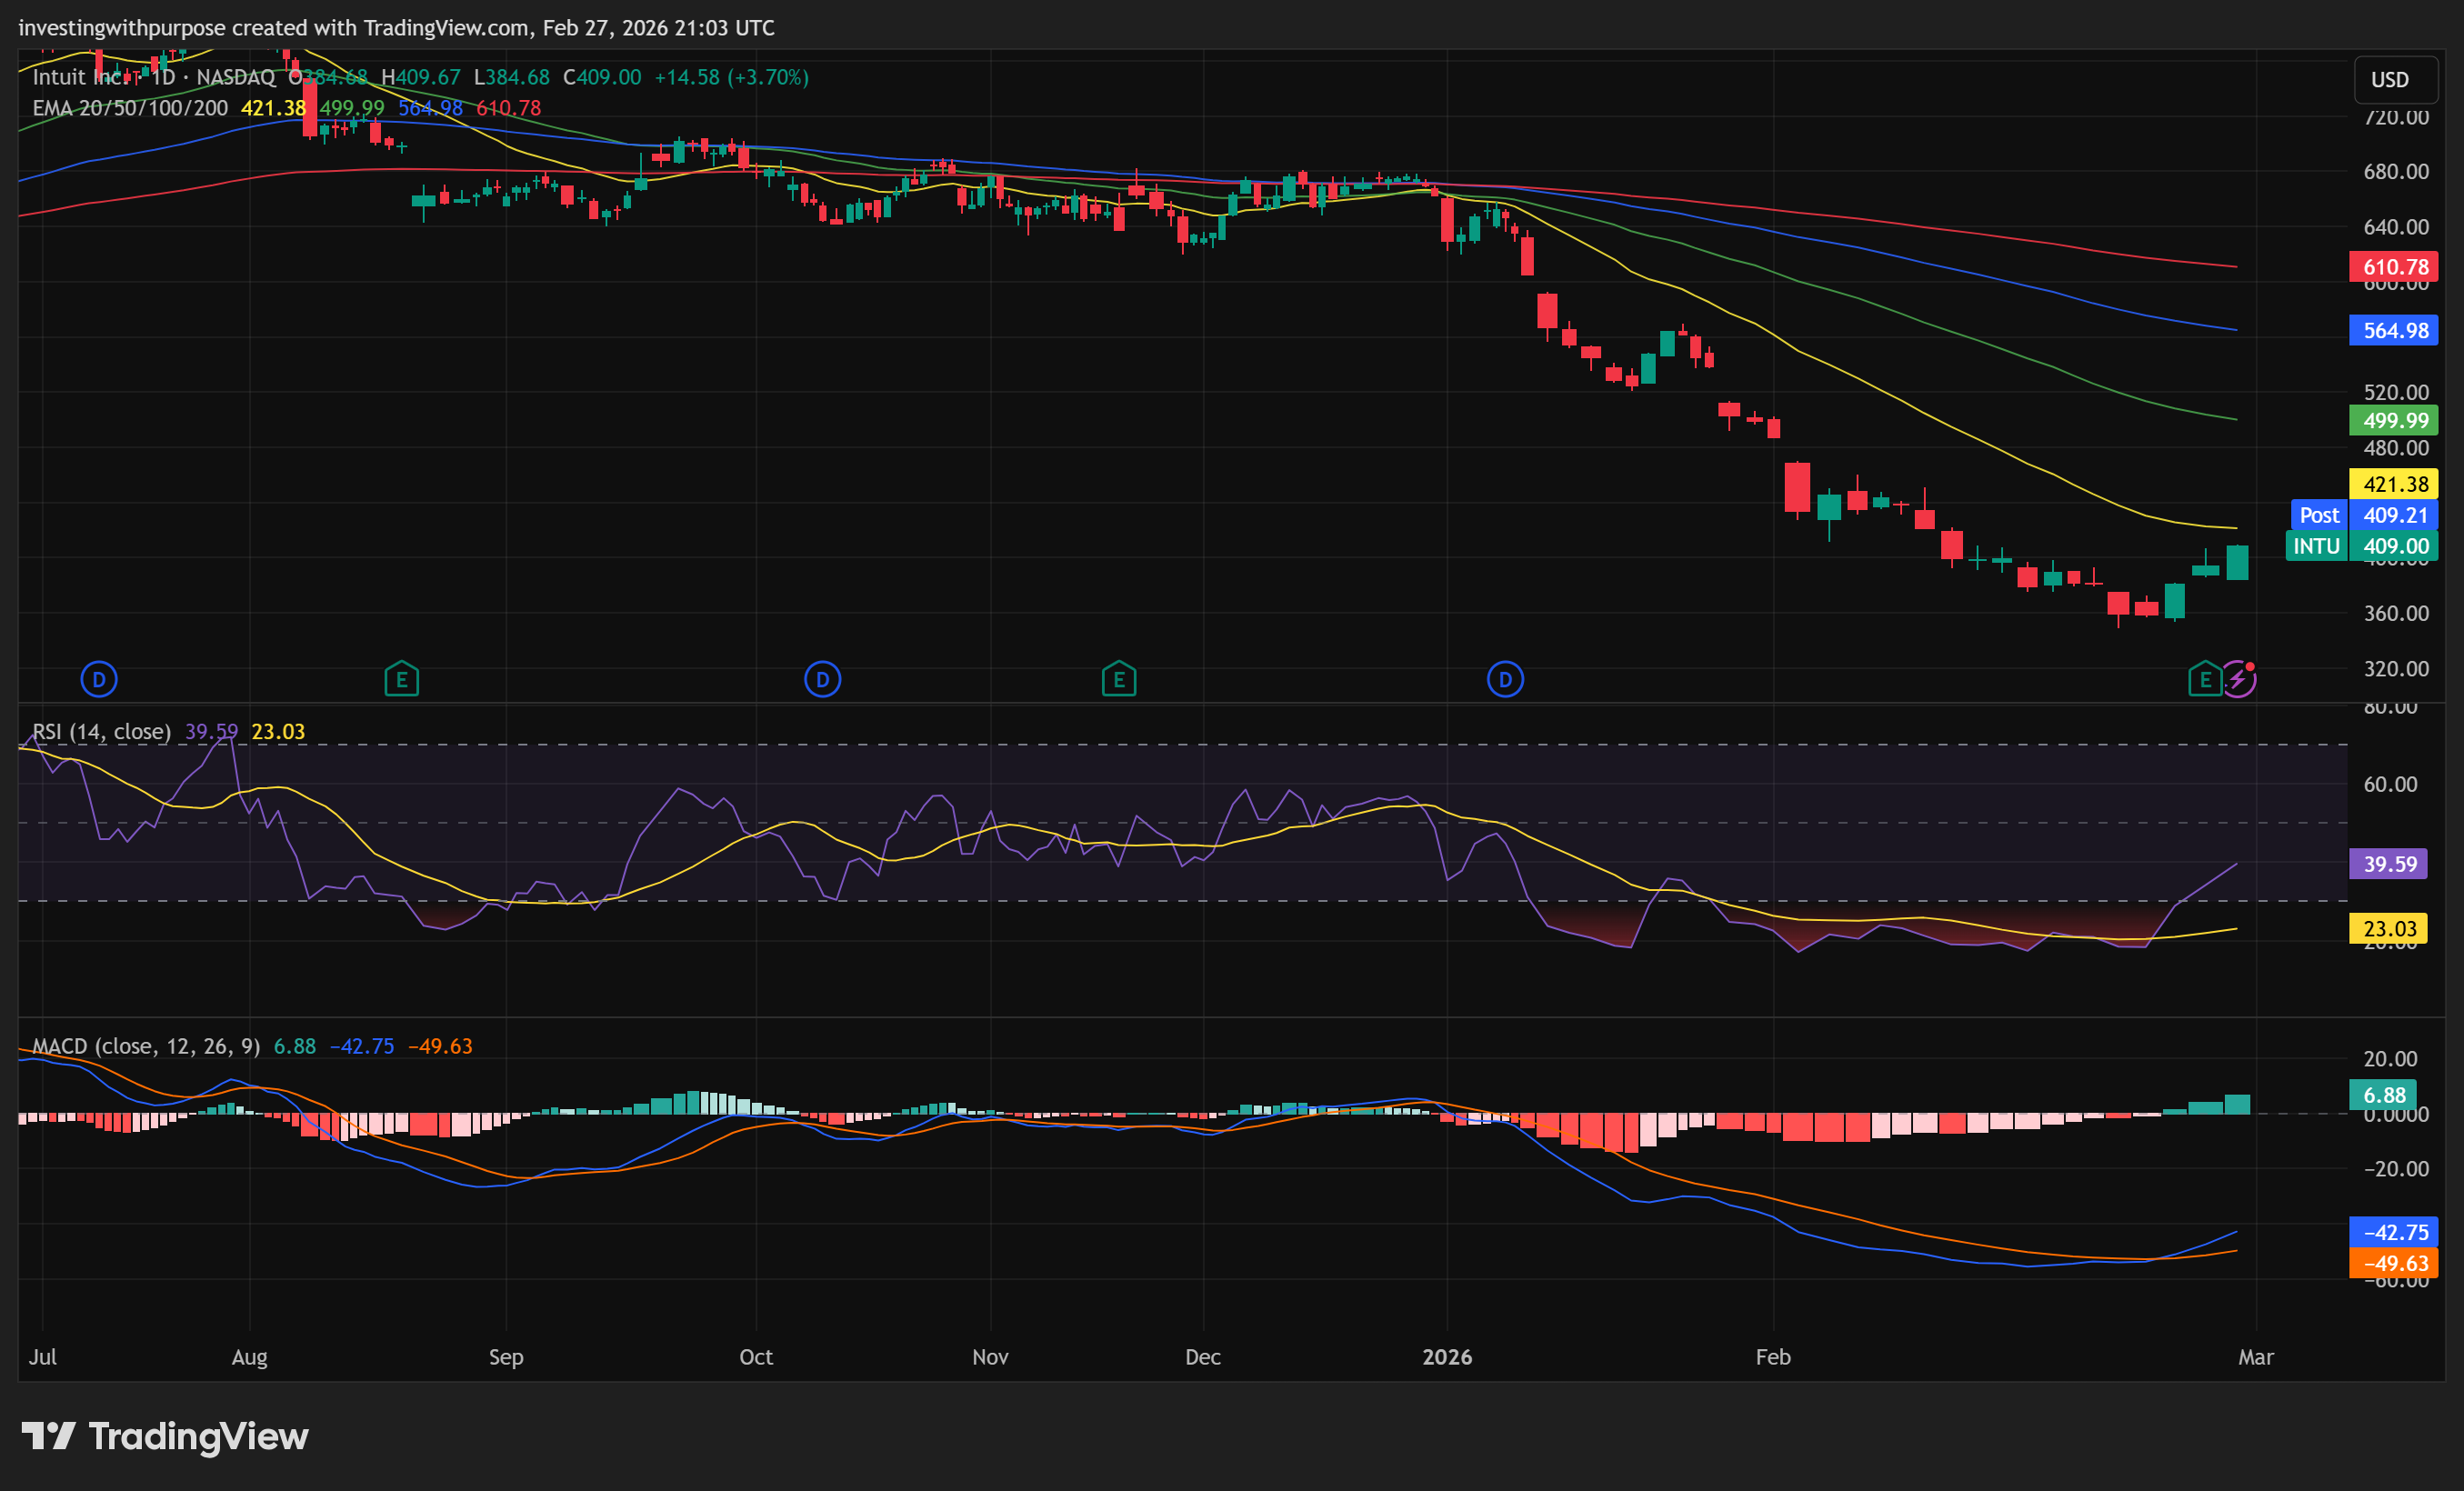
Short-term momentum is already overbought. The Stochastic oscillator is near 50 and the short-term RSI has moved from 17 to 36 in 4 days. That is fast. A consolidation or minor pullback before the next push is the most likely near-term path.
Key levels and what they mean. The $349 low is the structural foundation. Everything above it is valid. A close back below it on volume would be technically devastating, opening extension targets near $312 and potentially lower. The $375 to $392 zone is where any healthy pullback should find buyers if the reversal is genuine. The $407 to $420 zone is the first major test: it contains the 20-day EMA at $420.56, the Bollinger Band midline at $411, and a Fibonacci convergence zone. Breaking above this cluster on volume, with RSI holding above 40, would be the first meaningful confirmation that the trend has shifted.
Medium-term picture. The weekly RSI at 26 and weekly Stochastic near absolute zero are the kinds of readings that precede major bottoms in quality large-cap stocks. They don’t guarantee the low is in. But they mark a zone where the risk of continuing to short is very high and the reward for being long begins to outweigh the risk, particularly when the fundamental picture is improving simultaneously.
INTU remains structurally bearish on every intermediate and longer timeframe. But the signals from the February 23 to 27 period are the most constructive in months. The $349 low is the line. The $420 level is the first confirmation. Between them is a trade worth understanding.
Trade Plan
Two entries, one invalidation, clear targets. Position sizing is not optional.
Pullback Entry (Lower Risk, More Patient)
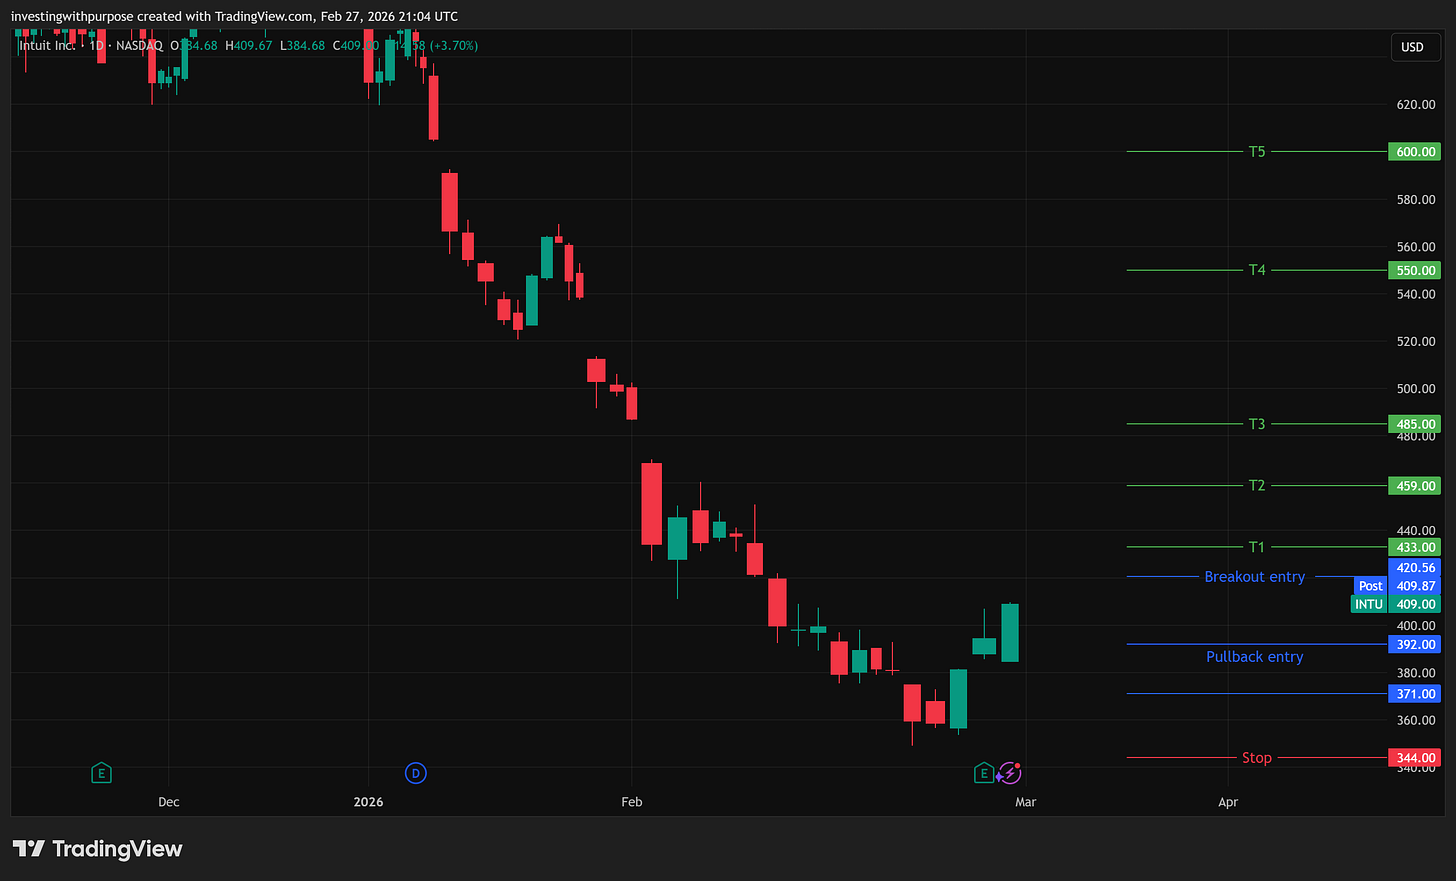
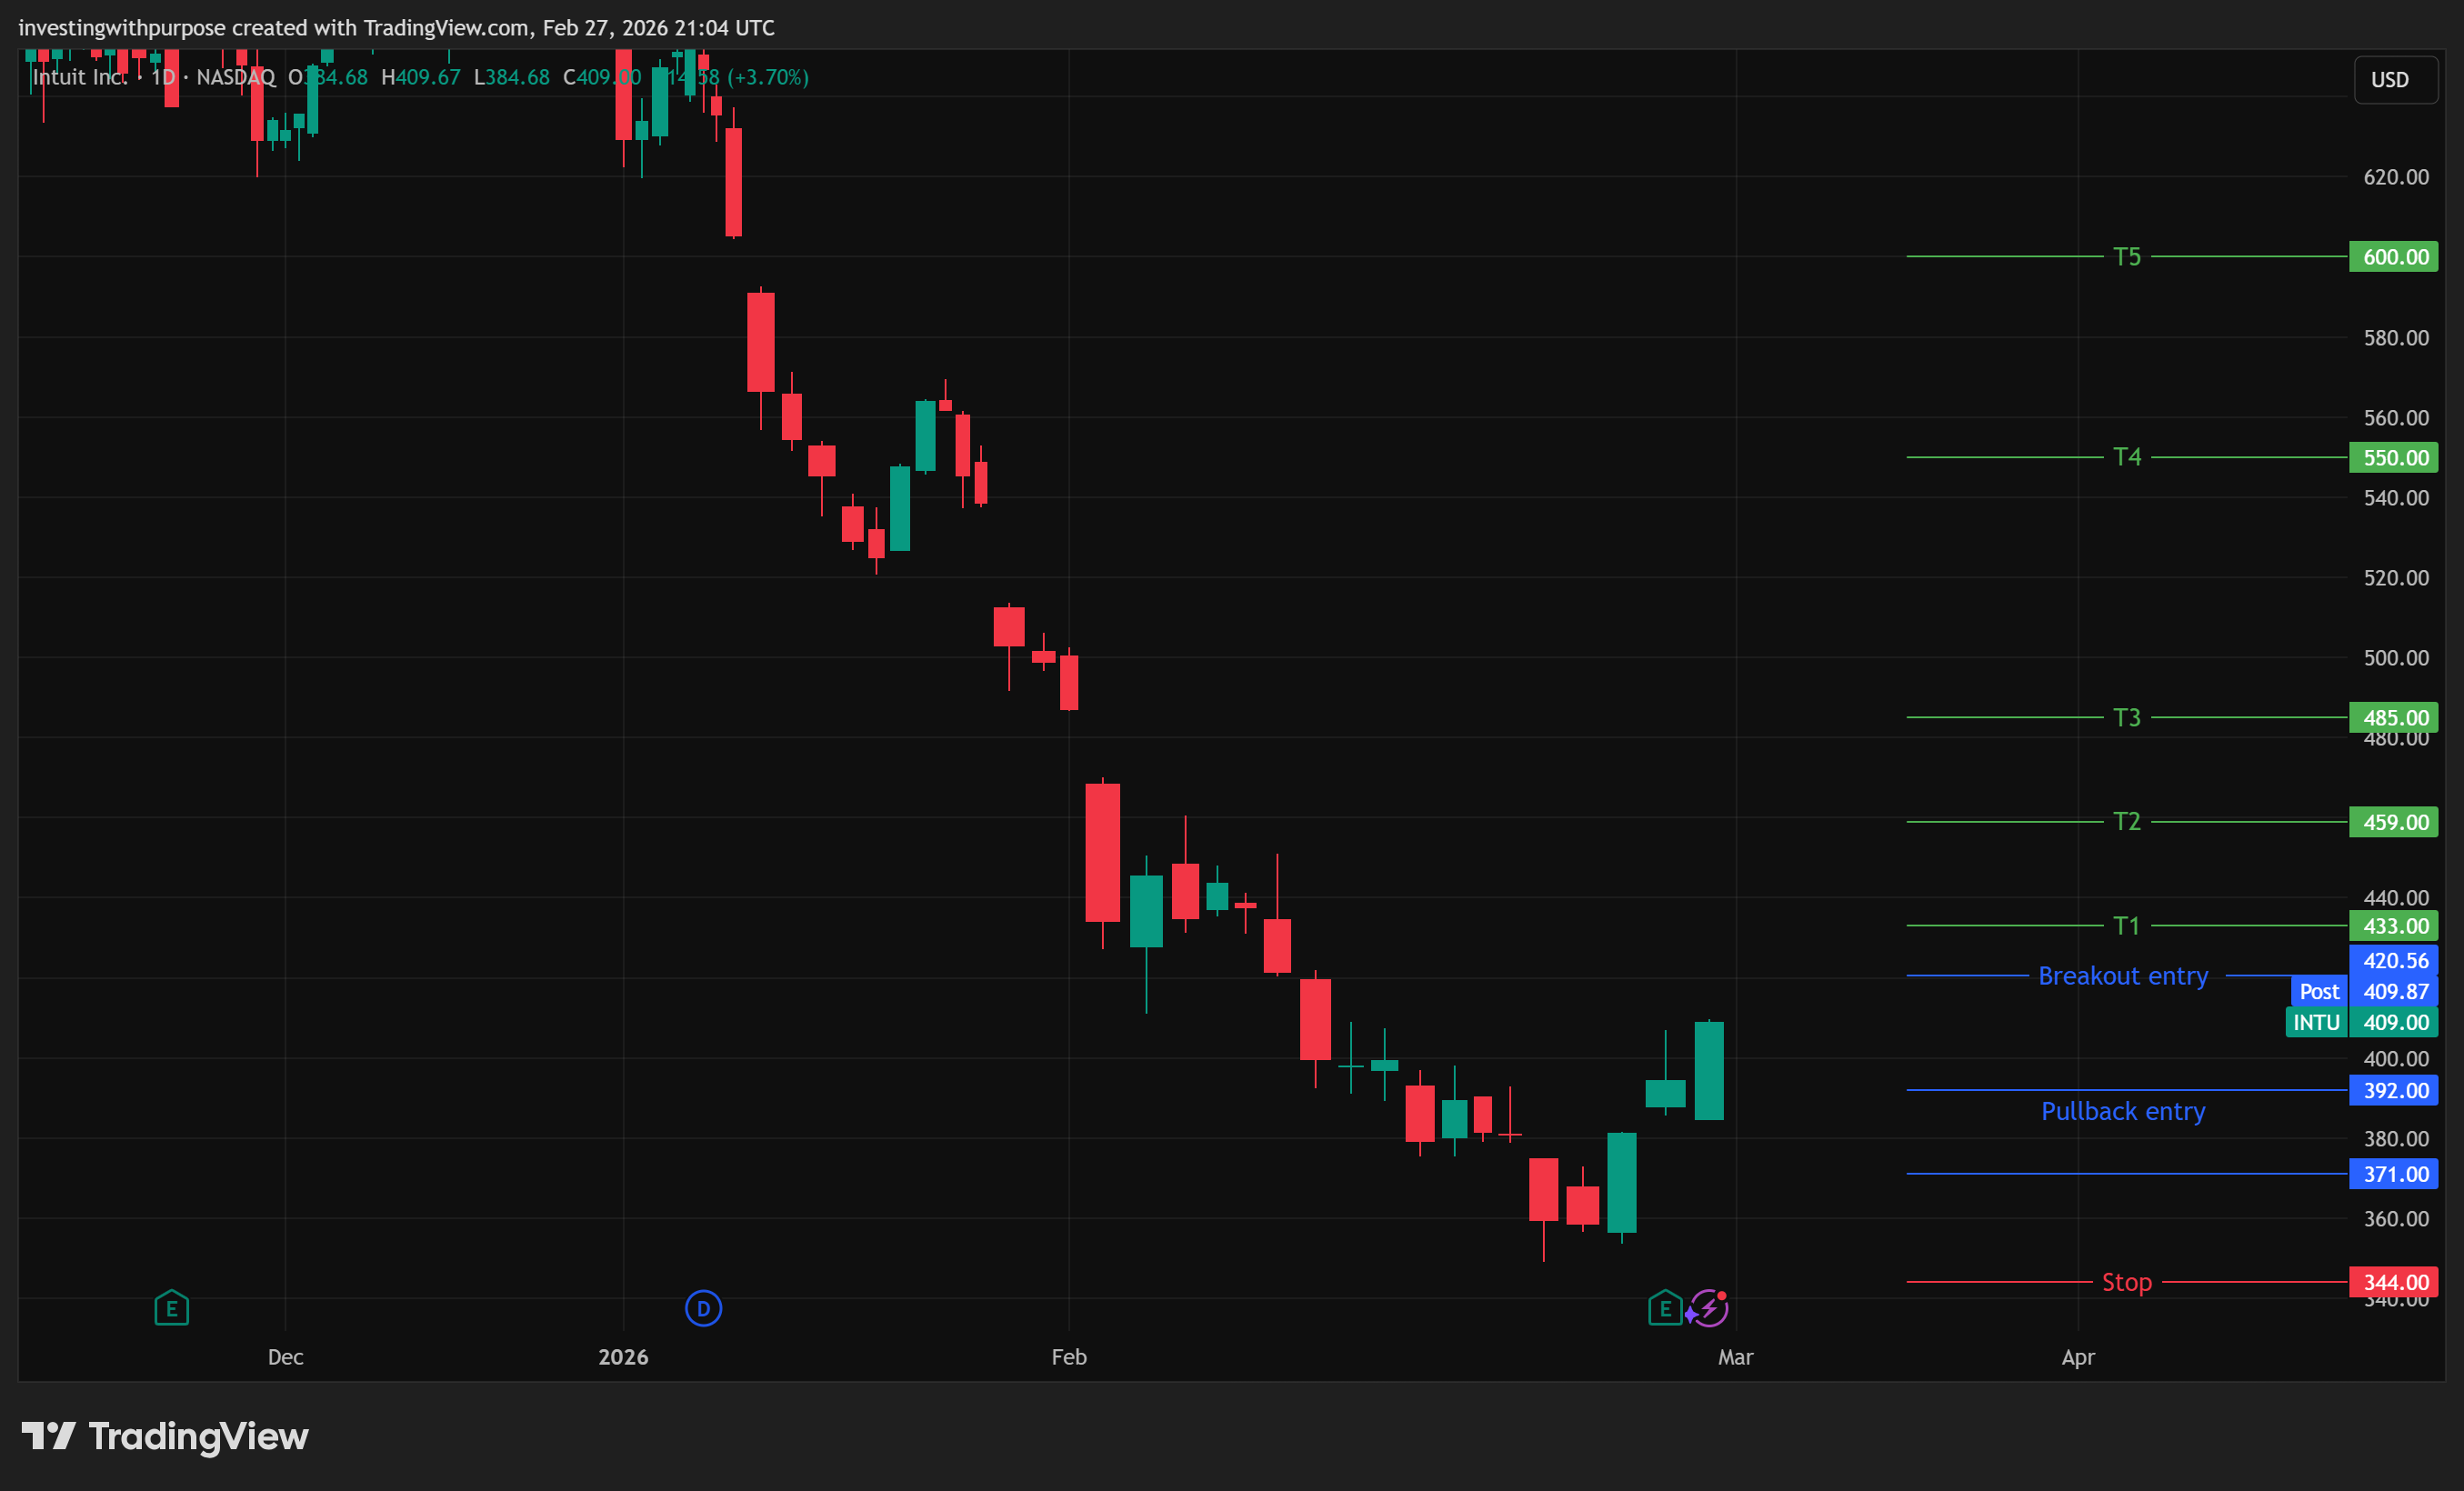
Entry zone: $371 to $392. This is the first logical retracement into support after the initial bounce, coinciding with the area where the double bottom base structure offers buyers a natural re-entry.
What confirms it: Pullback volume should be lighter than the February 26 rally volume. A stabilizing candle, whether a doji, hammer, or bullish engulfing, at the bottom of this zone adds confidence. RSI should not make a new low below 18 on the pullback; that would break the divergence structure.
Stop: Hard stop below $344, which is below the $349 double bottom with a $5 buffer. A daily close below this level invalidates the entire setup.
Risk per share: approximately $27 to $48 depending on exact entry.
Breakout Entry (Lower Frustration, Higher Confirmation)
Entry: A full daily close above $420.56 on above-average volume (the 20-day average is approximately 5.2 million shares). An intraday spike that closes back below does not count.
What it confirms: The 20-day EMA has been reclaimed, RSI has broken above 40 for the first time since the decline began, and the MACD histogram has remained positive through the consolidation. This is the first structural sign that the intermediate downtrend has shifted.
Stop: $392, below the prior consolidation base and below the Bollinger Band midline. Risk per share: approximately $28 to $30.
Invalidation Level: $344 on a closing basis, with confirmation volume. This is the invalidation for the entire bull thesis. Below it, the Elliott Wave framework opens extension targets near $312, and the technical picture deteriorates sharply. Below $344, there is no clean structural support until the $288 to $300 zone.
Price Targets
Target 1: $433. Fibonacci resistance at the 0.382 retracement of the full decline, and the first area where prior buyers are sitting at a loss and will want to exit. Take partial profits here (25 to 30% of position), move stop to breakeven.
Target 2: $459 to $485. The 0.5 to 0.618 Fibonacci retracement zone. At $485, the 50-day EMA begins to converge. This is a natural area of resistance for the first meaningful recovery leg. Take another partial here (25% of position), trail stop.
Target 3 (medium-term, fundamental basis): $550 to $600. The level at which the stock begins to discount the IES inflection and AI monetization. This target requires 6 to 12 months and fundamental confirmation through Q3 and Q4 earnings.
Target 4 (long-term, full bull case): $700 and above. Only if IES becomes a breakout growth driver and the Anthropic partnership generates measurable incremental revenue. A 2 to 3 year horizon.
Rolling Stop Logic
After Target 1: Move stop to entry price (breakeven). Risk is off the table.
After Target 2: Trail stop to just below Target 1 ($420 to $430). Lock in partial gains.
Above $485: Trail stop 8 to 10% below the most recent swing high. Let the position run.
Position Sizing: Be mindful for position sizing. Diversification is the most important risk mitigation technique. A reasonable allocation would be 1-2% of portfolio.
Bottom Line
INTU is not a trade for the impatient. The structural damage is real, the bounce is early, and there are legitimate concerns in credit quality and Mailchimp that deserve ongoing attention. Anyone expecting a smooth ride from $403 back to $600 is likely to be tested.
But here is what’s also true. This is a business that just reported 44% operating income growth while the stock was pricing in permanent impairment. The mid-market engine is accelerating. Credit Karma is back. AI is generating measurable per-customer value. Management is buying aggressively. And the stock just formed the first clean technical reversal pattern in 7 months at an extreme oversold level that has historically preceded major bottoms in quality large-cap technology.
For medium-to-long-term investors, INTU is becoming actionable, not fully confirmed. The pullback entry in the $371 to $392 zone offers a compelling risk-reward for investors willing to size correctly and hold their nerve. The breakout above $420 offers a more confirmed entry for investors who want structure before committing.
The single most important level is $344 on a daily closing basis. Below it, the thesis is invalidated and discipline requires stepping aside. Above it, this is one of the more asymmetric setups in large-cap technology right now.
The content published on Investing With Purpose is for informational and educational purposes only. It does not constitute financial advice, investment recommendations, or an offer to buy or sell any security. All analysis reflects the author's independent research and opinions at the time of writing and may change without notice. Investing involves risk, including the possible loss of principal. Past performance is not indicative of future results.