

The Two Monopolies Behind the AI Build-Out
TSMC and ASML sit at opposite ends of the same value chain. One is quietly firing on all cylinders. The other is flashing a subtle caution flag. Here's how to read both and how to position.

Every cycle has its infrastructure names, and this one has two that matter more than the rest. Taiwan Semiconductor and ASML aren’t just “AI plays.” They’re the physical substrate of the entire compute boom. Without TSMC’s 2 nanometer wafers, Nvidia has no GPUs to sell. Without ASML’s lithography machines, TSMC has no 2 nanometer wafers to make.
They often get lumped together in the same thesis, and in some ways they deserve to be. But if you look closely, they’re running very different playbooks right now. The setups are not identical, the risks are not symmetric, and the entries you want in each are in very different places.
This is a walkthrough of both, done the way a disciplined medium to long term investor would approach them. Fundamentals, multi-timeframe structure, honest risk flags, and a clear plan for both pullback and breakout entries. No hype, no hand-waving.

Key Takeaways
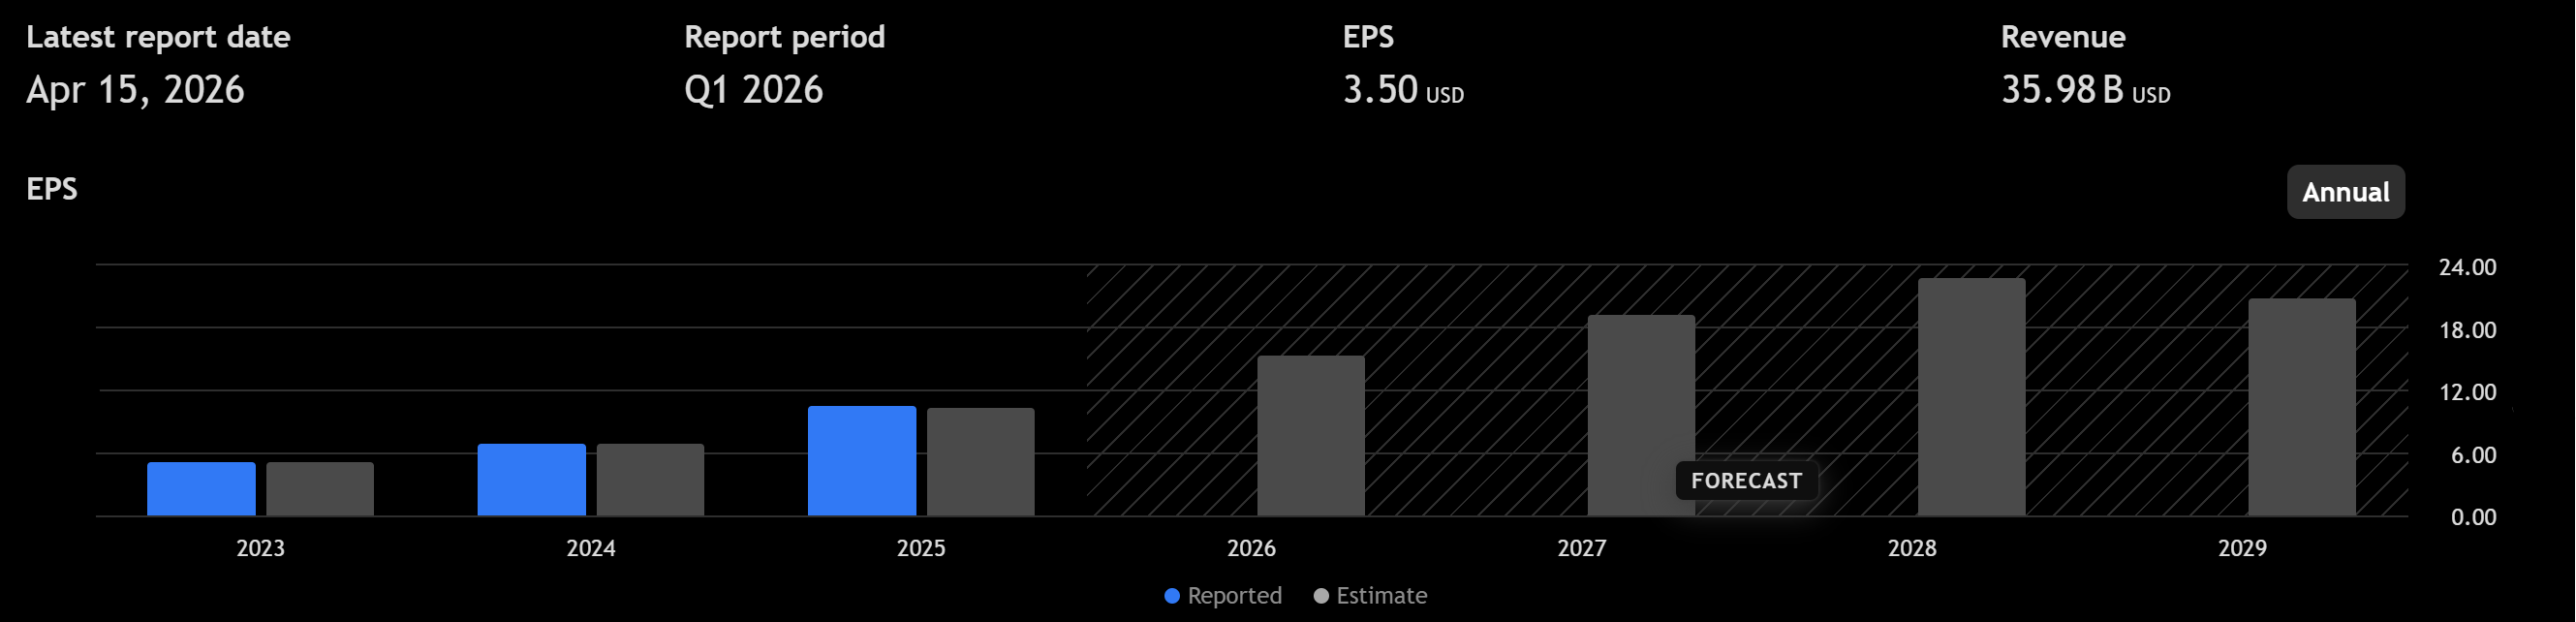
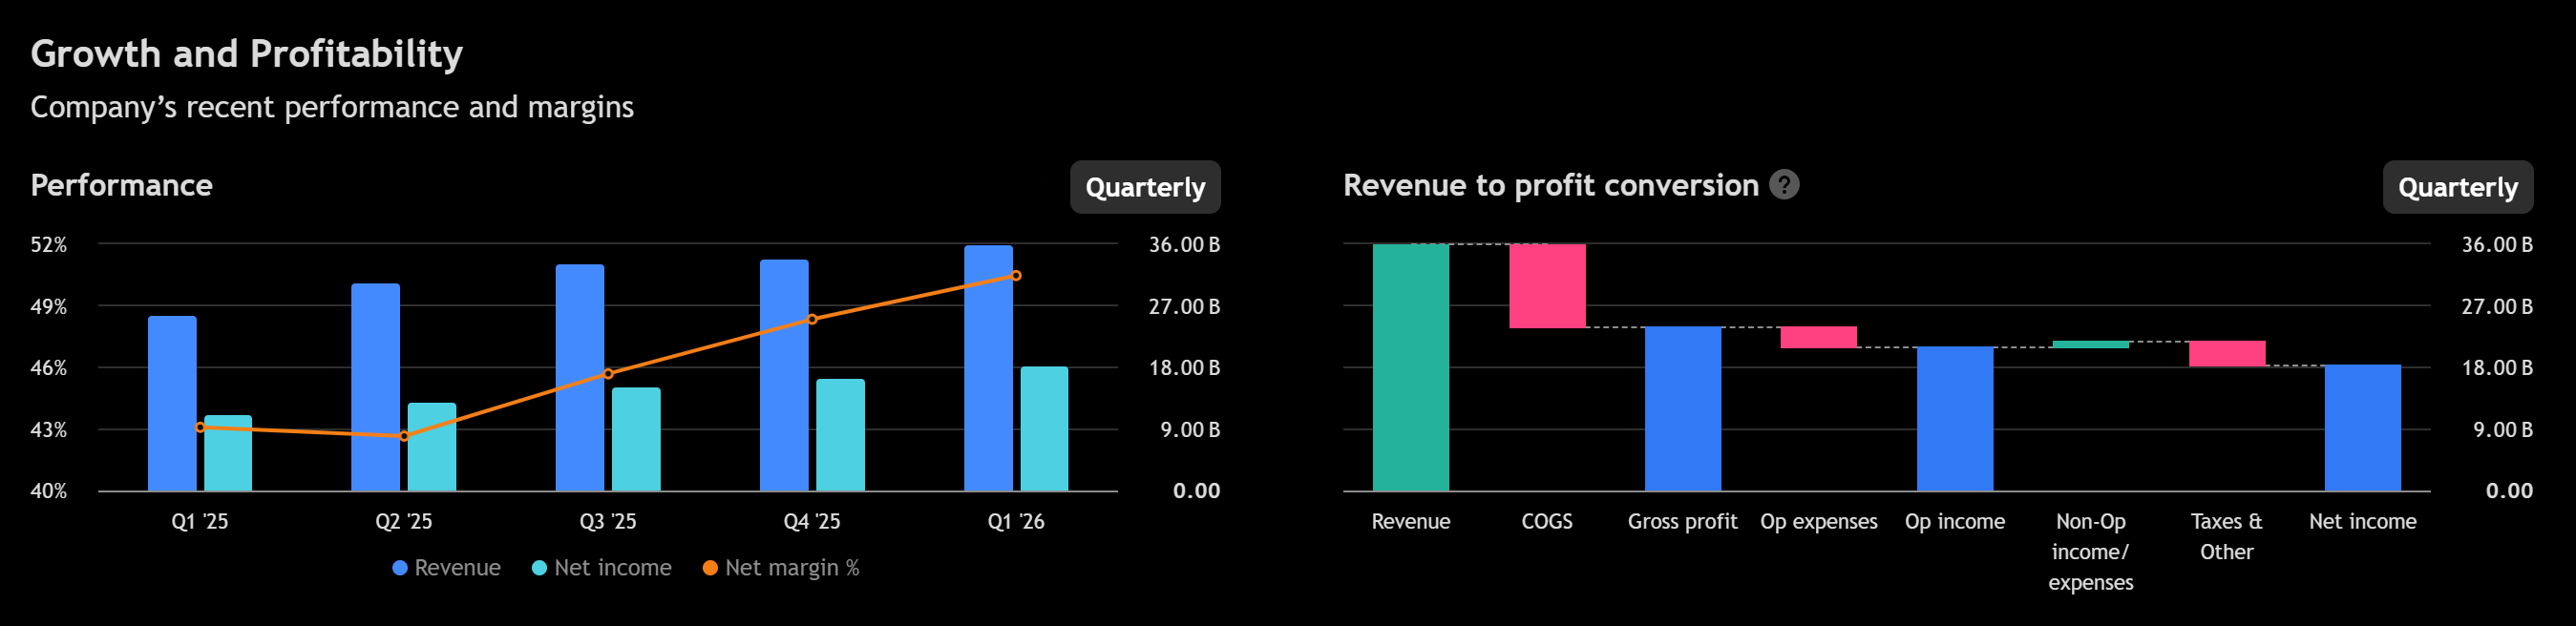
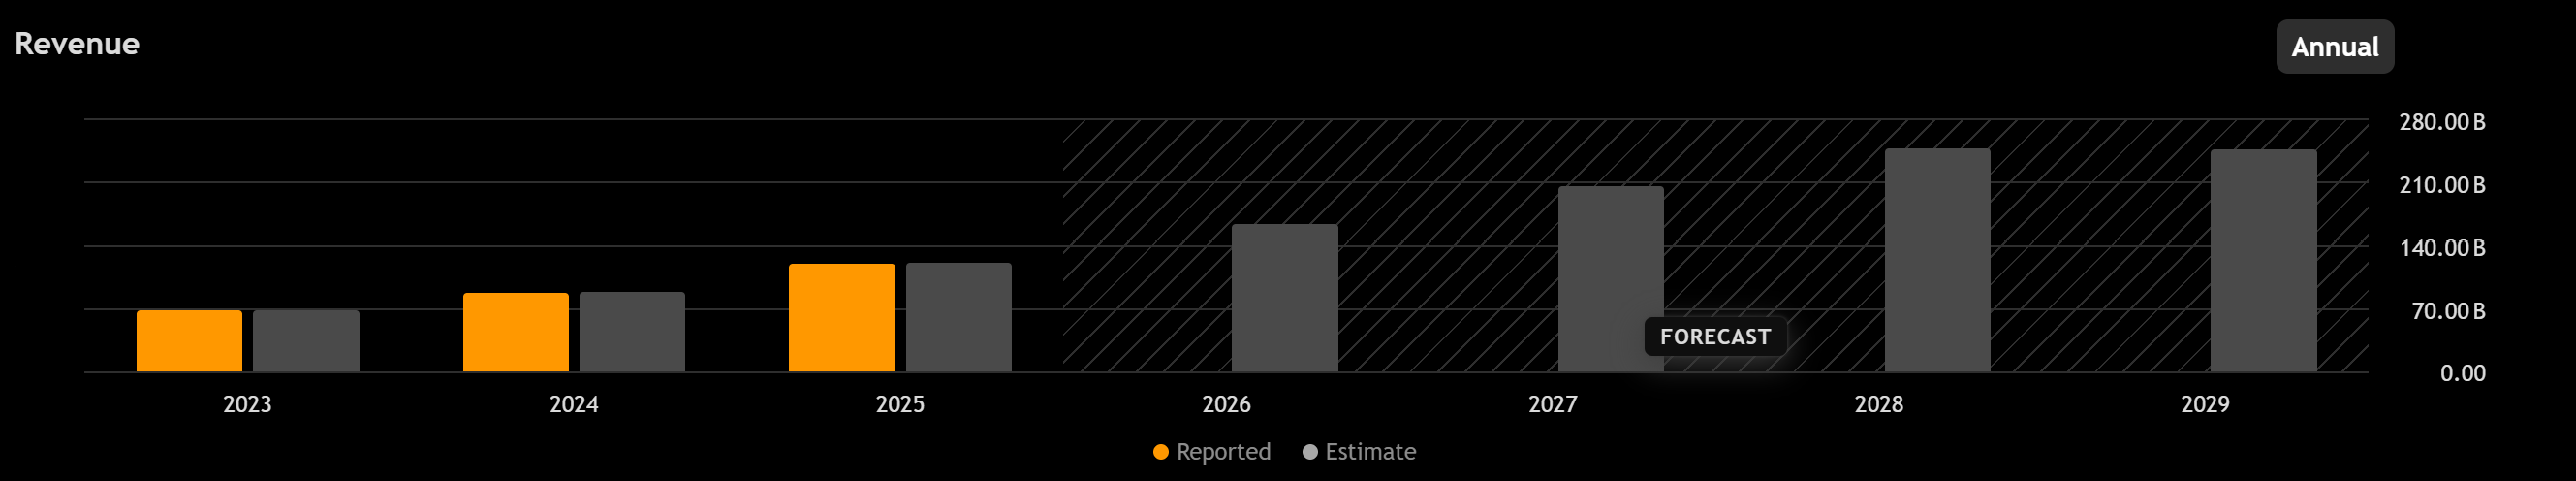
TSMC (TSM). Best-in-class quarter. Revenue up 35 percent year over year to 35.9 billion dollars.
Gross margin jumped to 66.2 percent, well above their own guidance. Multi-timeframe uptrend fully intact.
Daily momentum expanding. No bearish divergence. The cleanest large-cap technology setup in this group.
Prefer pullback entries into the 360 to 363 zone; breakout trigger above 391.
ASML. Still the only EUV lithography shop on earth, and a guidance raise confirmed the backlog is strong.
But a few things deserve attention: the daily chart has a confirmed bearish RSI divergence, management quietly stopped disclosing order bookings, China exposure is shrinking fast, and a new US export bill (the MATCH Act) threatens DUV sales.
Structure is bullish, internals are softer. Engage on pullbacks or on a clean breakout above 1,550 with momentum confirmation.
The pair. Both are late-cycle and extended. TSMC is the cleaner long. ASML is still a core holding but deserves either smaller sizing or a hedge given the near-term asymmetry.
TSMC: The Foundry That Doesn’t Miss
Why this matters right now
TSMC just delivered what may be the single most important print in the entire semiconductor complex this quarter. Revenue of 35.9 billion dollars came in above the top of their own guidance range. Gross margin printed at 66.2 percent against a guide of 63 to 65 percent. Operating margin hit 58 percent. Net income rose 58 percent year over year.
The really important detail: this happened while they’re ramping 2 nanometer, a new node that historically dilutes gross margin by 200 to 300 basis points in the early innings. They beat anyway. That’s a quality signal, not a cyclical one.
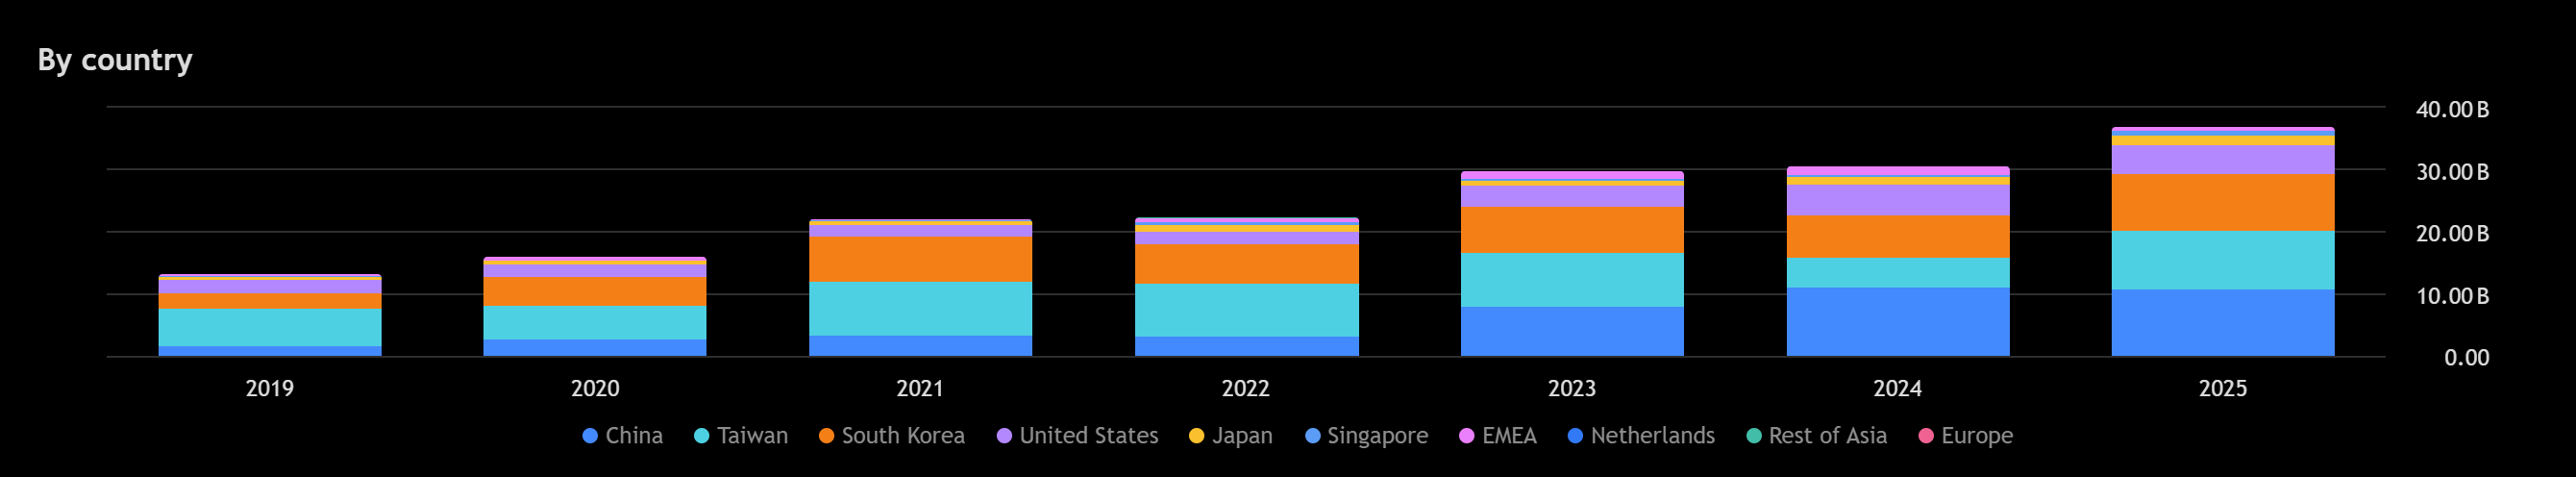
High performance computing (meaning AI accelerators, networking chips, custom silicon for hyperscalers) now accounts for 61 percent of revenue, up 20 percent sequentially. Smartphones, by contrast, have drifted from 45 percent of revenue a few years ago to around 28 percent today. The business has quietly re-platformed from an Apple iPhone cycle into a hyperscaler capex cycle.
The business, in plain terms
TSMC runs roughly 70 percent of the global foundry market and something closer to 90 percent at the leading edge. Its nearest competitors at 2 nanometer are Samsung (yields still weaker) and Intel (betting on a different lithography approach). For all practical purposes, if you want the best silicon on the planet, you go to TSMC.
Capital intensity is the cost of staying in that position. Management guided 2026 capex to the high end of a 52 to 56 billion dollar range. For context, they spent 40.9 billion in 2025 and 28.9 billion in 2024. About 70 to 80 percent of the new spend goes to advanced nodes (N3, N2, and beyond), with the rest going to advanced packaging (the CoWoS platform that Nvidia and AMD rely on) and specialty technologies.
The Arizona second fab has been pulled forward to 2027, a full year earlier than originally scheduled, and it will produce 3 nanometer chips. Kumamoto phase two is on track for 2028. Dresden enters pilot production in 2027. Each of these fabs represents roughly 15 billion dollars of equipment orders, and most of those orders flow right back to ASML and its peers.
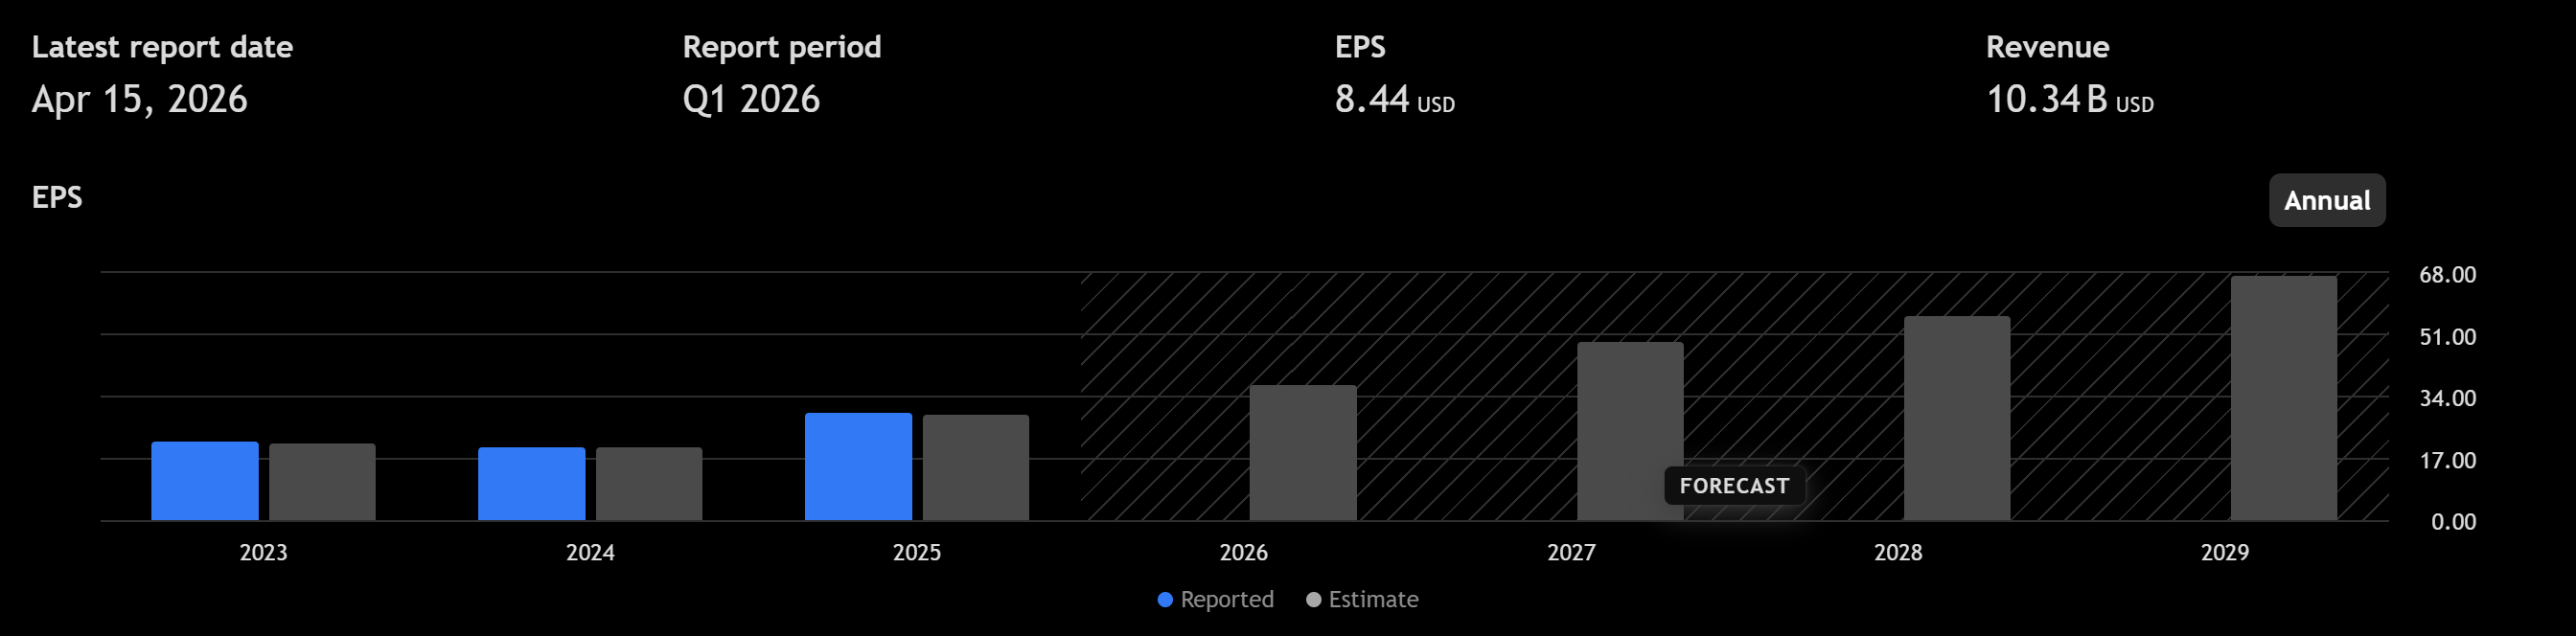
Fundamentals, with the numbers that matter
Full year 2025 revenue was 3.85 trillion Taiwan dollars, which translates to roughly 120 billion US dollars. That’s up from 2.89 trillion in 2024, a 33 percent jump. Gross margin expanded from 56 percent to 60 percent. Net margin went from 40 percent to 45 percent. In Q1 2026, those numbers accelerated further: 66.2 percent gross, 58 percent operating, 50.5 percent net.
For a manufacturer of this scale, those are not normal numbers. They’re closer to what you’d see at a software company than a capital-intensive industrial.
The balance sheet is a fortress. Cash and short-term investments of roughly 105 billion dollars against total debt of about 32 billion. That leaves roughly 74 billion in net cash, on a market cap near 2 trillion. The company will self-fund every single fab in their global build-out without touching that cash pile. Operating cash flow is running at a 90 billion dollar annualized pace.
One thing worth noting on capital allocation: TSMC pays a growing dividend (up 26 percent year over year in the most recent quarter) but runs zero buybacks. That’s a Taiwanese corporate governance choice, not a comment on the stock. Cash is treated as strategic flexibility, not a share count reduction tool.
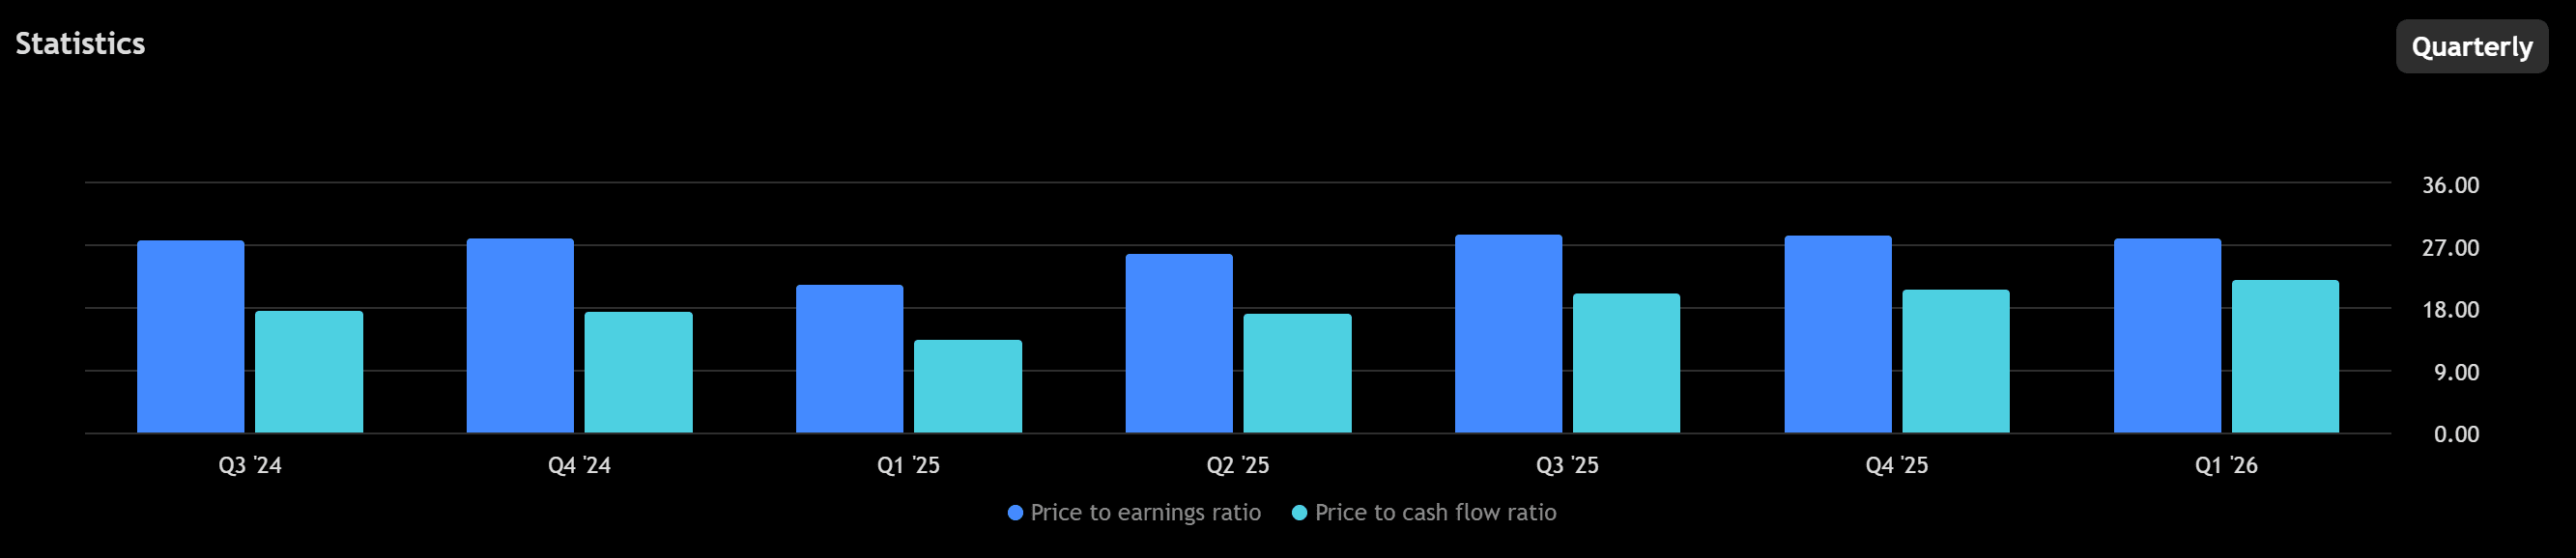
Forward analyst estimates call for about 155 to 160 billion dollars of 2026 revenue and earnings per ADR around 9.30 dollars, putting the stock at roughly 41 times forward earnings. That’s not cheap, but the consensus gross margin for the full year sits near 62 percent, and Q1 already printed 66. If the company simply holds the line on margins for the rest of the year, the Street has to walk numbers higher.
The fundamental takeaway. A 70 percent share, 66 percent gross margin manufacturer that just beat its own guidance while ramping a new node is about as high-quality an operating story as you’ll find anywhere. The stock isn’t cheap, but the earnings power is underestimated.
The technical picture
On the monthly chart, TSM is in full parabolic mode. Price sits 44 percent above the 20 month moving average and more than 300 percent above the 200 month. The monthly ADX (a trend strength indicator) is at 47.7, which is an exceptionally strong reading, and the stock has printed 12 consecutive green Heikin-Ashi candles. That’s late-cycle behavior. It doesn’t mean the trend is about to end, but it does mean new buyers should respect how stretched the move already is.
The weekly chart is where the actionable read lives. Back in February, TSM hit a peak at 390.20. It then corrected 19.6 percent down to 313.80 in late March, bounced cleanly, and is now back within a few percent of that prior high. Weekly RSI is at 69.5. Weekly MACD has essentially reset (the histogram is barely negative, sitting at minus 0.03), meaning the momentum cooldown from the correction is complete. Weekly ADX is at 30, still firmly bullish, with the positive directional indicator well above the negative.
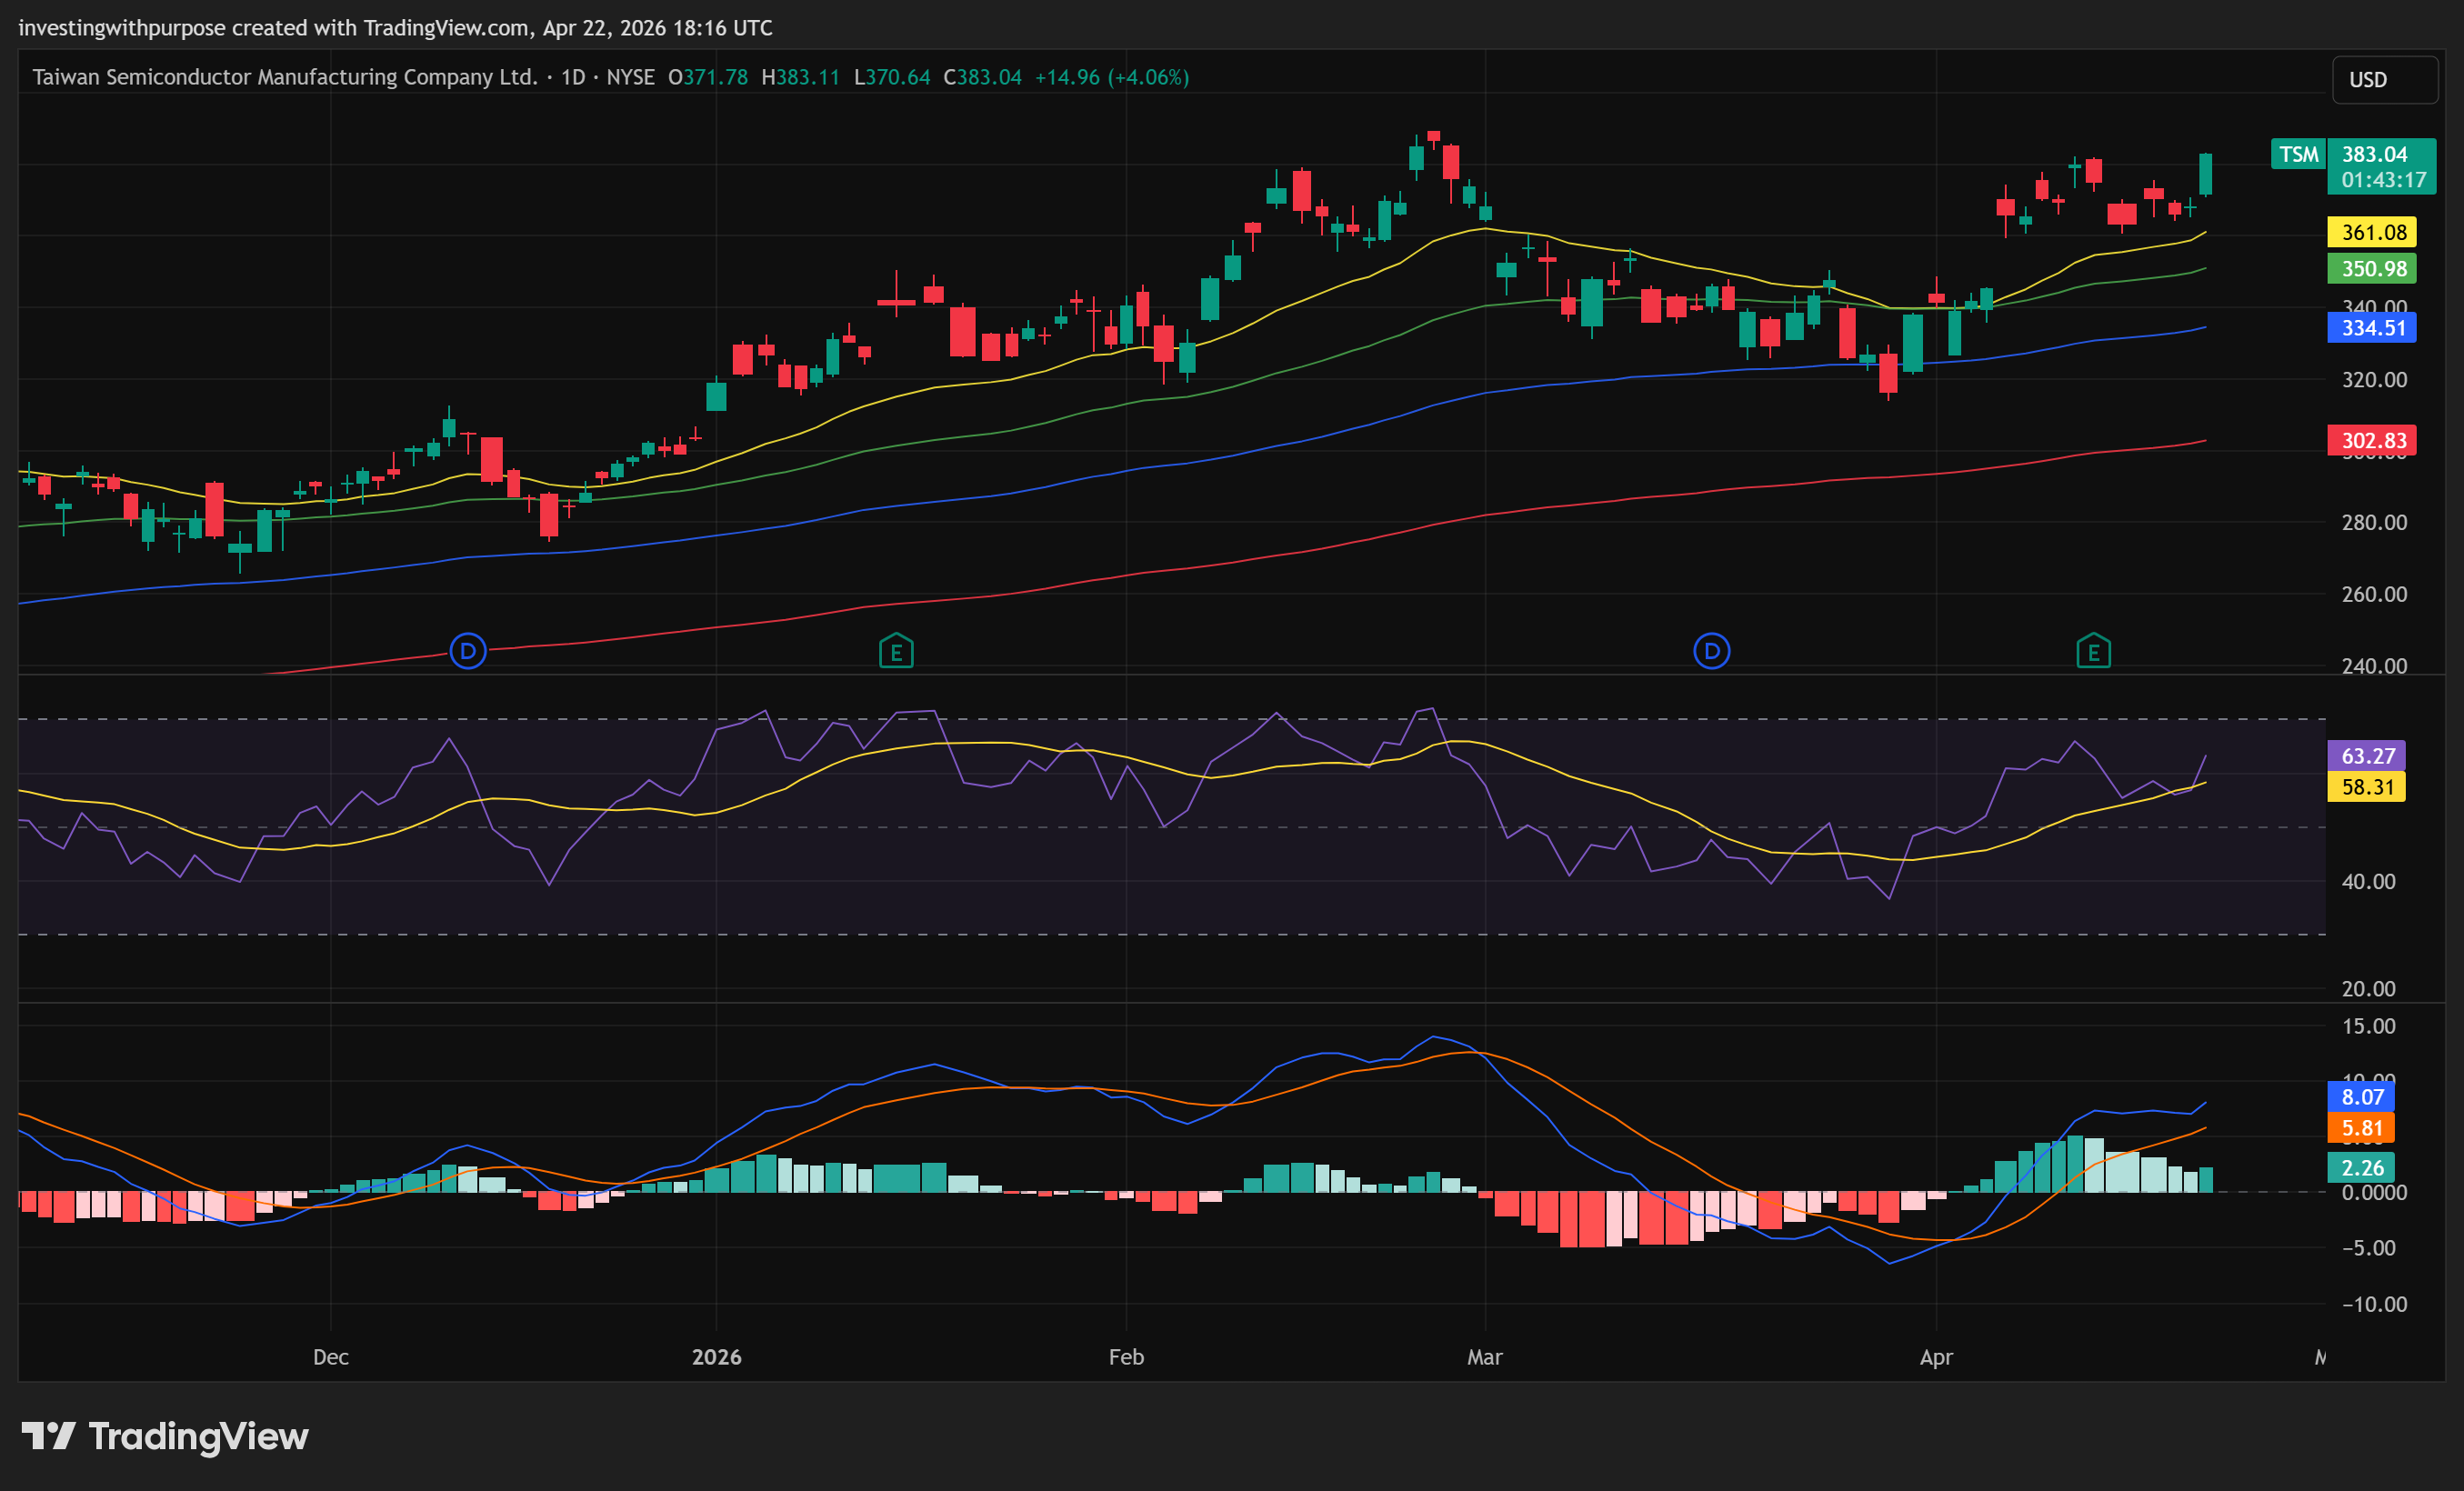
On the daily, the momentum is accelerating again. Daily MACD is positive and expanding. The histogram keeps pushing higher. The 20 day moving average at roughly 361 is rising. There’s no bearish divergence anywhere in the last 80 days of data. Friday’s move, a 3.3 percent jump on the day, came with the stock reclaiming its anchored VWAP from the February peak. Meaning: the average institutional buyer from the February top is now in profit again. That flips a lot of hesitant holders into adders.
Key levels worth remembering:
390.20 is the breakout line. A close above that with volume expansion opens 410 first, then 450, then the 127.2 percent Fibonacci extension at 480.
361 is the 20 day moving average and the peak-anchored VWAP, both rising. This is the first line of defense on a pullback.
345 is the minus 3 ATR band and also fills a gap from earlier in April.
313.80 was the March swing low. It’s also almost exactly the 23.6 percent Fibonacci retrace from the 2022 cycle low, and it held to the dollar. A weekly close below 313 would break the higher low structure and change the thesis.
The technical takeaway. Clean uptrend, momentum expanding, daily divergence nowhere in sight, peak-AVWAP reclaimed. The stretched monthly means new buyers should not chase, but existing holders have no structural reason to sell.
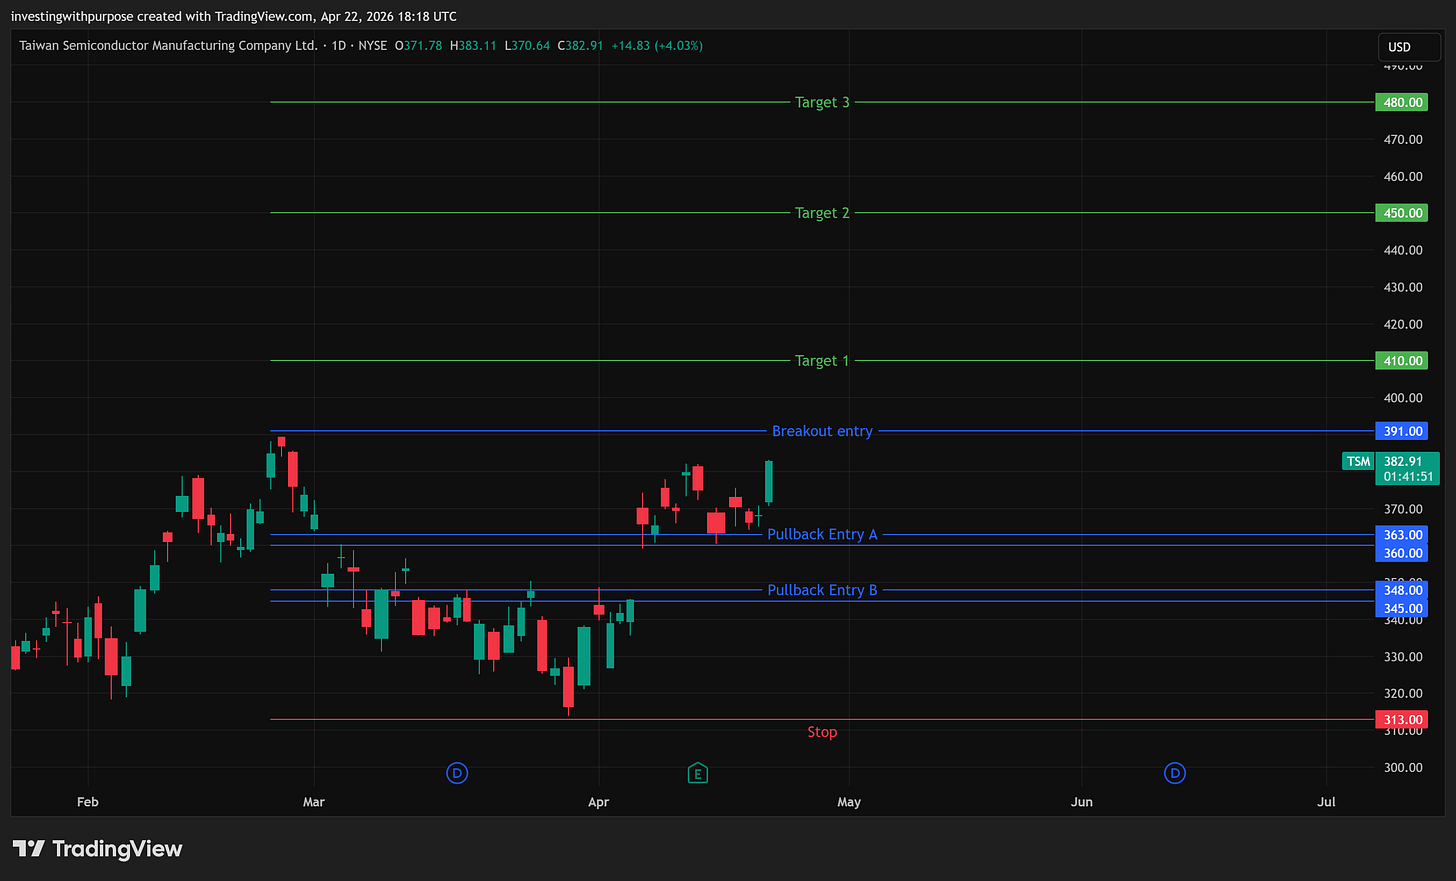
A simple trade plan for TSM
Pullback entries (preferred):
360 to 363. This is the 20 day moving average plus the anchored VWAP from the February peak. First line of defense on a normal dip.
345 to 348. Deeper support at the minus 3 ATR band with a gap fill. If the market gives you this zone, risk-reward improves materially.
Breakout entry (alternative):
391 to 393. A daily close above the prior 390.20 peak, with volume expansion, confirms the next leg.
Stop: 313. Below the prior swing low and the 23.6 percent Fib of the multi-year move. A weekly close below this level breaks the higher low structure and invalidates the setup.
Targets:
First stop at 410 (round number plus one ATR above the prior high).
Second at 450 (measured move from the correction).
Third at 480 (127.2 percent Fibonacci extension, the primary swing target).
Stretch target at 595 (161.8 percent extension, blow-off scenario).
Trail logic:
At 410, raise the stop to 368 (reclaimed 20 day average).
At 450, raise to 400 (the breakout level now acts as support).
At 480, raise to 440 (locks the structural gain).

One note on framework. If you follow other technical services, you’ll see them quote a tighter daily stop around 348 and an intermediate invalidation near 332. Both views are correct; they’re just different time horizons. Tighter trail if you’re trading the swing. The weekly 313 level is for medium to long term holders who are willing to give the trade room to breathe. Pick one, stay consistent, and don’t size a position on one stop and then manage it on the other.
ASML: The Monopoly That’s Quietly Being Tested
Why this one needs a closer read
ASML is the only company in the world that makes extreme ultraviolet lithography machines. Full stop. Without these machines, no one, not TSMC, not Samsung, not Intel, can build sub 7 nanometer chips. That’s about as wide a moat as exists in any global industry.
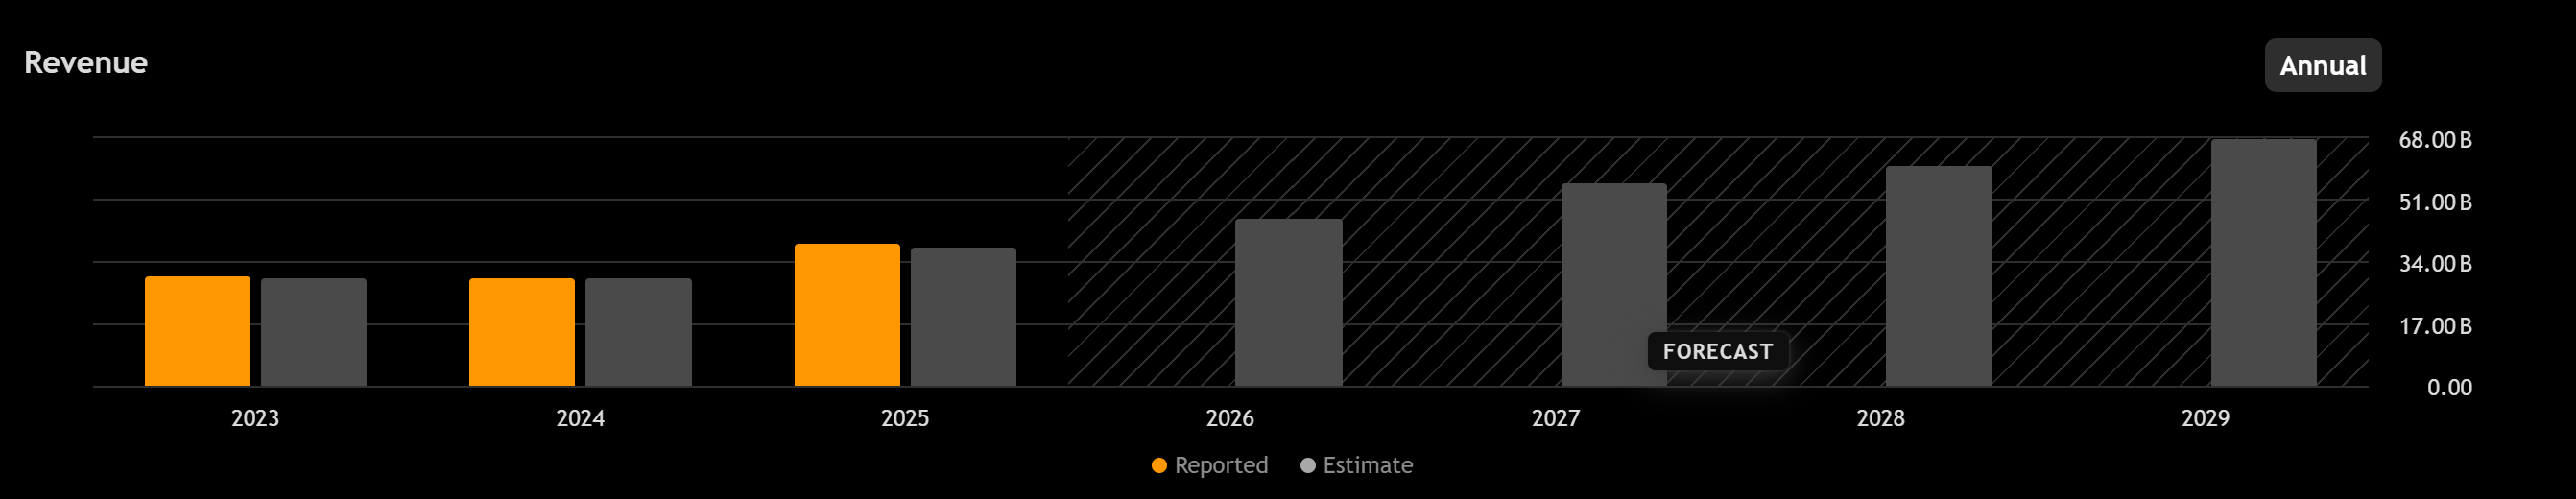
The Q1 2026 print was solid. Revenue of 8.77 billion euros, above consensus. Net income of 2.76 billion, gross margin of 53 percent, EPS of 7.15 euros. The company shipped 67 new lithography systems and 12 used units. EUV revenue alone was more than 4.1 billion euros, and that included two High-NA systems, the next generation of the technology. Management raised full year 2026 guidance to a range of 36 to 40 billion euros, up from the previous 34 to 39 billion.
So why am I flagging caution?
Three reasons, and they’re connected.
First, for the first time in memory, ASML did not disclose order bookings this quarter. Bookings are the closest thing investors have to a leading indicator for a company whose revenue trails shipments by a year or more. Management said intake “continues to be very strong,” but chose to remove the metric from disclosure. That’s a decision, not an accident. Companies don’t quietly withdraw a widely tracked number when it’s comfortable to show.
Second, China exposure is shrinking rapidly. China was 33 percent of 2025 revenue. It fell to 19 percent in Q1 2026. And there’s a new threat on the horizon: a bipartisan US bill called the MATCH Act that would restrict ASML’s DUV (the older, non-EUV) sales to China. Analysts estimate roughly 5 percent of total revenue is directly at risk if this passes, with modest offsets elsewhere.
Third, and most important for the technicals, TSMC has explicitly chosen not to adopt High-NA EUV for its upcoming 1.4 nanometer node. Intel is ASML’s first High-NA customer. Samsung is the second. TSMC, the dominant foundry in the world, is going to stay on standard EUV through 2028 or later. That’s not a death sentence for ASML; the standard EUV tools still sell. But it does mean ASML’s near-term High-NA revenue is more concentrated than it looks. If Intel’s 14 Angstrom process stumbles, the High-NA ramp becomes a Samsung-only story for a while.
Fundamentals, with the numbers that matter
Full year 2025 revenue of 32.7 billion euros, up from 28.3 billion the year before. Gross margin ticked up to 52.8 percent from 51.3. Net income of 9.6 billion. Earnings of 24.73 euros per share. Full year free cash flow was roughly 19 billion euros, which represents close to a 58 percent free cash flow margin. That number alone tells you a lot about the monopoly economics.
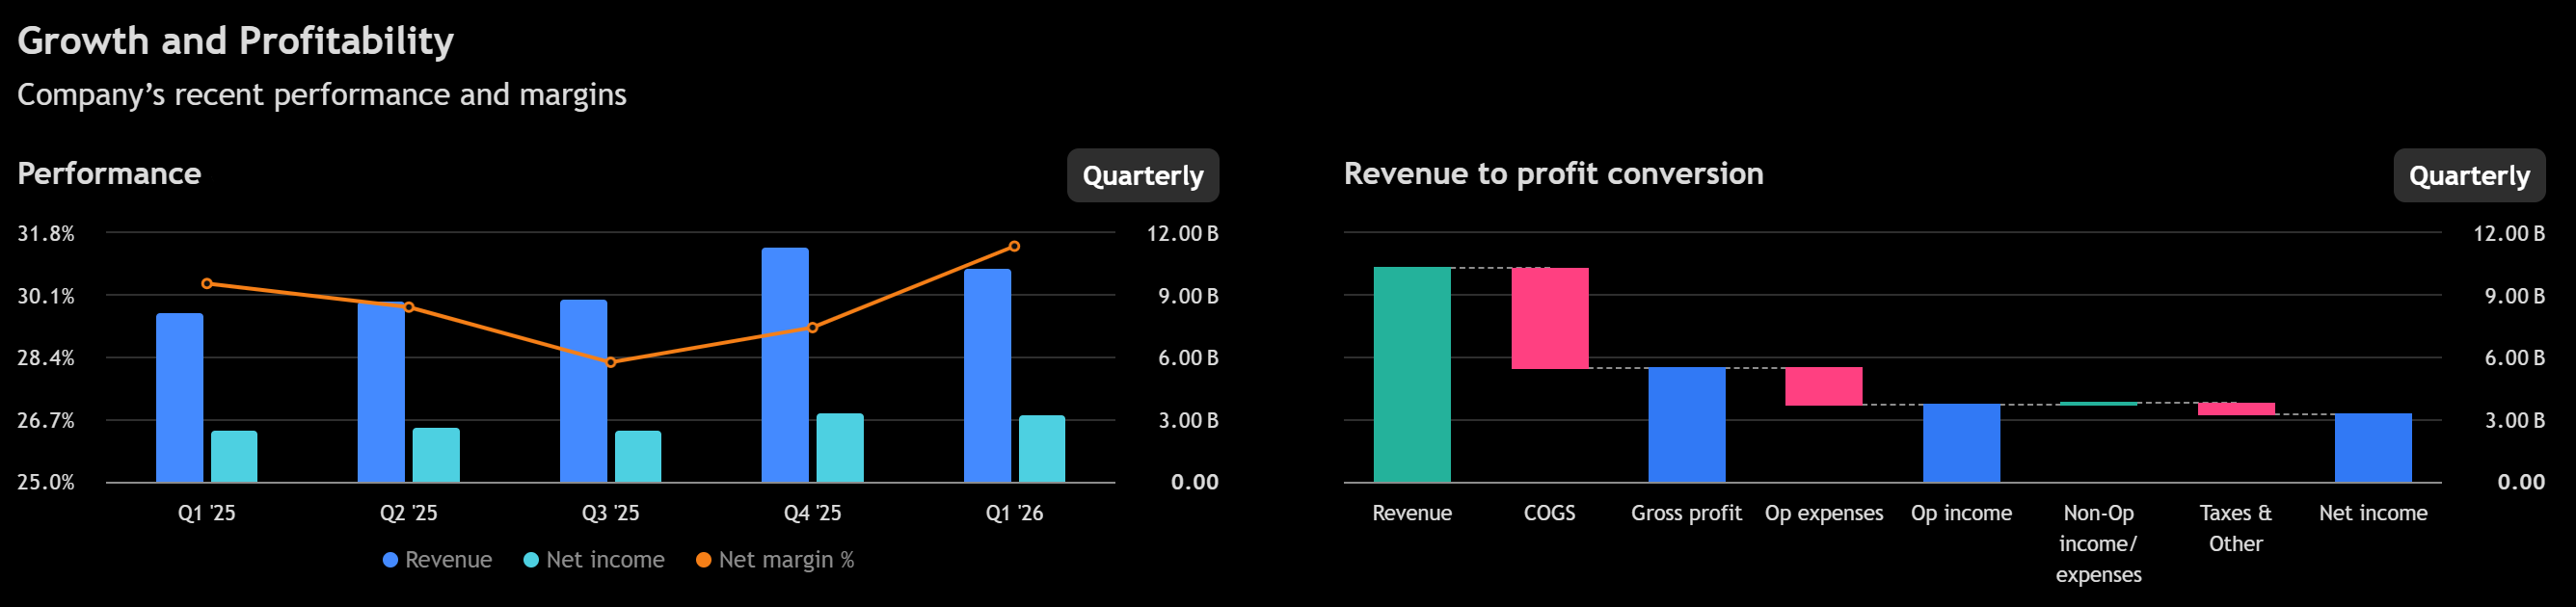
The balance sheet is comfortable but not fortress-like the way TSMC’s is. Cash of about 8.4 billion euros against total debt of 2.7 billion leaves net cash of roughly 5.7 billion. Trailing twelve month buybacks have been around 5.3 billion, and dividends another 2.5 billion. Combined, that’s about 40 percent of free cash flow returned to shareholders. Shares outstanding are dropping a couple of percent per year, a quiet compounder effect that benefits patient holders.
One important note on Q1 2026 cash flow: it was negative 2.6 billion euros. That looks alarming until you realize ASML’s quarterly cash flow is famously lumpy because customer milestone payments don’t align with shipments. Q4 2025 operating cash flow was plus 11 billion. The pattern is the same every year. Q1 and Q3 are drawdowns; Q4 is a flood. Not a red flag, just a feature of the model.
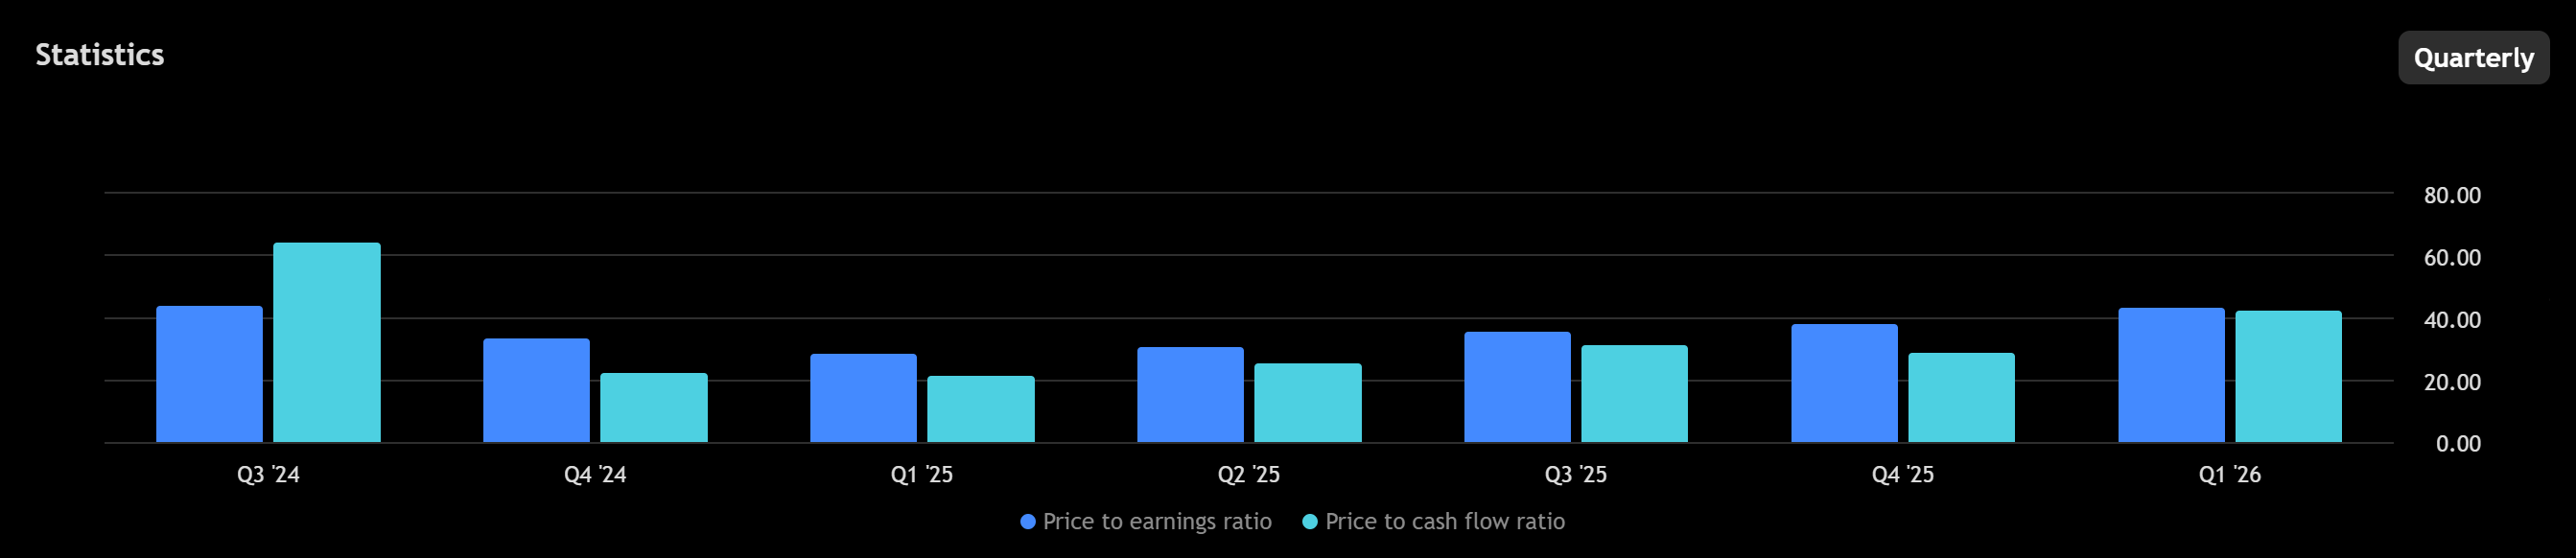
Forward consensus expects about 38 billion euros of 2026 revenue at the midpoint and roughly 32 euros of earnings. That puts the stock at about 45 times forward earnings, which is actually a touch more expensive than TSMC on a multiple basis, for a slower growth profile.
Worth noting for peer context: ASML’s 52 percent gross margin and 35 percent operating margin are great, but KLA Corporation, which makes metrology and inspection tools, runs 62 percent gross and 42 percent operating. KLA is higher quality on pure margin metrics. That’s a reason the ASML premium is absolute (huge market cap) rather than relative (no particular multiple edge versus semicap peers).
The fundamental takeaway. This is still a genuine monopoly and a great business. But the valuation demands continued execution, customer concentration is real, and the China and High-NA angles both add near-term variance that isn’t in the price.
The technical picture
Same long-term setup as TSMC in terms of shape. Monthly chart in parabolic mode, price more than 40 percent above the 20 month moving average, monthly RSI in the low 70s. Fully stretched, not broken.
The weekly chart tells a similar story to TSMC in outline: a February peak at 1,547.22, a correction of about 19.3 percent to a late March low of 1,248.11, and a recovery back toward the prior high. Price at the moment sits around 1,470, so about 5 percent below the February peak.
Here’s where the two charts diverge. On TSM, the momentum profile is clean. On ASML, it isn’t.
Three specific things to watch.
The weekly MACD histogram is still at minus 5.24. TSM’s reset was complete. ASML’s is not. Price has recovered; momentum hasn’t fully reset yet. That’s a classic sign of a recovery outrunning its underlying drivers.
On the daily, there’s a confirmed bearish RSI divergence. The February peak at 1,547 was printed at an RSI of 69.7. The prior January peak, at a lower price of 1,473, was printed at an RSI of 78. Price made a higher high, momentum made a lower high. That’s the textbook signature of a trend that’s losing fuel. It doesn’t guarantee a top, but it raises the probability that any test of 1,547 fails on the first try.
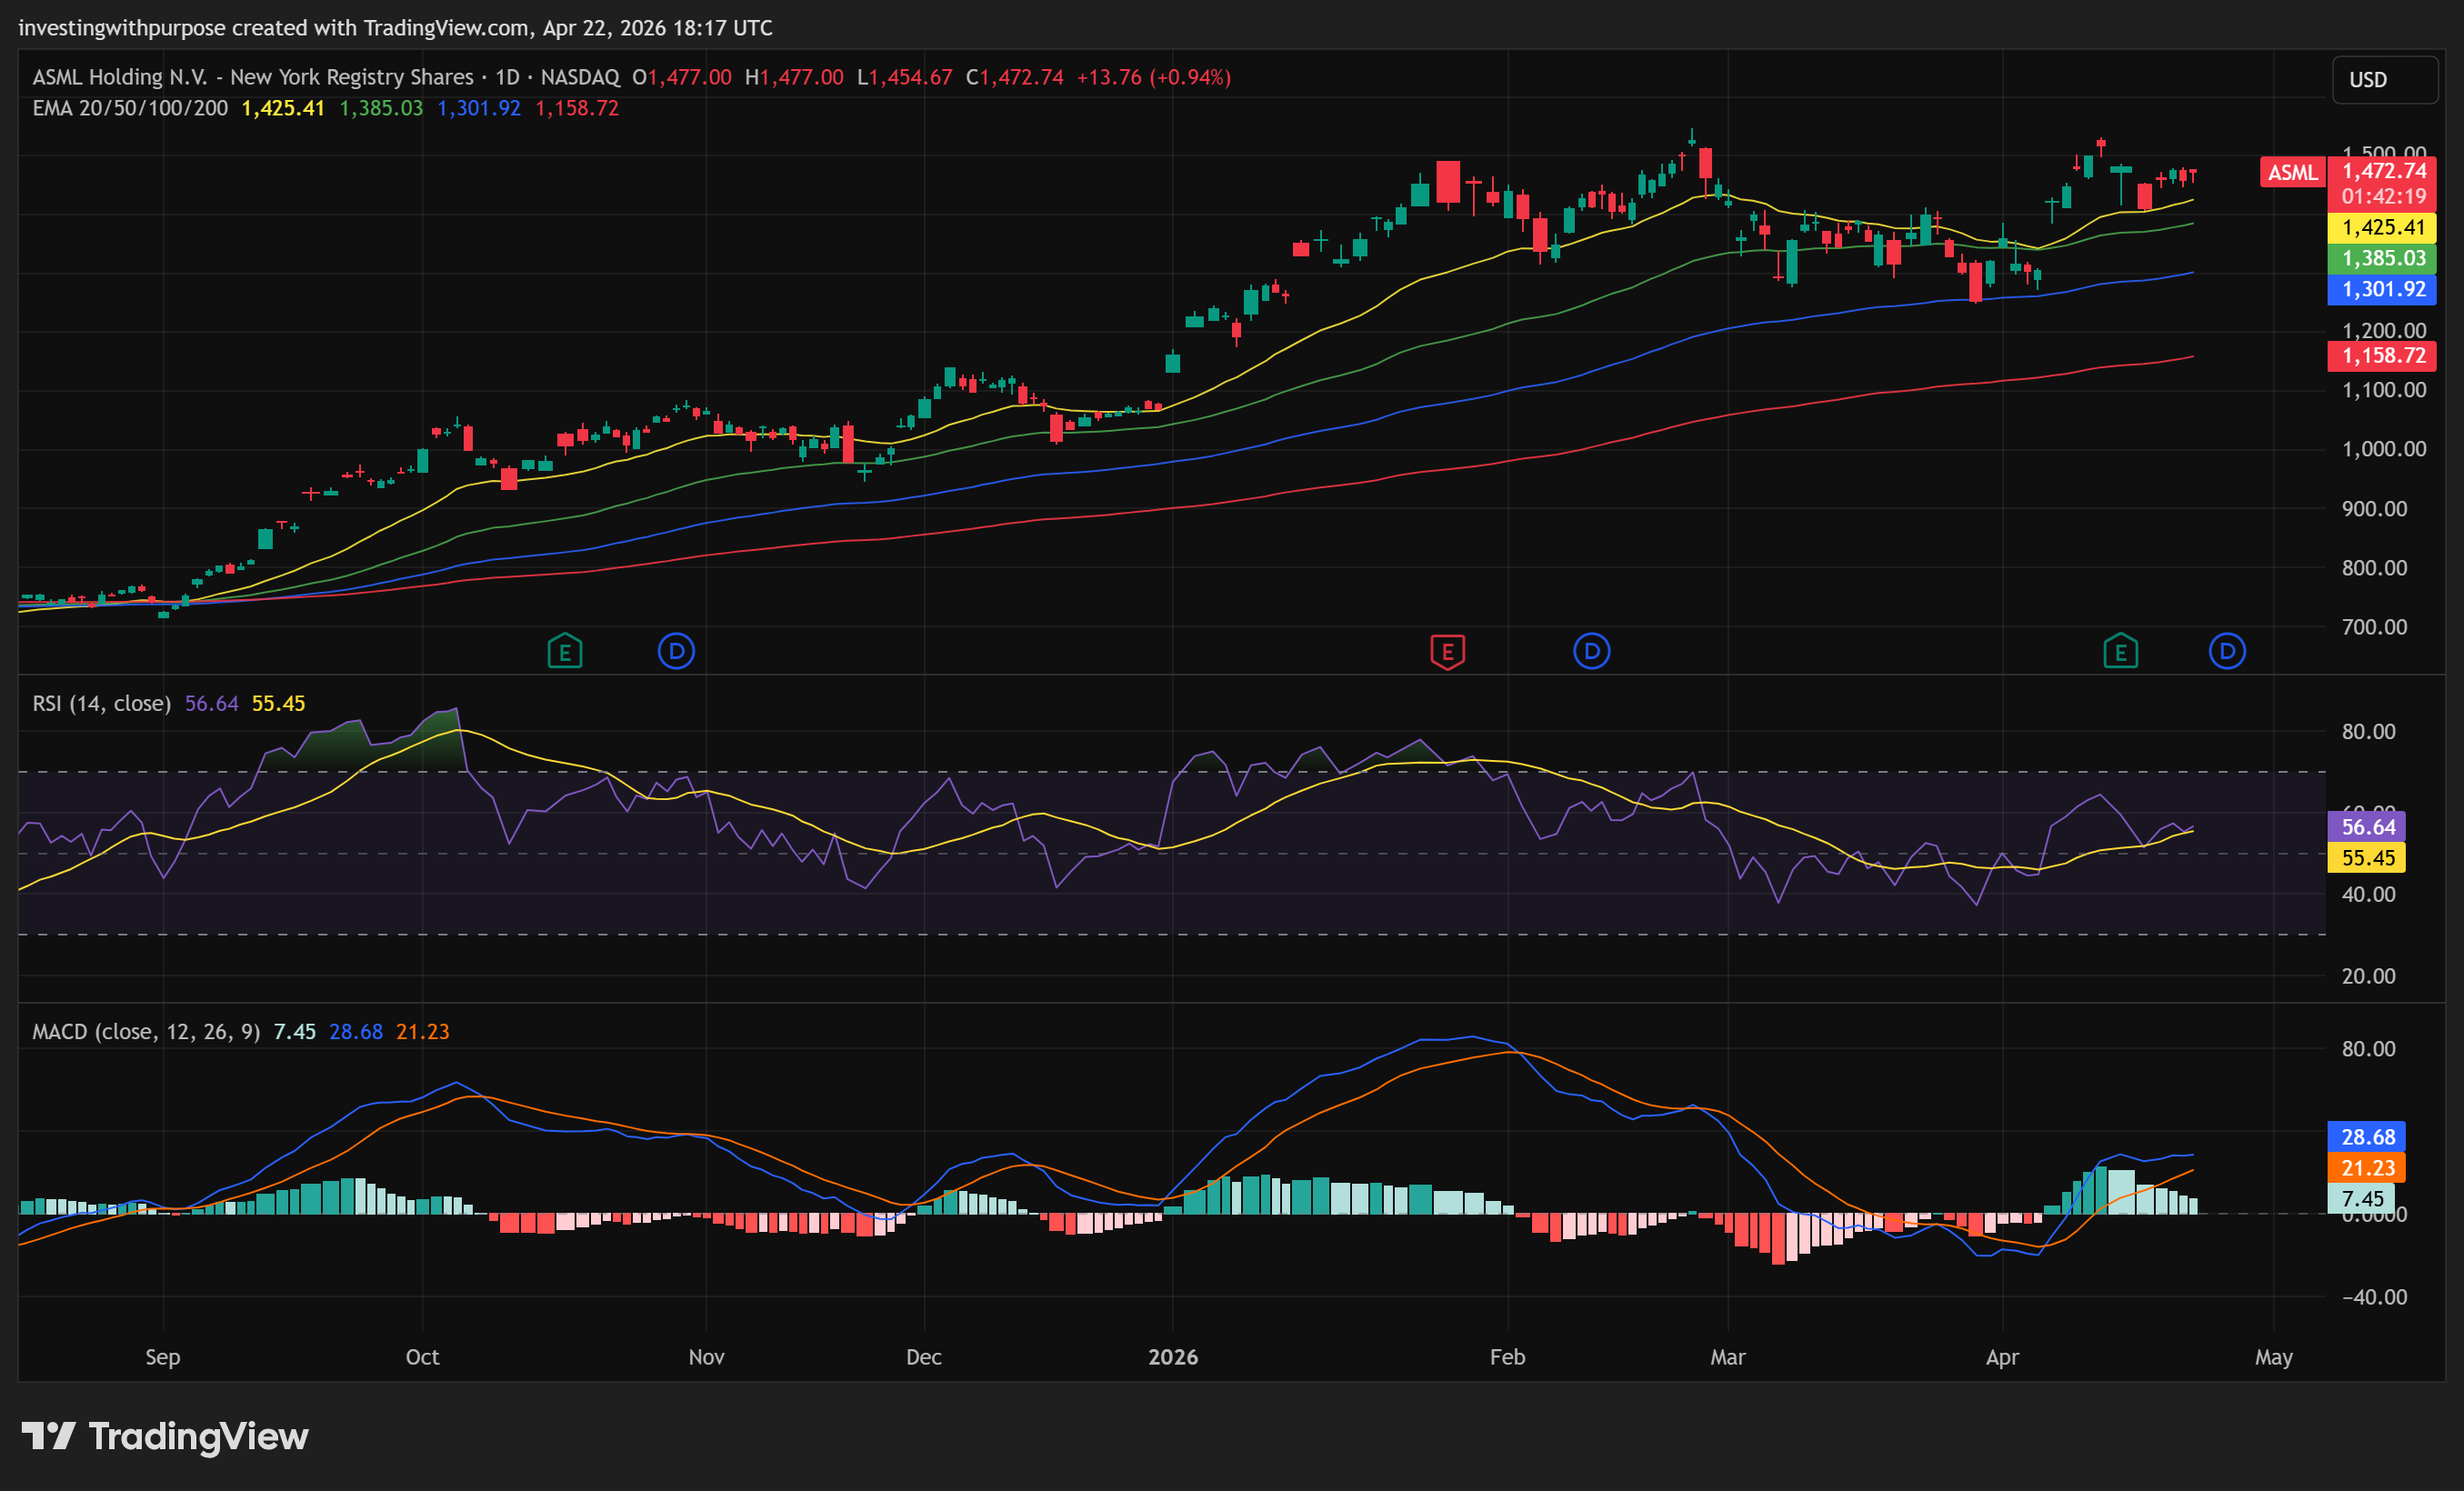
And the daily directional indicators (the DMI lines) are nearly tied. Positive DI sits at 26, negative DI at 24. Spread of only 1.6. That’s the smallest directional edge on the chart and a signal that buyers and sellers are roughly balanced at the daily level, despite the strong weekly uptrend.
Volume profile context matters too. ASML trades far above its 250 day value area. The point of control (the price level with the most traded volume over that window) sits at 756, and the top of the value area is 1,308. Current price at 1,470 is in thin air above structural support. That means pullbacks can accelerate once support breaks, because there’s simply no heavy liquidity shelf between here and much lower levels.
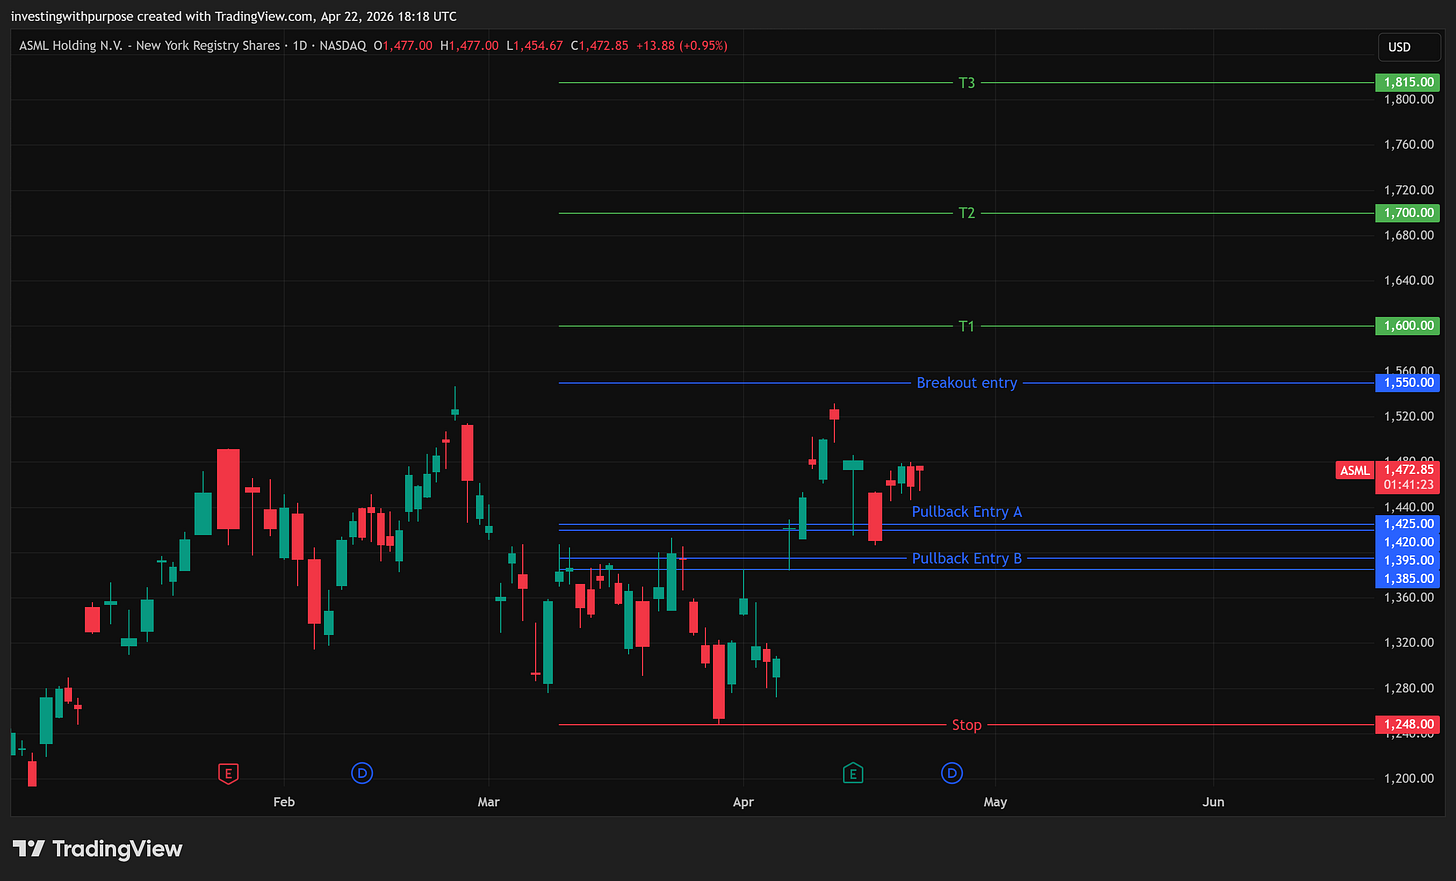
Key levels:
1,547.22 is the breakout line. To trust it, you’d want to see the daily RSI above 65 on the move, to neutralize the existing bearish divergence.
1,425 is the daily 20 day moving average, and the peak-anchored VWAP from February sits a touch below at 1,394.52. That’s the first line of defense.
1,385 is the 50 day moving average and aligns with a cluster of open gaps from earlier this month.
1,248.11 is the March swing low and the structural invalidation. Below that, the 200 day moving average at 1,160 comes into play, then the 50 percent Fibonacci retrace near 1,056.
The technical takeaway. The structure is bullish and the monopoly thesis still prints money. But the daily divergence, the tight DI spread, the chaotic open-gap pattern from recent weeks, and the air-pocket below current price are all real reasons to prefer a smaller size or a patient entry over a full-weight chase.
A simple trade plan for ASML
Pullback entries (preferred):
1,420 to 1,425. Daily 20 day moving average plus anchored VWAP from the February peak. First zone to watch.
1,385 to 1,395. Daily 50 day moving average and open gap cluster. Better risk-reward on a deeper flush.
Breakout entry (alternative):
1,550 to 1,560, with daily RSI above 65 on the move. The RSI condition matters. Without it, the bearish divergence is still in play.
Stop: 1,248. Below the March swing low. A weekly close below this level opens the door to 1,160 and invalidates the recovery structure.
Targets:
First at 1,600 (round number and upper band projection).
Second at 1,700 (upper weekly Bollinger projection).
Third at 1,815 (127.2 percent Fibonacci extension).
Stretch at 2,155 (161.8 percent extension).
Trail logic:
At 1,600, raise the stop to 1,425 (the 20 day moving average holds and the divergence is neutralized).
At 1,700, raise to 1,550 (the prior peak becomes support).
At 1,815, raise to 1,680 (trails roughly 2 ATR below the prior target).

Same framework note as TSM. Other services using tighter daily stops flag invalidation around 1,410 to 1,374. That’s a weekly swing trader’s stop. The 1,248 level is for medium to long term positioning with room for noise. And a detail that’s easy to miss: most tactical views are not calling out the daily bearish RSI divergence. I am, because in a mature trend, that’s exactly the kind of signal that eventually matters. It’s one of the strongest reasons to lean toward pullback entries rather than chasing the breakout.
Position Sizing, Because This Is Where Most Plans Die
Before the bottom line, a word on sizing, since it’s the part people skip.
Risk in a trade is defined by the distance between your entry and your stop, not by the share price. A hundred dollar stock with a two dollar risk and a thousand dollar stock with a twenty dollar risk are functionally identical if you size them right.
Pullback entries are closer to the stop, so they allow more shares for the same risk. Breakout entries are further from the stop, so they require fewer shares. Don’t be tempted to tighten the stop to fit a bigger position. That’s how good theses turn into bad P&L. Scale into a position across two or three entry zones when possible, rather than putting everything on at one price. Trades you’re forced to hold through a normal drawdown work better when you have dry powder left to add on weakness.
The Bottom Line
TSMC and ASML sit on the same demand curve but in very different places right now. The quality of the underlying businesses is unimpeachable in both cases. These aren’t momentum stocks; they’re the physical plumbing of the AI cycle, and that plumbing is not about to be replaced.
But the tape is telling us two different stories in the short term. TSMC is the cleanest major technology setup I can find right now. A 58 percent earnings beat, a 170 basis point margin beat over their own guidance, a daily momentum profile with no divergences, a peak-anchored VWAP reclaimed, and a weekly structure that just completed a normal 19 percent corrective reset and is now pressing prior highs with real momentum behind it. The risk-reward on a pullback into the 360 to 363 zone is excellent. A breakout above 391 confirms the next leg. The structural invalidation at 313 is far enough below to let the trade breathe.
ASML is trickier. The fundamental story is still a monopoly, and the guidance raise proves the 2026 backlog is there. But the decision to stop disclosing order intake, the shrinking China exposure, the looming MATCH Act, TSMC’s delayed move to High-NA, and the confirmed daily bearish RSI divergence together warrant more caution. The right approach isn’t to avoid it; it’s to size it smaller than TSMC, prefer pullbacks over breakouts, and consider a simple hedge like a collar if you’re running both positions at meaningful size.
If capital has to be deployed into the pair today, the pair trade is straightforward: TSMC at the larger weight, ASML at the smaller. Both hold long-term, both respect the invalidation levels, both trim into stretched weekly extensions.
There’s a quiet lesson here for medium to long term investors. Great businesses don’t always offer great entries. Knowing the difference between buying a stock you love at any price and buying the same stock at the right price is most of the game. TSMC and ASML will both compound capital over a five to ten year window. Whether they compound yours depends on where you step in, where you step out, and how much rope you’re willing to give them in between.
Trade the structure you have, not the one you want. Size for the stop, not the story. And when a high-quality chart shows you a subtle warning, take it seriously even when the headline number is great. That’s the difference between being early and being right.
The content in this post is provided for informational and educational purposes only. It does not constitute investment advice, a recommendation, or an offer to buy or sell any security, and should not be relied upon as the basis for any investment decision. The views expressed reflect personal analysis as of the date of publication and are subject to change without notice as market conditions evolve.
All price levels, technical setups, fundamental assessments, and trade plans discussed are illustrative frameworks based on publicly available information and market structure. They are not guarantees of future performance. Markets are inherently uncertain, and every investment carries the risk of loss, including the potential loss of principal. Past performance is not indicative of future results.