
The Under-the-Radar Infrastructure Stock That's Starting to Turn Heads
Elite margins, recurring revenue, rising product growth, and real AI exposure. But one emerging risk factor could change the entire narrative.

Most investors hunting AI-driven returns typically look at semiconductors, hyperscalers, and high-multiple software names.
F5 Networks FFIV 0.00%↑ is not that, but it is doing something just as impressive: compounding earnings, expanding margins, growing a sticky recurring revenue base, and positioning itself at the exact intersection of enterprise complexity and AI infrastructure demand.
It is an infrastructure and control-layer business that helps enterprises deliver, manage, and secure applications across increasingly fragmented environments. As workloads spread across on-premise systems, private cloud, public cloud, APIs, and now AI-driven architectures, the value of that control layer rises.
It doesn’t trade like a theme stock. That’s part of the opportunity.
The complication is that F5's flagship product, BIG-IP, has a serious security flaw that is actively being exploited in the wild. What was initially described as a denial-of-service vulnerability was later reclassified as a remote code execution issue, meaning attackers can potentially take full control of affected systems. That does not automatically change the long-term thesis, but it does matter for investor positioning because F5 sells trust as much as it sells infrastructure.

Key Takeaways
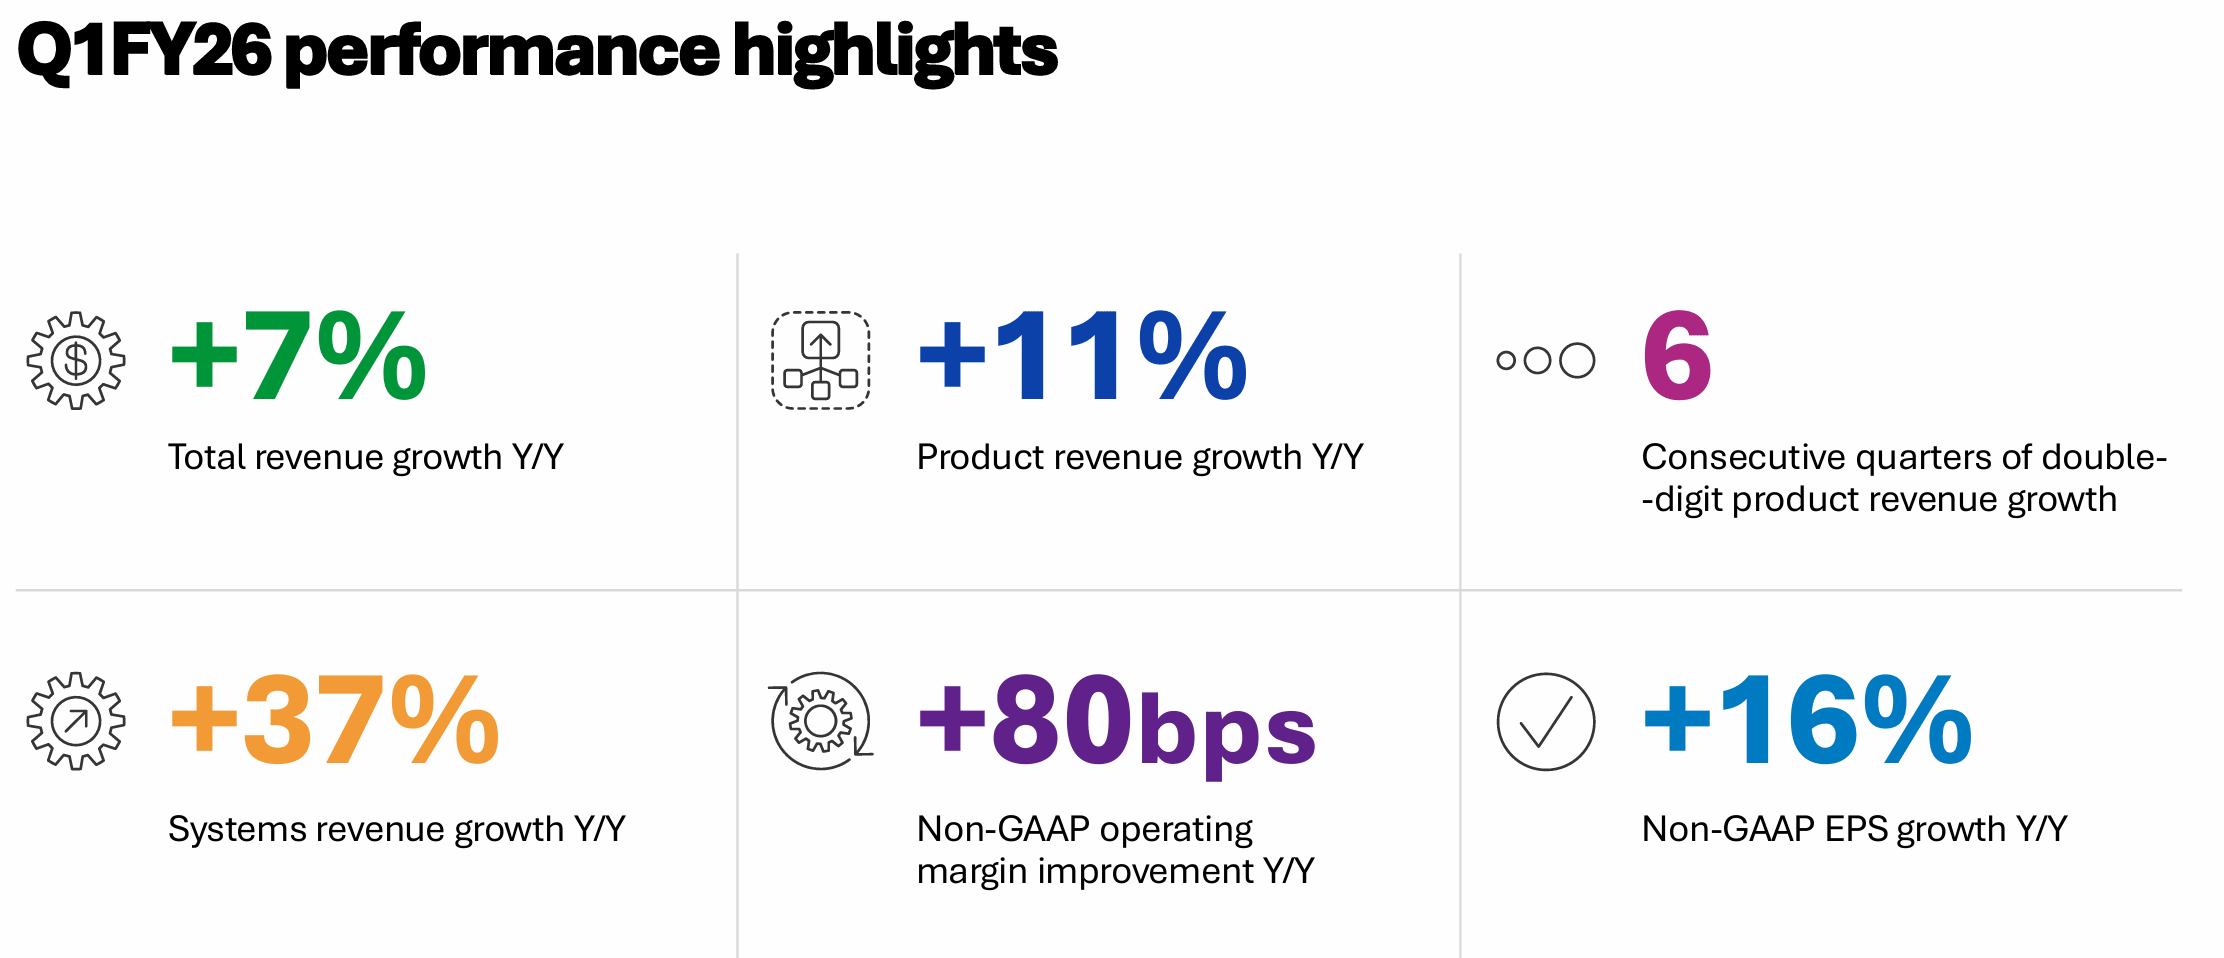
Q1 FY2026 revenue of $822M, up 7% year over year, with non-GAAP EPS of $4.45 up 16% from a year earlier
Six consecutive quarters of double-digit product revenue growth, including 37% systems growth in Q1
Nearly 20 consecutive quarters of EPS beats
Recurring revenue of $570M represents 69% of total revenue; 86% of software revenue now comes from subscriptions
Non-GAAP gross margin of 83.8% and non-GAAP operating margin of 38.2%, up 80 basis points year over year
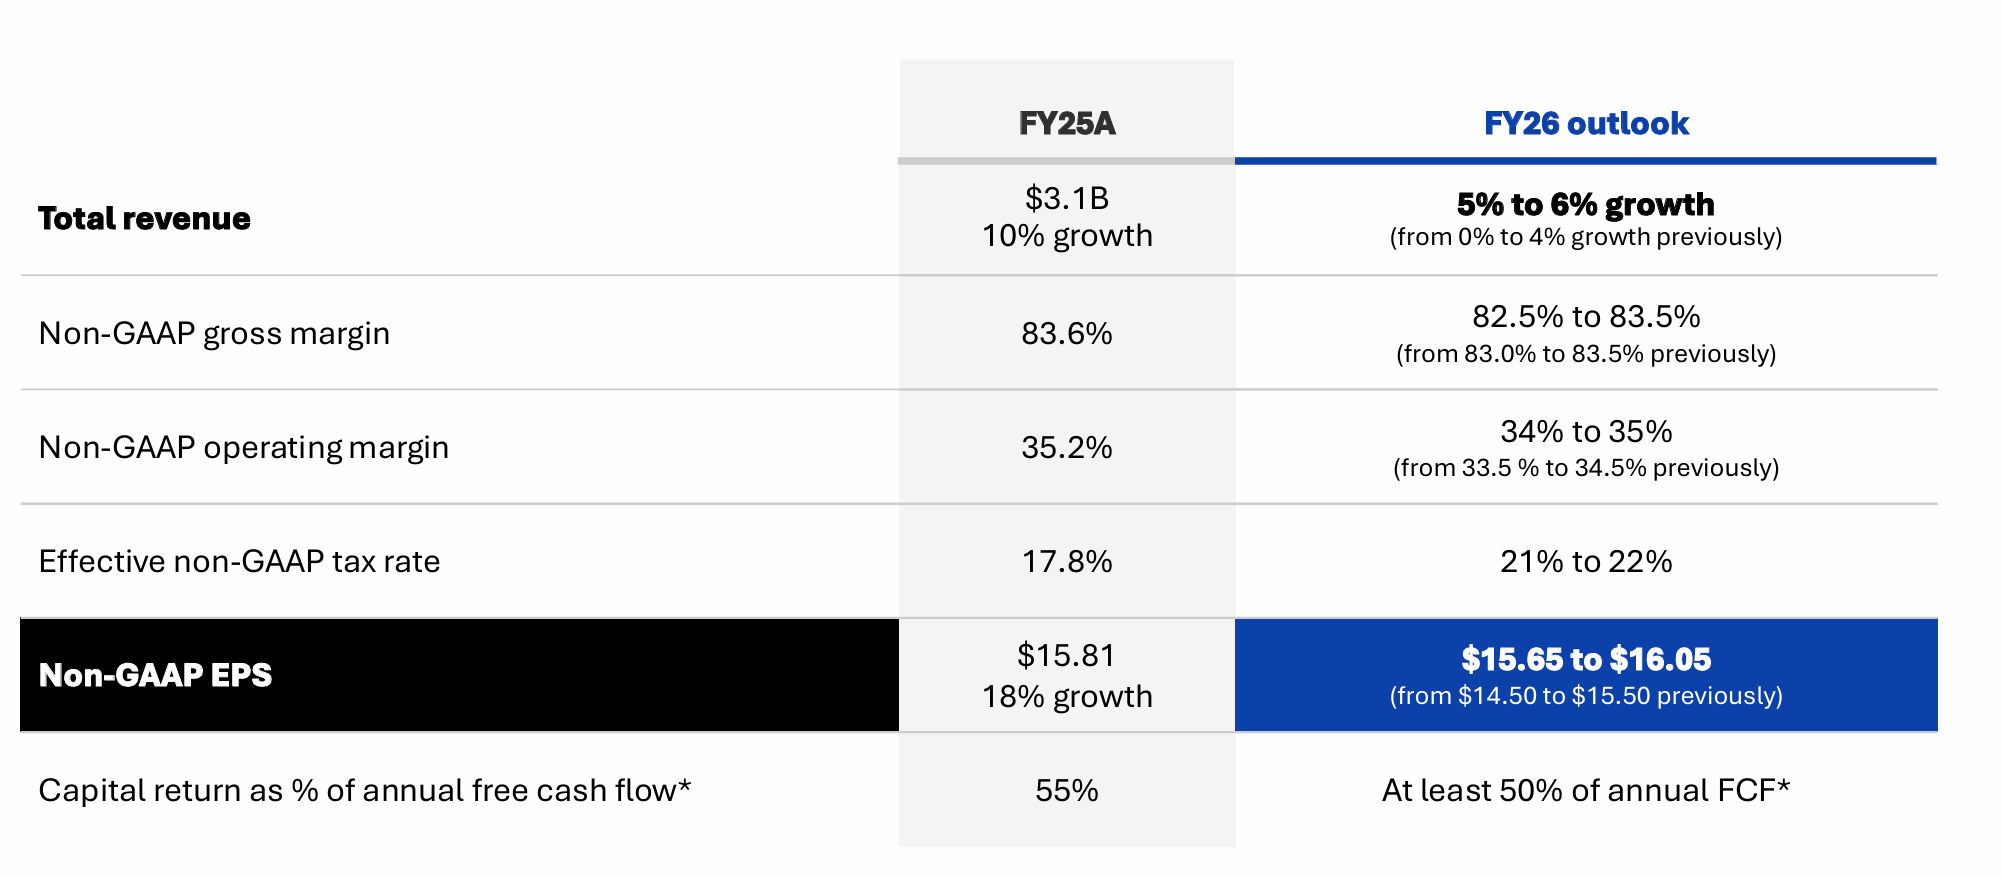
Full-year FY26 guidance raised to 5–6% revenue growth and non-GAAP EPS of $15.65–$16.05
TTM free cash flow of $861M; $300M in share repurchases in Q1 alone
The BIG-IP vulnerability is a real overhang, even if Q1 demand disruption was minimal
What F5 Does, and Why It Matters More Now
F5 sits in the application delivery and security layer. The control plane that manages traffic, secures APIs, optimizes performance, and keeps applications fast and available regardless of where they run. On-premise, private cloud, public cloud, edge, F5’s platform is designed to work across all of it.
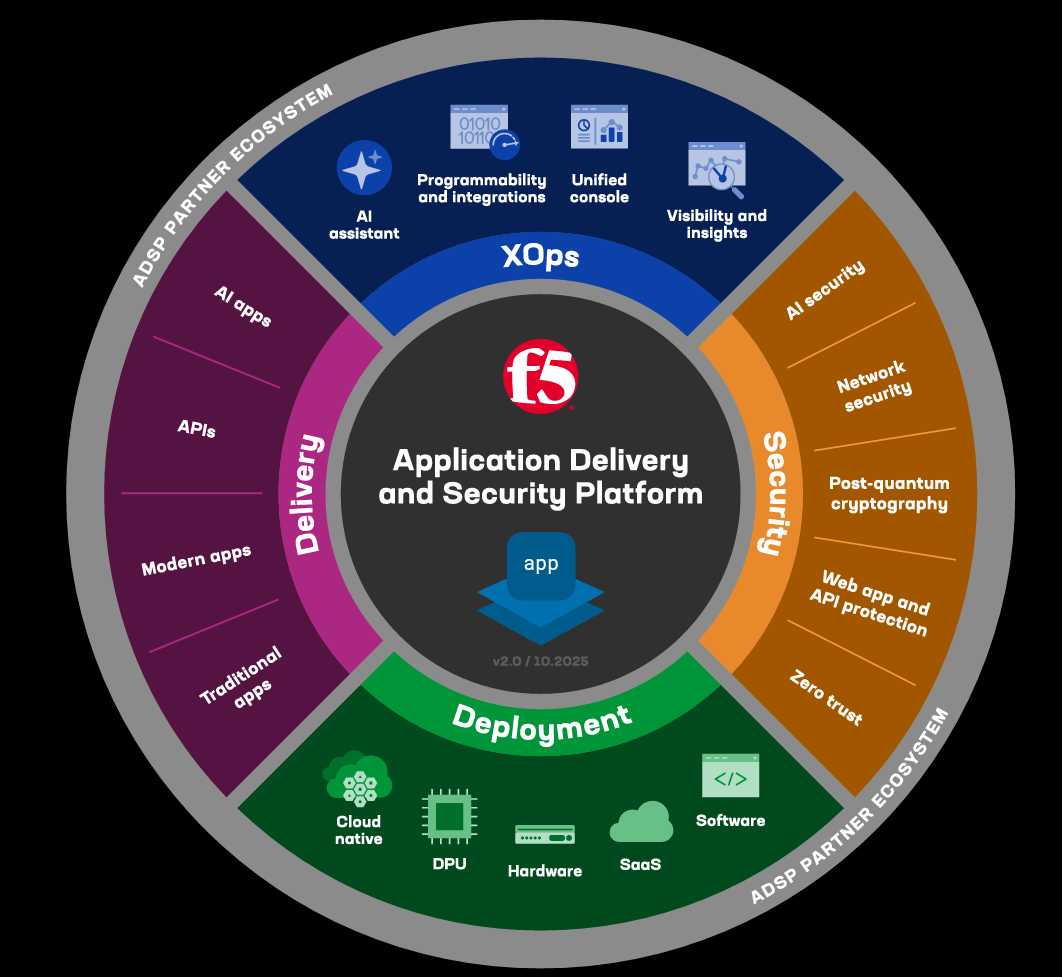
Enterprise workloads are no longer centralized. They’re fragmented by design, and AI is adding another layer of complexity on top: more data movement, higher throughput requirements, and entirely new categories of runtime security exposure.
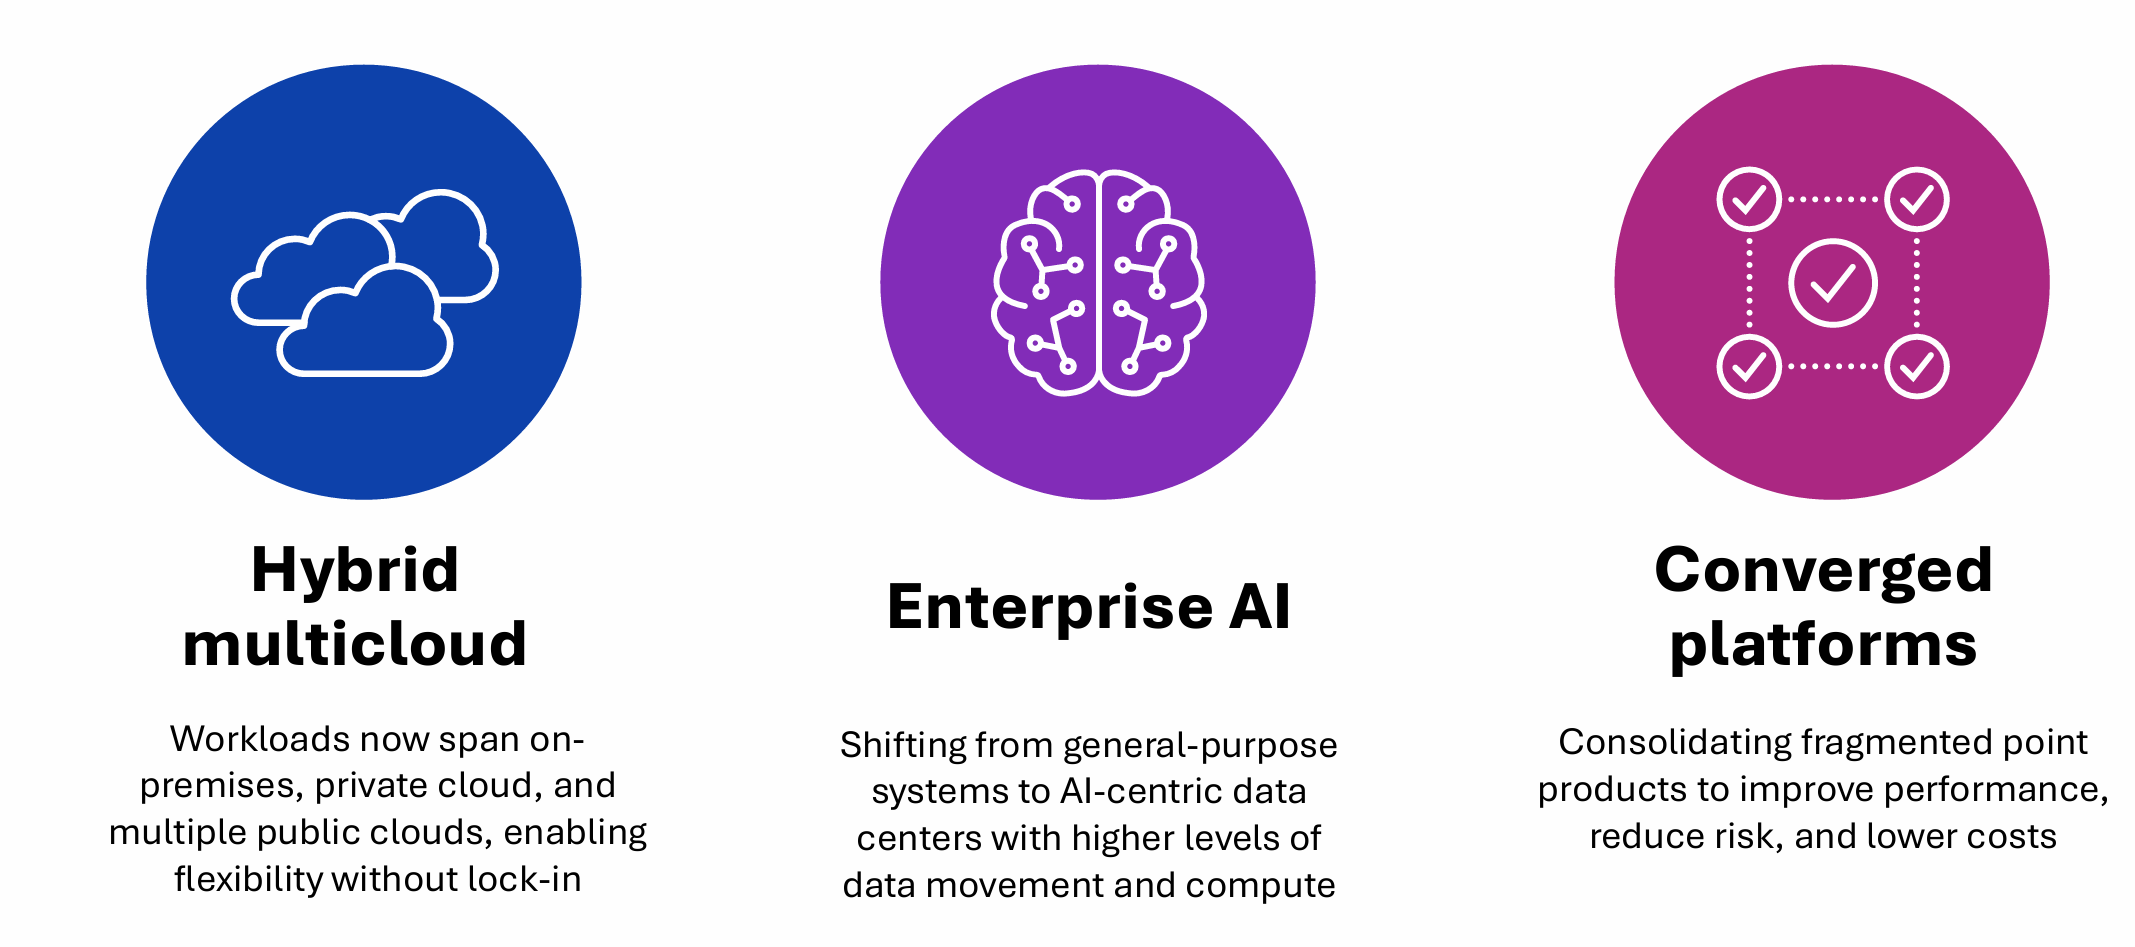
F5 management identified three structural forces reshaping customer infrastructure decisions, and the customer wins disclosed in Q1 2026 make these concrete rather than thematic:
Hybrid multicloud adoption: European regulations like NIS2, GDPR, and DORA are accelerating this by imposing resilience and digital sovereignty requirements. F5 wins here because it delivers and secures applications in any form factor, anywhere, without requiring customers to rearchitect their operations
Enterprise AI investment: AI deployments create demand for high-throughput data pipelines, intelligent GPU load balancing, and runtime security for AI models and APIs. Q1 wins included a global technology OEM, a financial services leader deploying AI guardrails, and an energy company shifting from public AI consumption to private model hosting
Converged platforms: Enterprises are consolidating fragmented point products. F5’s Application Delivery and Security Platform positions it as a consolidation destination rather than a point solution at risk of displacement
Fundamental Analysis
On fundamentals, F5 is doing fantastic. Since Q2 2021, F5 has beat EPS expectations every single quarter. On the revenue side, it barely missed expectations twice in the same period.
Revenue and Earnings
TTM revenue: ~$3.14B, up from $3.09B at fiscal year-end and $2.82B the year prior
Q1 FY26 revenue: $822M, the strongest quarter to date
Product revenue: $410M in Q1, up 11% year over year
Systems revenue: up 37% year over year in Q1
Six consecutive quarters of double-digit product revenue growth
TTM diluted GAAP EPS: $12.08, up from $9.55 in FY2024 and $5.27 in FY2022
Non-GAAP EPS Q1 FY26: $4.45, up 16% year over year
Margins and Profitability
Non-GAAP gross margin: 83.8%, essentially flat year over year and exceptional for an infrastructure business
Non-GAAP operating margin: 38.2%, up 80bps year over year
GAAP operating margin: 26.0%, weighed down by stock-based compensation, acquisition costs, and $17.5M in cyber incident costs
TTM EBITDA: ~$884M on $3.14B revenue representing an an ~18% EBITDA margin, trending higher
TTM operating income: $789M, up from $412M in FY2022. The improvement is structural, not cyclical
Cash Flow and Capital Returns
TTM operating cash flow: $906M
TTM capex: ~$45M
TTM free cash flow: $861M (~27% FCF margin)
Q1 FY26 share repurchases: $300M, equivalent to 201% of that quarter’s free cash flow
Commitment: at least 50% of annual FCF directed to buybacks
$622M remaining on authorized repurchase program as of December 31, 2025
Diluted share count reduced from ~61,100 in FY2022 to ~58,460 TTM
Balance Sheet
Total assets: $6.29B
Total debt: $268M, almost entirely capital lease obligations, zero traditional financial debt
Cash and investments: $1.22B at end of Q1 (after the $300M buyback)
Common equity: $3.54B, up from $2.47B in FY2022
Net tangible assets: $1.01B, up from near-zero four years ago
Deferred revenue: $2.06B, up 6% year over year. Strong forward revenue visibility
Guidance
FY26 revenue growth guidance: raised to 5–6% (from prior 0–4%)
FY26 non-GAAP EPS guidance: raised to $15.65–$16.05 (from prior $14.50–$15.50)
FY26 non-GAAP operating margin guidance: raised to 34–35% (from 33.5–34.5%)
Q2 FY26 outlook: revenue $770–790M, non-GAAP EPS $3.34–3.46
Valuation
Price-to-earnings (TTM GAAP): ~25x
Forward non-GAAP P/E: ~19x
EV/EBITDA: high-teens to low-twenties
Price-to-sales: ~5.5x TTM
These are fair multiples for a business with 83%+ gross margins, 27% FCF margins, and 69% recurring revenue. They are not cheap multiples. Upside from here depends on continued execution, not multiple expansion.
The Risk That Deserves Honest Treatment: The BIG-IP Vulnerability
No credible analysis of F5 skips this.
F5 is managing through a serious cybersecurity incident involving a remote code execution vulnerability in BIG-IP. CVE-2025-53521 was added to CISA’s Known Exploited Vulnerabilities catalog after confirmed active exploitation in the wild.
In October 2025, F5 disclosed a security incident affecting its BIG-IP systems, the details of which prompted the company to begin an internal investigation and remediation effort that resulted in $17.5 million in incident-related costs being excluded from Q1 FY26 non-GAAP results.
Then in late March 2026, the situation escalated when CVE-2025-53521, a BIG-IP APM vulnerability, was reclassified from a denial-of-service flaw to an unauthenticated remote code execution issue, meaning attackers could potentially take full control of affected systems under certain configurations. CISA added it to the Known Exploited Vulnerabilities catalog shortly after, confirming active exploitation in the wild. F5’s response has included rapid customer mobilization, security automation investments, product hardening, and deeper engagement with CISOs across its customer base.
What we know:
$17.5M in cyber incident costs excluded from non-GAAP operating income in Q1
Management reported minimal Q1 demand disruption
Customer feedback on the security response was described as positive
F5 mobilized global sales and support teams rapidly to help customers remediate
What management is focused on going forward:
Further investing in security automation across operations
Enhancing product and development environment security
Sharing learnings with the broader security community
Why this still matters even if the financial hit looks contained:
F5 is in the middle of a major push to position itself as a trusted security and platform vendor. A confirmed remote code execution exploit in the flagship product creates friction at exactly the wrong moment. The direct cost is manageable. The reputational exposure in procurement conversations, renewal cycles, and competitive evaluations takes longer to measure and longer to heal.
The incident looks like a manageable overhang rather than a thesis-breaker. For this to stop being an investor concern, two things need to happen: the vulnerability needs to be fully patched and verified across the customer base with no further escalation, and F5 needs to deliver two to three clean quarters of unaffected demand that demonstrate customer trust remains intact.
Technical Analysis
The Big Picture: A Recovery With a Warning Label
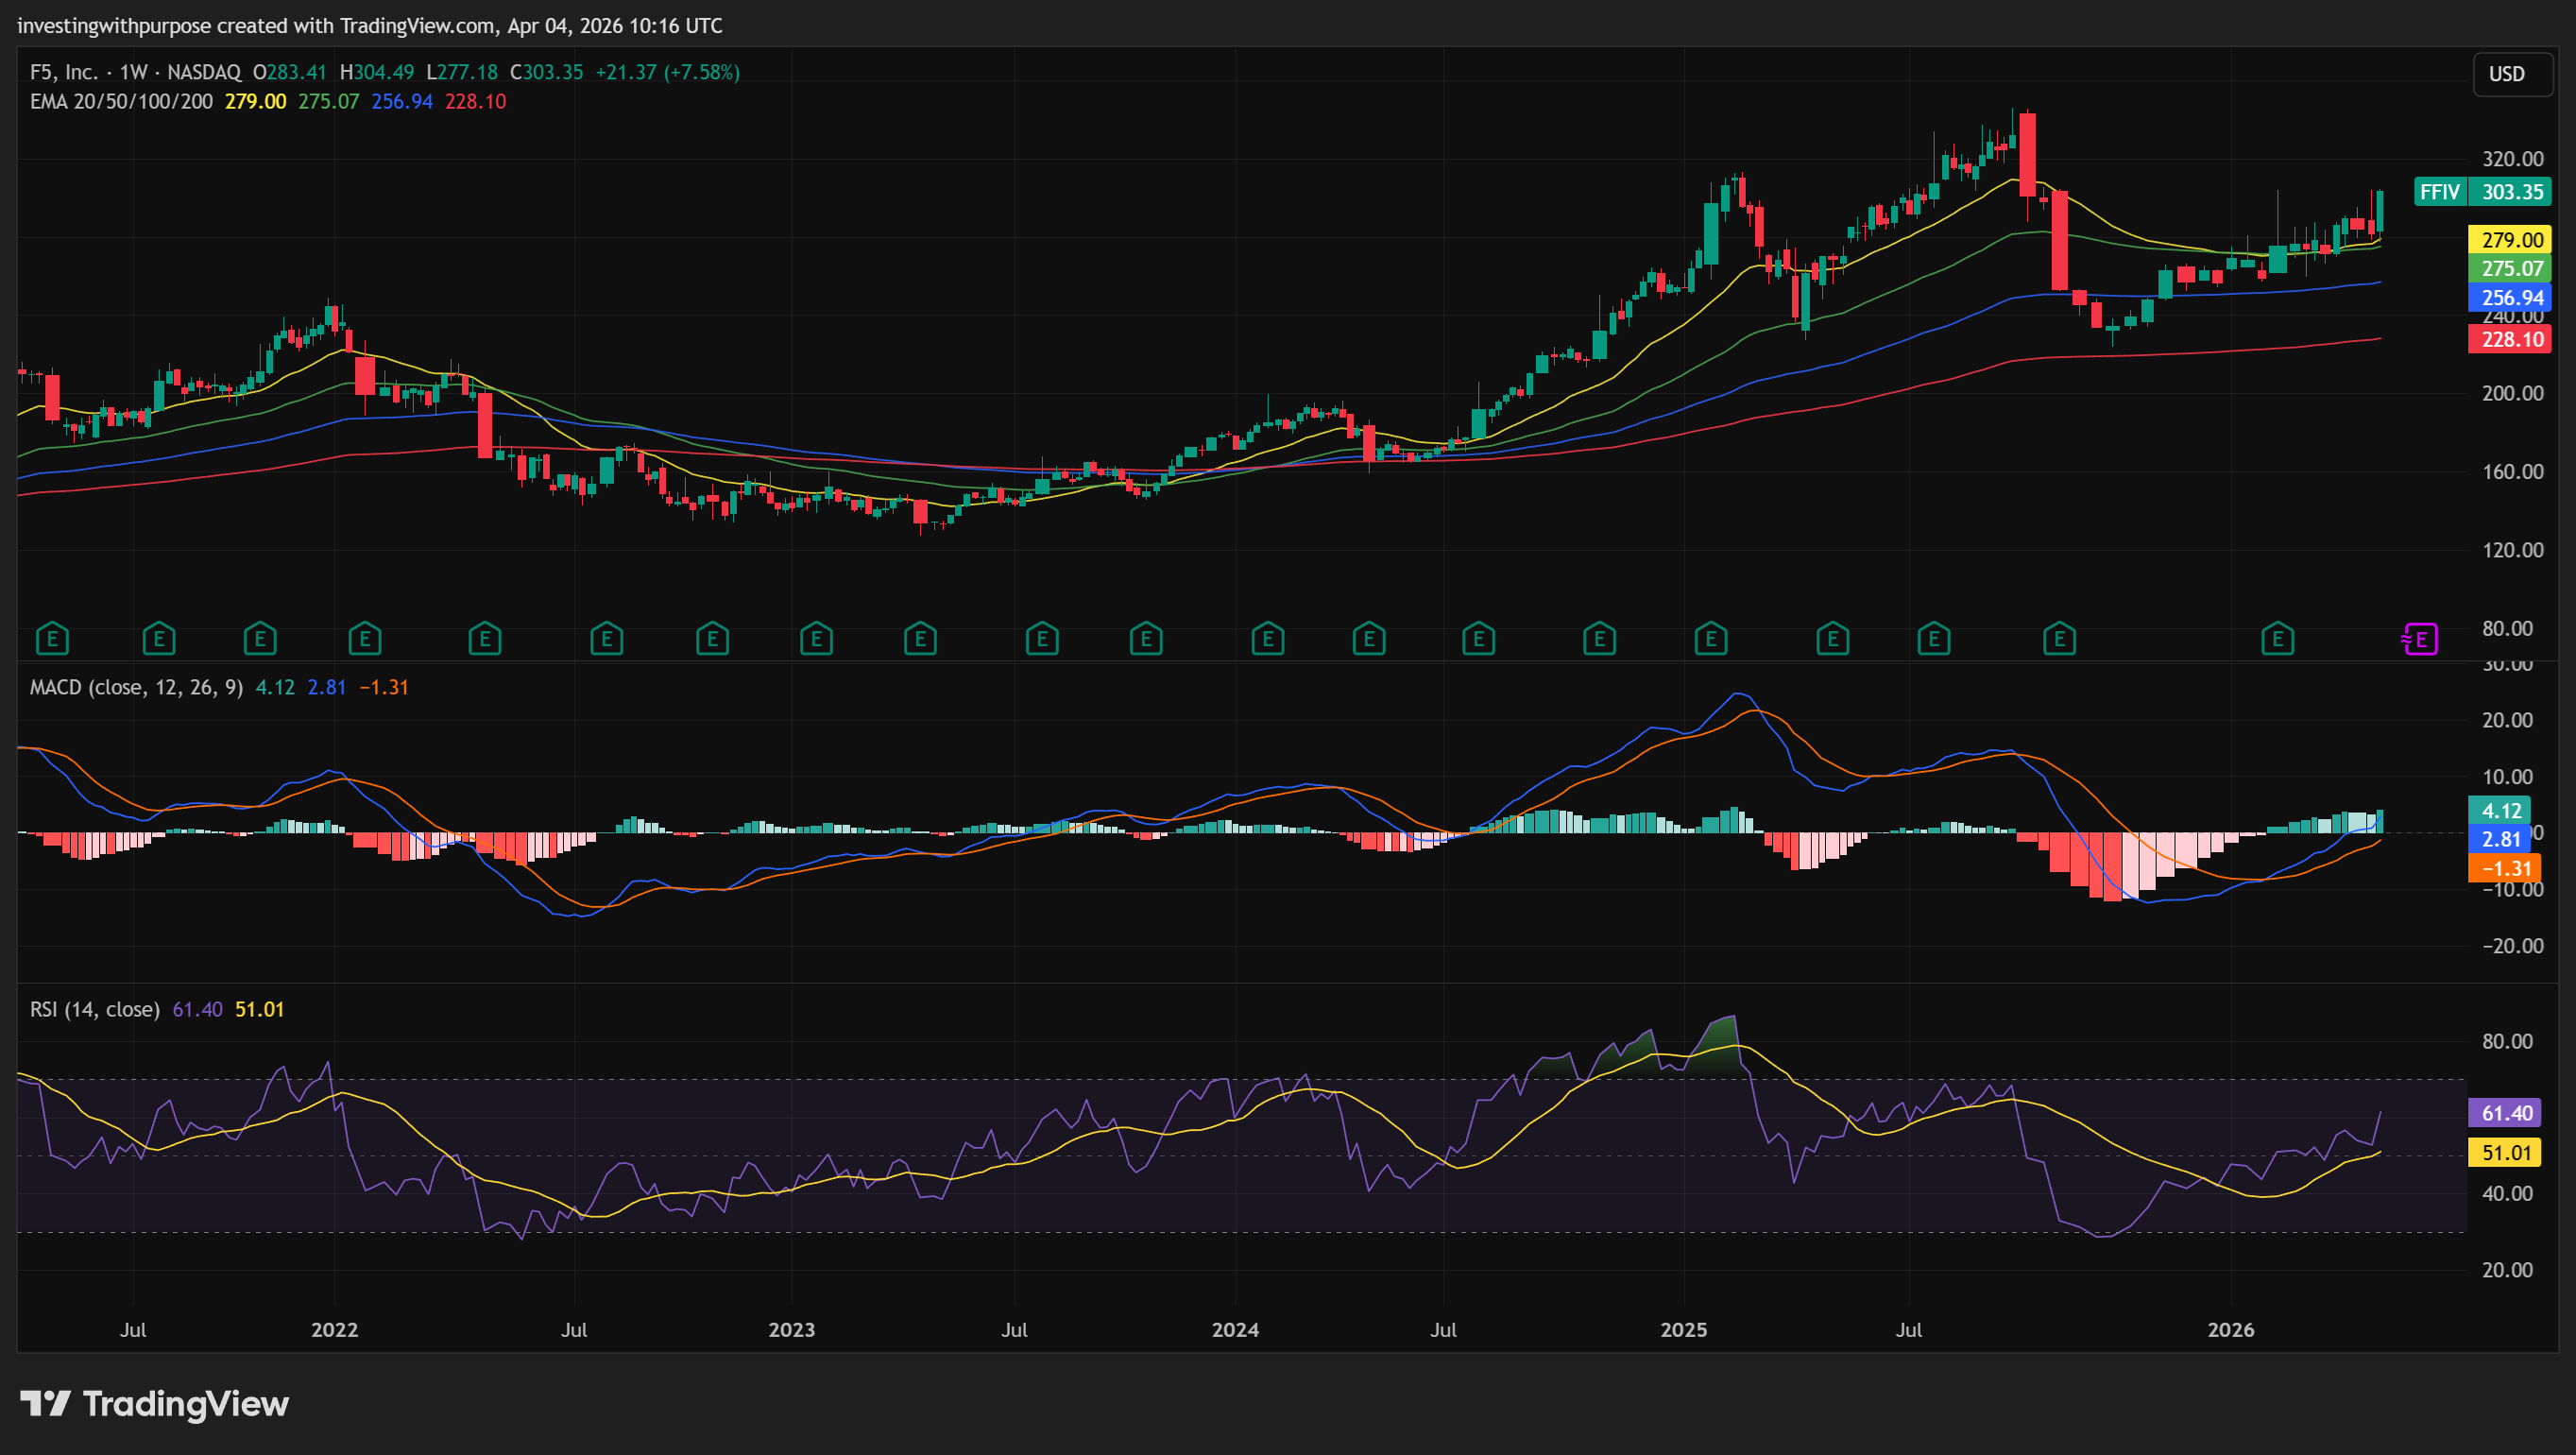
Weekly chart:
FFIV experienced a sharp decline from its 2024 highs into a multi-month base, followed by a recovery that has retraced a meaningful portion of that move
Price is now pressing into a significant resistance zone that previously acted as major supply
The Elliott Wave structure on the weekly chart carries an important caveat: the current advance may represent a corrective bounce within a larger incomplete structure, not a clean resumption of the prior bull trend
Under the bearish interpretation, a larger corrective leg remains possible if the current structure fails to break out with conviction. This is not the base case but it must be acknowledged
The weekly Kalman trend bands confirm the recovery from the lows is real, but also show price entering a zone where sellers previously dominated
Daily chart:
Price is above all key moving averages (20, 50, 100, 200 EMA) with the stack aligned bullishly
Momentum is positive but not overheated. RSI in the low 60s, MACD constructive
Recent pullbacks have been shallow and quickly bought, characteristic of an uptrend with genuine demand underneath
The key test is whether price can break and hold through the $304–306 resistance zone on a closing basis
