


The market is pulling in two directions. Mega-cap technology and semiconductors are punching to fresh highs while defense, healthcare, and consumer staples bleed out in plain sight. Beneath the index calm sits a dispersion that rewards selectivity and punishes complacency.
The macro backdrop is sending mixed signals. The 2Y at 3.78% and 10Y at 4.31% point to a Fed that markets believe is closer to easing than hiking, yet the 30Y at 4.91% keeps long-duration assets pinned. VIXY at 28.77 is elevated for a tape near all-time highs, a quiet warning that hedging demand is real. High yield (HYG) and investment grade (LQD) credit are stable, so stress is not systemic, it is concentrated. The dollar (UUP) is soft, which has supported gold, silver, and large-cap multinationals.
Friday brings April payrolls (estimate 95K versus 178K prior) and Michigan sentiment, both capable of shifting the rate path. What is rewarded: AI infrastructure, semis, hyperscalers, mega-cap quality. What is punished: defense primes, GLP-1 names, anything with broken structure.
Trade what is working. Wait on what is not.

How Our Trade Plans Work
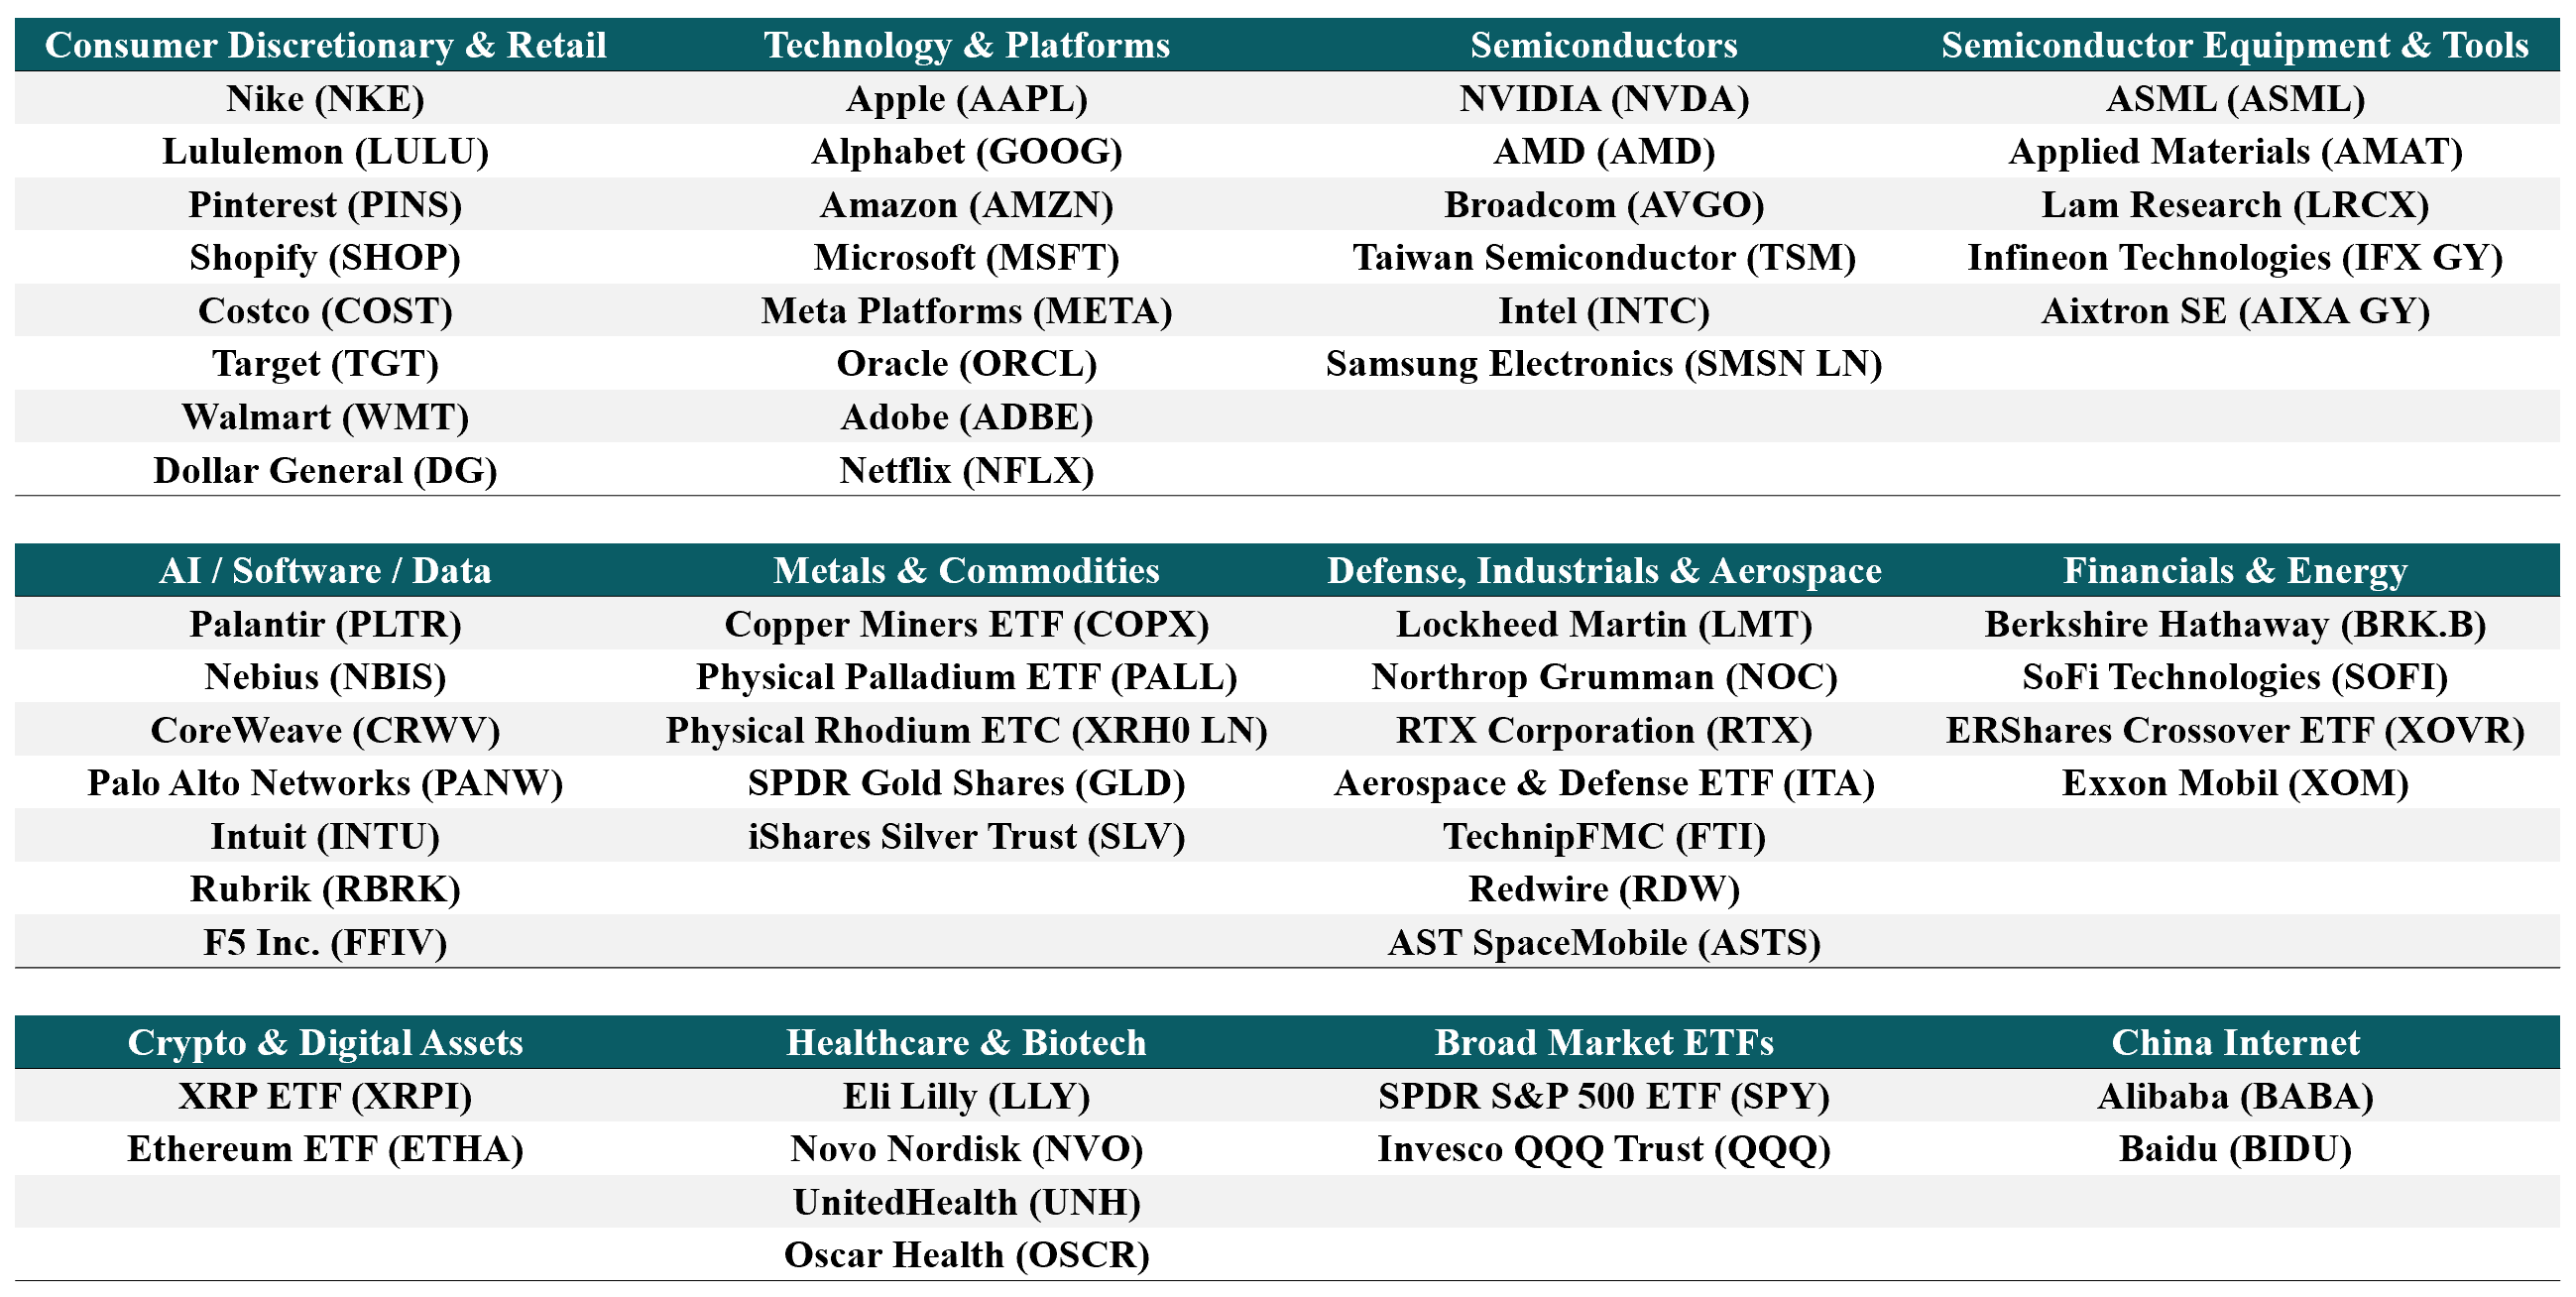
Our framework is rules-based, level-driven, and regime-classified. Every name is mapped to pre-defined structural zones where downside is known before entry. We do not chase strength, we do not average into damage, and we treat cash as a position. Regime comes first (Trend-Hold, Transitional, Repair, Breakdown), then levels, then triggers. This update covers the following 60 stocks and ETFs across consumer, technology, healthcare, industrials, and commodities.
What Has Been Working So Far
Discipline has paid in both directions. Staying out of LMT, NOC, and RTX as their daily structures collapsed kept capital away from 15 to 25 percent drawdowns inside the defense complex. Avoiding LLY and NVO during the GLP-1 unwind preserved sizing for opportunities elsewhere. The Trend-Hold framework rewarded patience in NVDA, AMD, AVGO, AMAT, and TSM, all of which extended cleanly above their EMAs week after week. Refusing to chase ADBE, INTU, and NFLX into broken weekly structures avoided knife-catch losses. XOM was correctly held in Trend-Hold context but the daily has now slipped to Transitional, a reminder that regimes change. XOVR has held its Trend-Hold designation and quietly extended. The framework’s central message remains intact: structure decides, not narrative.
This update covers the following 60 stocks and ETFs across consumer, technology, healthcare, industrials, and commodities:
Detailed Trade Setups
This report is a structured view of the market, not a set of predictions.
Every level, scenario, and setup is conditional on price behavior and market confirmation. Markets are dynamic, and outcomes depend on how price interacts with key levels, not on any single narrative. Use this as a framework for thinking, risk management, and preparation, not as a directive for action.
Apple Inc. (AAPL) Last close: 271.06
Setup: Apple is behaving like a mega-cap consolidation winner inside a benign tech tape. The 1W chart sits cleanly above all four EMAs with price at 271.06 versus EMA20 at 259.92 and EMA50 at 249.65, the longer-term moving averages that define the primary uptrend. The 1D regime is Trend-Hold with EMAs stacked tightly between 253 and 264, a coiled structure that often precedes directional resolution. The 4H shows price holding above EMA20 at 267.64 but MACD turning bearish, hinting at near-term digestion rather than breakdown. RSI on the daily at 59.7 is constructive without being stretched. That matters because Apple is not leading this tape, it is participating, and participation at this stage is enough. In plain terms, the trend is intact but the stock needs to absorb its recent gains before the next leg. If price holds the 264 to 266 zone (the daily EMA20 and Kijun cluster), the structure stays constructive. If 261.69 (EMA50) gives way, the setup shifts to Transitional. This is a trend-intact pullback candidate, not a breakout chase.
· Current regime: Trend-Hold on both 1D and 1W, fully aligned uptrend.
· Key decision zones: Support at 264.06 (1D EMA20) and 261.69 (1D EMA50). Reclaim levels are not active here, price is above them. Resistance at 280.90 (recent 4H swing high).
· If not in the position: Wait for a pullback into the 264 to 266 zone with a daily close that holds. Do not chase 271 with momentum already extended.
· Invalidation and thesis-failure rules: A daily close below 260.69 (the 61.8% Fib retracement) breaks the Trend-Hold thesis and shifts the read to Transitional. Reduce or step aside.
Adobe Inc. (ADBE) Last close: 245.44
Setup: Adobe remains a structural casualty of the software de-rating, and its weekly chart tells the truth. Price at 245.44 sits below all four weekly EMAs, with EMA50 at 323 and EMA200 at 413.91, a yawning gap that defines a broken long-term trend. The 1D has improved to Repair, with price flirting with EMA20 at 244.80 and the daily MACD turning bullish, but Repair is not Trend-Hold. The 4H is also Repair with price wedged between EMA20 and EMA50. In plain terms, Adobe is trying to build a base, but a base is not a launch pad until it is confirmed. RSI on the weekly at 36.5 reflects how damaged sentiment remains. That matters because rallies inside Breakdown structures often fail at the first major resistance. If price can reclaim and hold above 256 (1D EMA50), the repair thesis gains weight. If not, the path of least resistance remains lower toward the 224 prior low. This is a watch-only setup until structure proves itself.
· Current regime: 1D Repair, 1W Breakdown. Short-term stabilization inside long-term damage.
· Key decision zones: Support at 244.80 (1D EMA20) and 241.44 (1D Kijun). Reclaim levels at 256.01 (1D EMA50) and 274.31 (1W EMA20).
· If not in the position: Stay out. Wait for a daily close above 256 with follow-through, or a successful retest of 224 that holds.
· Invalidation and thesis-failure rules: A daily close below 241 invalidates the repair attempt and reopens 224 as a target. Step aside until a new base forms.
Aixtron SE (AIXA.DE) Last close: 46.57
Setup: Aixtron is riding the compound-semiconductor capex theme that has lifted the entire deposition equipment group. The 1D chart is pristine Trend-Hold with price at 46.57 above EMA20 at 40.07, EMA50 at 34.03, and EMA200 at 22.91, a fully stacked uptrend. RSI at 71.9 and MFI (money flow, a measure of buying pressure) at 76.6 confirm strong demand, though both flag that the move is extended. ADX at 36.8 with +DI dominating tells us the trend is strong and one-sided. In plain terms, this is a runaway leader, and runaway leaders reward patience for pullbacks rather than chasing breakouts. The Fibonacci high at 48.10 is right above price, so resistance is immediate. If price digests sideways while EMA20 catches up to 42 to 43, the setup becomes a high-quality continuation buy. If it breaks the EMA20, the first real test is EMA50 at 34. This is a strong-trend name in a momentum phase.
· Current regime: Trend-Hold on 1D, fully extended.
· Key decision zones: Support at 41.64 (Tenkan) and 40.07 (1D EMA20). Deeper support at 34.68 (38.2% Fib) and 34.03 (EMA50).
· If not in the position: Wait for a pullback into the 41 to 43 zone. Do not chase above 48.
· Invalidation and thesis-failure rules: A daily close below 34 breaks the trend and shifts the regime to Transitional. Exit on confirmation.
Applied Materials Inc. (AMAT) Last close: 417.04
Setup: Applied Materials is a core beneficiary of the AI capex super-cycle and the chart reflects it. All three timeframes are Trend-Hold with full EMA stacks. The 1W has price at 417.04 versus EMA20 at 335.94 and EMA50 at 275.57, an enormous extension that signals dominant trend rather than overheating, given ADX at 34.9. The 1D RSI at 69.3 and MACD bullish expanding confirm strength. The 4H shows BB%B at 1.08, meaning price is poking above the upper Bollinger band, classic momentum behavior. In plain terms, this stock is doing exactly what trend leaders should do: making higher highs on continued buying pressure. The risk is mean reversion, not breakdown. If price holds 396 (4H EMA20) on any pullback, the trend continues. If 380 (4H EMA50) breaks, expect a deeper consolidation toward 363 (1D EMA50). This is a trend-continuation setup where pullbacks are the only acceptable entry.
· Current regime: Trend-Hold across 1W, 1D, and 4H, fully aligned.
· Key decision zones: Support at 396.92 (4H EMA20) and 385.78 (1D EMA20). Deeper support at 363.17 (1D EMA50).
· If not in the position: Wait for a pullback into 396 to 400. Existing holders trail stops below 380.
· Invalidation and thesis-failure rules: A daily close below 363 breaks the immediate trend and signals a regime shift to Transitional. Reduce exposure.
Advanced Micro Devices Inc. (AMD) Last close: 347.81
Setup: AMD is in a vertical move and the indicators are screaming caution even as the trend remains intact. The 1D RSI at 88.9 and 4H RSI at 93.5 are deeply overbought, and the 1D MFI at 96.2 confirms aggressive buying pressure. Price at 347.81 sits 32 percent above the 1D EMA50 at 236.76, an extension that historically precedes either consolidation or sharp pullbacks. ADX on the 4H at 63.9 is extreme. In plain terms, the trend is real but the stock is running so hot that chasing it here is a coin flip on near-term outcome. The weekly remains Trend-Hold with price above all EMAs and Fibonacci high at 352.99 essentially marking current price. That matters because round-trip risk on parabolic moves is high. If price consolidates above 290 (1D Tenkan), the trend resumes. If it loses 270 (1D Kijun and 50% Fib), expect a deeper unwind. This is a strong trend in an overbought condition, not an entry point.
· Current regime: Trend-Hold across all timeframes, deeply extended.
· Key decision zones: Support at 299.34 (1D Tenkan) and 272.91 (1D Kijun). Deeper support at 236.76 (1D EMA50).
· If not in the position: Do not chase. Wait for a pullback into 290 to 300 with stabilization.
· Invalidation and thesis-failure rules: A daily close below 270 signals trend exhaustion and a likely move toward 236. Trim or exit on confirmation.
Amazon.com Inc. (AMZN) Last close: 263.99
Setup: Amazon has broken out to fresh highs and behaves like a renewed leader inside the mega-cap complex. The 1W shows price at 263.99 essentially tagging the Fibonacci high of 264.50, with all four weekly EMAs stacked below. The 1D is Trend-Hold with RSI at 80.4 and MFI at 87.6, deeply overbought but consistent with breakout extension. The 4H confirms the same picture with BB%B at 1.04. In plain terms, Amazon is doing what stocks do when they clear multi-month resistance: they accelerate. The risk is not direction but timing. Buying at all-time highs without a pullback offers poor risk-reward. If price holds 249 (4H EMA20) on any digest, continuation is high-probability. If 235 (4H EMA50) breaks, the breakout is in question. This is a confirmed breakout in need of a pullback to enter.
