

Trade Plan: Week 2 May 2026
Narrow Leadership, Rising Hedges, and a Tape That Still Rewards Discipline

The market setup is diverging. Mega-cap technology and semiconductors are pressing fresh highs while defense, healthcare staples, and select consumer names are quietly distributing under the surface. Beneath an SPY just inches from all-time highs, leadership is narrowing.
The macro backdrop is mixed. The 10-year yield at 4.39% and the 30-year at 4.97% keep duration-sensitive assets pinned, while volatility (VIXY at 27.43) is creeping despite index strength, a quiet warning that hedging demand is rising. High-yield credit (HYG) softened modestly and the dollar firmed, both subtle de-risking tells. CPI on Tuesday is the high-impact print of the week and the most likely catalyst for a directional move; Core PPI Wednesday and Retail Sales Thursday extend the read.
The tape is rewarding semiconductors, hyperscalers, and idiosyncratic turnaround stories (INTC, UNH, IFX). It is punishing defense primes, China consumer, and rate-sensitive defensives. Posture for the week: respect the trend, but do not chase extension.

How Our Trade Plans Work
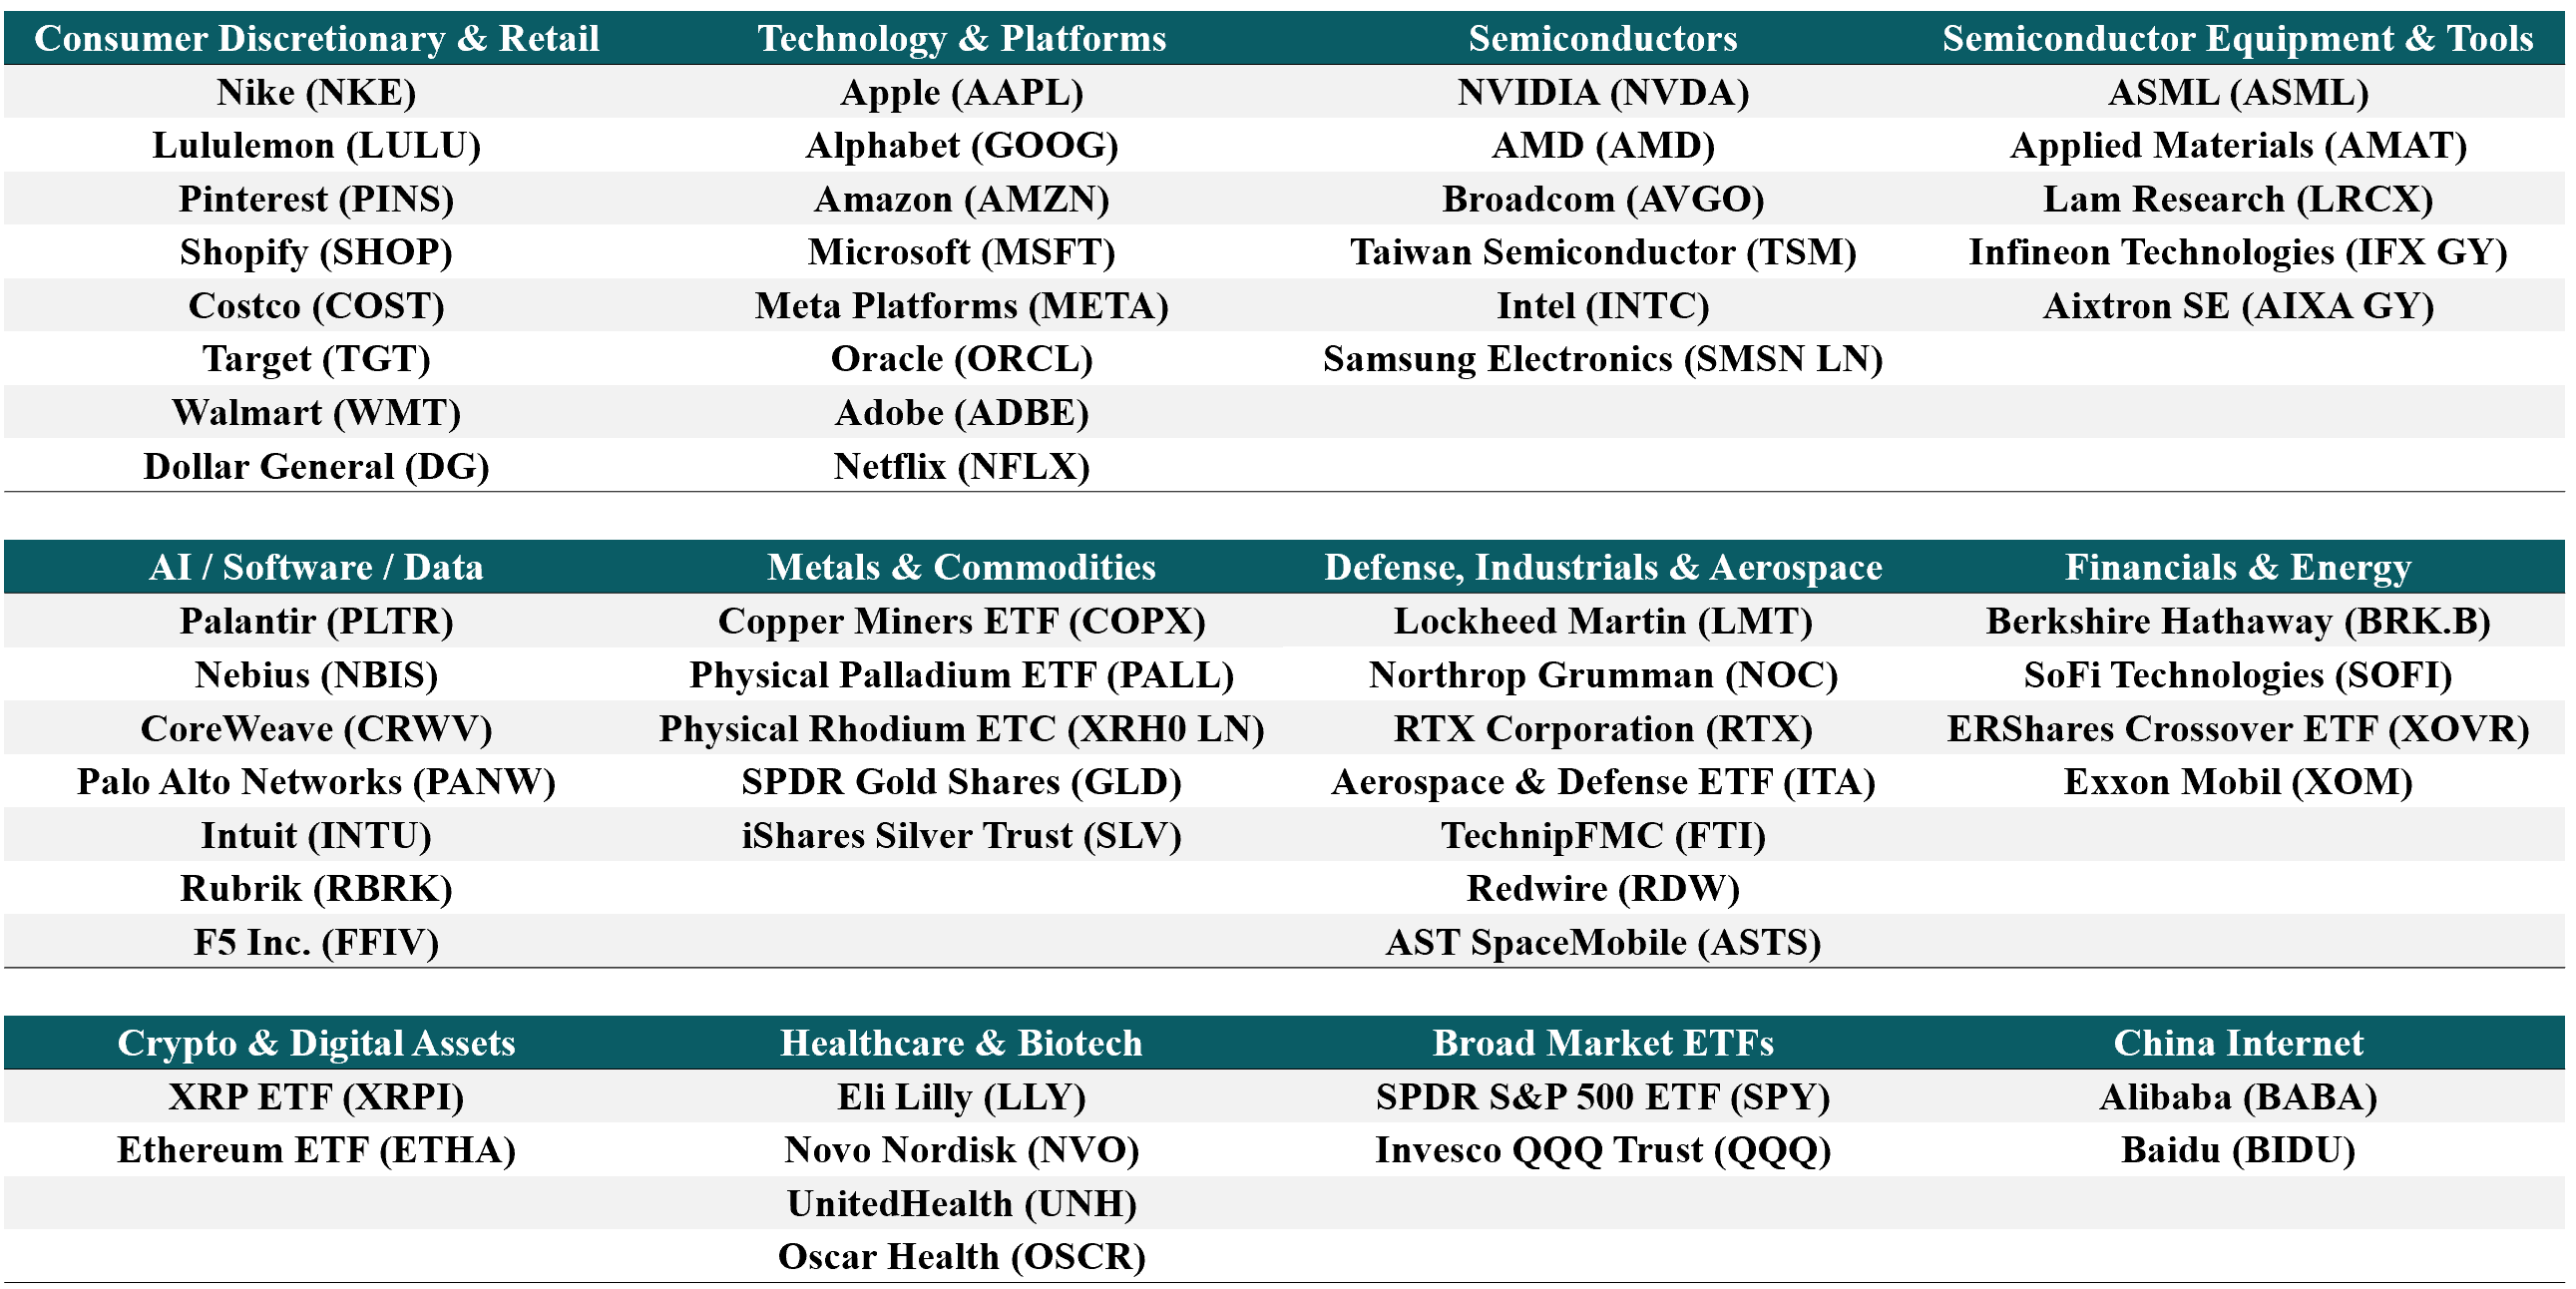
Our framework is rules-based and level-driven. We classify each name into a regime (Trend-Hold, Transitional, Repair, or Breakdown) using daily EMA structure, cross-checked against the weekly chart for context. We act only at pre-defined levels where downside is known. Cash is a position. Waiting is part of the plan. This update covers the following 60 stocks and ETFs across consumer, technology, healthcare, industrials, and commodities.
What Has Been Working So Far
Discipline is paying. Staying out of LULU, NKE, and DG kept capital away from continued breakdowns where each new low confirmed the next. NOC remained a no-touch Breakdown all week, sparing exposure to a defense unwind that has only deepened. The Trend-Hold cohort, AAPL, AMZN, AVGO, GOOG, COST, WMT, FTI, has done what trend names should: pull back, hold structural support, advance again. INTC’s parabolic run validated the rule that you do not fight a confirmed weekly Trend-Hold even when daily RSI screams overbought. On the commodity side, GLD and SLV held their weekly Trend-Hold designations while patience replaced chasing on the daily, an outcome the framework rewarded. META is the cautionary case this week: it sat firmly in Trend-Hold last Sunday and has since flipped to daily Breakdown, a reminder that regimes change and trailing risk discipline matters more than entry conviction. The framework’s value is not only in catching every move; it is in sidestepping the moves that quietly compound losses, and in respecting the levels that say a trend has ended.
This update covers the following 60 stocks and ETFs across consumer, technology, healthcare, industrials, and commodities:
Detailed Trade Setups
This report is a structured view of the market, not a set of predictions.
Every level, scenario, and setup is conditional on price behavior and market confirmation. Markets are dynamic, and outcomes depend on how price interacts with key levels, not on any single narrative. Use this as a framework for thinking, risk management, and preparation, not as a directive for action.
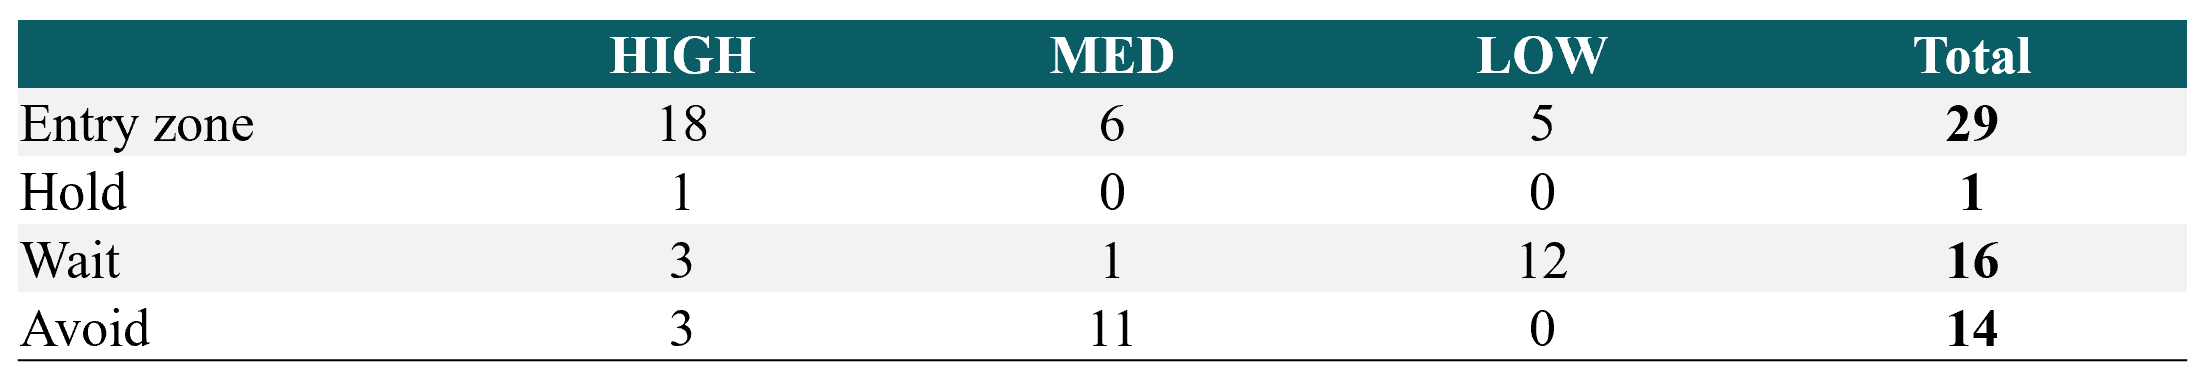
Full trade plan summary table at the end.
Apple Inc. (AAPL) Last close: 280.14
Setup: Apple is behaving like the index anchor it is, grinding to fresh highs alongside the broader mega-cap complex. All three timeframes align in Trend-Hold, the highest-confidence configuration in our framework. On the weekly, price sits well above the 20-week average at 261.84 and the 50-week at 250.84, with momentum (MACD) expanding bullishly. The daily shows price tagging the upper Bollinger Band at 1.00, a sign of strength but also short-term extension. The 4-hour chart confirms momentum is intact but with MFI (money flow, a measure of buying pressure) at 62, not yet stretched. That matters because it suggests buyers are absorbing supply rather than chasing. The 1D EMA20 at 267.39 is the first pullback layer to watch; below that, the EMA50 at 263.59 is the structural line in the sand for the trend. If 267 holds on any dip, this remains a buy-the-pullback name. If it breaks decisively, regime softens to Transitional and patience replaces accumulation. This is a textbook Trend-Hold continuation setup.
· Current regime: Trend-Hold across 1W, 1D, and 4H. All three timeframes agree, conviction is high.
· Key decision zones: Support at 267.39 (1D EMA20) and 263.59 (1D EMA50). Reclaim levels are not relevant; price leads structure here.
· If not in the position: Wait for a pullback toward 267 to 270 with the 4H not breaking down. Avoid chasing prints above 280 into extension.
· Invalidation and thesis-failure rules: A daily close below 263.59 (EMA50) breaks the trend structure and shifts the regime to Transitional. Reduce exposure, do not average down.
Adobe Inc. (ADBE) Last close: 250.71
Setup: Adobe remains a structural problem child. The weekly chart is in clear Breakdown with price miles below the 50-week (320.17) and 100-week (370.47), and the 1W RSI at 38.6 confirms persistent weakness. The daily chart, however, is in Repair: price has reclaimed the EMA20 at 244.92 and is pressing the EMA50 at 253.98, a critical near-term gate. The 4-hour shows Transitional behavior as price hovers inside the cloud. Put simply, this is short-term healing inside long-term damage. That matters because Repair-stage rallies inside weekly Breakdowns frequently fail at the first major resistance, which here is the daily EMA50 around 254 and the 38.2% retracement at 261.98. Until those reclaim, the bias remains skeptical. If ADBE can close decisively above 260 on the daily with momentum intact, the case improves to a measured Repair trade. If it rejects 254, the prior lows near 224 come back into view. This is a watch-only setup until structure confirms.
· Current regime: 1D Repair, 1W Breakdown. Short-term healing inside a longer-term downtrend, low-conviction zone.
· Key decision zones: Support at 244.92 (1D EMA20) and 224.13 (multi-month low). Reclaim levels at 253.98 (1D EMA50) and 261.98 (38.2% Fib).
· If not in the position: Do not anticipate. Wait for a daily close above 261 with follow-through volume. Avoid bottom-fishing.
· Invalidation and thesis-failure rules: A daily close below 240 reopens the path to 224 and invalidates the Repair thesis. Stay flat.
Aixtron SE (AIXA.DE) Last close: 46.98
Setup: Aixtron is riding the broader compound semiconductor tailwind that has lifted the European chip equipment complex. The daily chart is in clean Trend-Hold with price stacked above all four EMAs and the 1D EMA20 at 41.64 acting as the dynamic floor. RSI at 67 is firm but not overbought, and ADX at 36.6 with strong +DI confirms a directional, not chop-driven, advance. Price sits just below the recent high at 48.10, and the Ichimoku read is constructive (above cloud). That matters because it tells us institutional buyers are setting the trend, not retail spikes. With no 4H data available, we anchor our levels off the daily. If 41.64 holds on any pullback, the trend continuation case is intact. A break below the EMA50 at 35.61 would be the structural warning. This is a Trend-Hold continuation setup, best entered on weakness rather than chased into resistance at 48.
· Current regime: Trend-Hold on the daily, the only available swing timeframe.
· Key decision zones: Support at 41.64 (1D EMA20) and 39.48 (Kijun, a momentum reference). Reclaim level at 48.10 to confirm new highs.
· If not in the position: Wait for a pullback to 42 to 43 to add. Do not chase 47 to 48.
· Invalidation and thesis-failure rules: A daily close below 39.48 weakens the trend; below 35.61 (EMA50) breaks it outright. Step aside.
Applied Materials Inc. (AMAT) Last close: 389.08
Setup: Applied Materials is a Trend-Hold name showing its first signs of fatigue. The weekly chart still shows clear uptrend stacking, with price well above the 50-week at 280, but the 1D MACD has flipped bearish and is accelerating, a yellow flag for short-term momentum. The 4-hour is now Transitional with price hugging the EMA20 from below. That matters because in a Trend-Hold, the first pullback to the daily EMA20 (387.48) is normally bought; if that fails, the next test is the EMA50 at 368.08. Williams%R at -72 says the daily is short-term oversold inside the broader uptrend. The setup tells you to be patient: a clean reclaim of 400 with daily MACD turning back up reactivates the trend. A failure at 387 brings 368 into play, where deeper buyers should reappear. This is a Trend-Hold cooling phase, not a breakdown.
· Current regime: 1D Trend-Hold, 4H Transitional. Short-term softness inside a longer-term uptrend.
· Key decision zones: Support at 387.48 (1D EMA20) and 368.08 (1D EMA50). Reclaim level at 400 to restore momentum.
· If not in the position: Wait for a pullback to 370 to 375 with a daily reclaim of 387 before adding. Avoid buying mid-range.
· Invalidation and thesis-failure rules: A daily close below 368 (EMA50) shifts the read to Transitional and pauses fresh entries.
Advanced Micro Devices Inc. (AMD) Last close: 360.54
Setup: AMD is the textbook expression of AI-cycle momentum. Every timeframe is Trend-Hold, weekly RSI at 78.8 and daily RSI at 79.8 both show extension, but ADX above 48 on the daily confirms a powerful directional regime. Price is pressing the all-time high near 362.79, with weekly Bollinger %B above 1.18 (price outside the band, a sign of acceleration). That matters because such extensions often resolve in sideways consolidation rather than reversals when ADX is rising and -DI stays low. The daily MACD is fading, suggesting the next move could be a pause. The 1D EMA20 at 294.96 is the realistic first pullback level, with deeper structural support at 277.83 (Kijun). If AMD consolidates above 320 and resumes higher, the trend extends. A daily close below 294 changes the math. This is a Trend-Hold name where existing holders trail rather than add at extension.
· Current regime: Trend-Hold across 1W, 1D, 4H. Strong alignment.
· Key decision zones: Support at 323.60 (4H EMA20) and 294.96 (1D EMA20). Reclaim is not relevant here; trend is already extended.
· If not in the position: Do not chase 360. Wait for consolidation toward 320 to 330. For existing holders, trail stops below 294.
· Invalidation and thesis-failure rules: A daily close below 277.83 (Kijun) breaks the structure and forces a regime downgrade.
Amazon.com Inc. (AMZN) Last close: 268.26
Setup: Amazon is acting like the consumer-cloud bellwether in this leg, pushing toward the 273.88 high on rising momentum. All three timeframes are Trend-Hold. Daily RSI at 78.1 and MFI at 77.2 show buying pressure is real but stretched. The 4-hour MACD has begun stabilizing rather than expanding, hinting at near-term digestion. Put simply, the trend is healthy but due for a breather. The 1D EMA20 at 248.71 is the first structural buy zone, with the EMA50 at 234.27 the deeper line. The Kijun on the weekly at 234.94 also clusters there, creating a strong confluence support. If 248 holds on the next dip, accumulation behavior continues. If it breaks, watch 234 closely. This is a Trend-Hold continuation; new entries belong on weakness, not breakouts.
· Current regime: Trend-Hold across 1W, 1D, 4H.
· Key decision zones: Support at 248.71 (1D EMA20) and 234.27 (1D EMA50). Resistance at 273.88 (recent high).
· If not in the position: Wait for a pullback to 250 to 255. Existing holders trail below 244.
· Invalidation and thesis-failure rules: A daily close below 234 breaks the trend and triggers regime downgrade to Transitional.
ASML Holding N.V. (ASML) Last close: 1427.02
Setup: ASML is a Trend-Hold name in mid-trend pause. Weekly structure remains intact with price above all key EMAs, but the 1W MACD has turned bearish accelerating, a momentum cooling signal that often precedes a multi-week consolidation. The daily is flattening: RSI at 51, MACD bearish stabilizing, price right at the EMA20 (1421.96). The 4-hour is also Transitional, with price chopping around the EMA20 and EMA50. That matters because when slow trends pause, the buy zone is the next major support, here the EMA50 on the daily at 1393.24 or the 38.2% Fib at 1317.60. A reclaim of 1450 reactivates upside; failure at 1390 puts 1320 in play. This is a Trend-Hold consolidation phase, best treated as wait-for-pullback rather than breakout.
