
Trade Plan: Week 3 May 2026
AI leads, weak structures bleed, and patience remains the edge.

Mega-cap technology and semiconductors are pressing into fresh highs while defense, healthcare bellwethers, and consumer discretionary continue to bleed. One side of the market is celebrating a productivity boom; the other is quietly pricing a slowdown.
The macro backdrop tells the story. The 2Y at 3.9% versus the 30Y at 4.95% keeps the curve steep, signaling a market that expects easier short rates but stickier long-term inflation. QQQ at 711 (+2.33%) is leading SPY at 737 (+0.81%) by a wide margin, classic risk-on rotation into growth. Yet VIXY at 27 is elevated and HYG credit barely participated, a hint that beneath the surface, conviction is uneven. The dollar (UUP) softened, which has supported precious metals and select foreign equities.

What the setup is rewarding: AI infrastructure, semiconductor capital equipment, and quality compounders that are reclaiming structure. What it is punishing: defense primes, GLP-1 incumbents under pressure, and discretionary names with eroding unit economics. Posture for the week: respect the trends that are working, refuse to rescue the ones that are not.
How Our Trade Plans Work
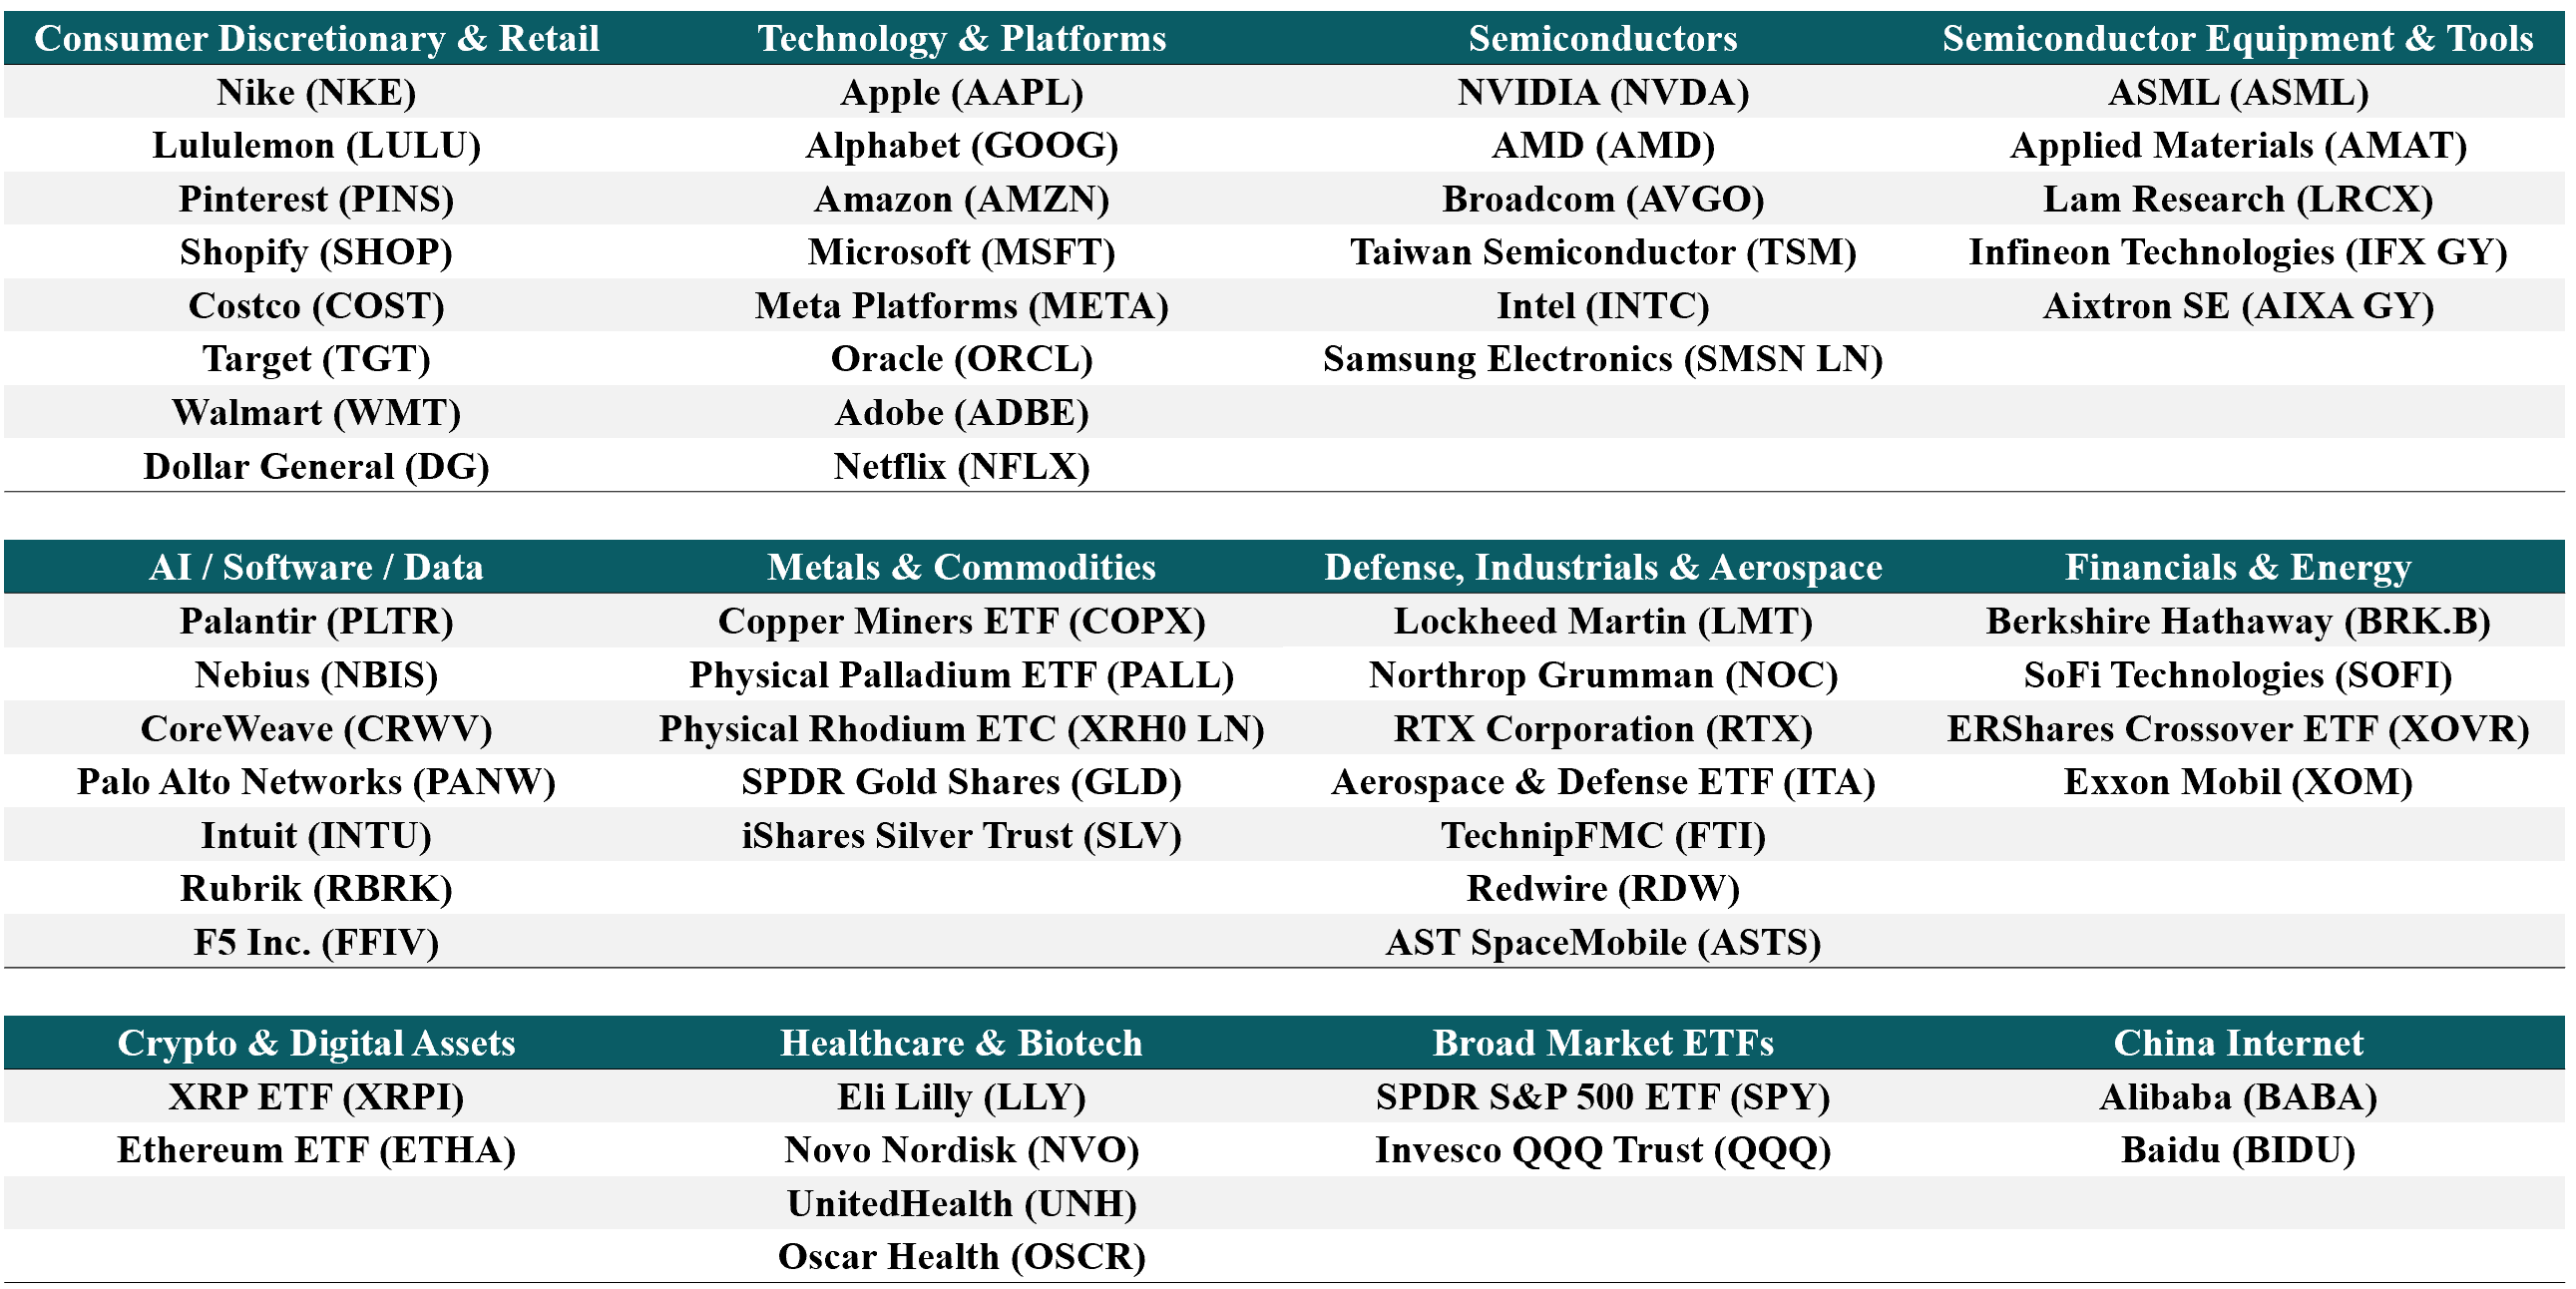
Our framework is rules-based and level-driven. We classify each name into one of four regimes (Trend-Hold, Transitional, Repair, Breakdown) using daily moving-average alignment, then cross-check against the weekly chart for structural context. We act only at predefined levels where downside risk is known. Cash is a position. Waiting is part of the plan. This update covers the following 60 stocks and ETFs across consumer, technology, healthcare, industrials, and commodities.
What Has Been Working So Far
The framework has continued to do its primary job: keeping capital away from structurally damaged names while letting trend leaders run. XOM is the cautionary case this week: it sat in Trend-Hold last Sunday with a pullback entry zone at 148 to 150, a level that was hit during this week’s slide to 144 before the daily structure downgraded; the reminder is that trailing-stop discipline matters more than entry conviction once a regime shifts. The discipline of waiting for confirmation before acting on XRPI at 7.37 spared exposure to further weekly breakdown. XOVR finally earned its Trend-Hold tag this week, with price reclaiming 18.81 above all four daily EMAs to justify constructive engagement. On the leadership side, the AI semiconductor complex (AMD, AMAT, LRCX, ASML, NVDA, AVGO) has rewarded trend followers who held through pullbacks to the 20-day average. Defensive avoidance of LMT, NOC, and RTX as they sliced through structure has prevented meaningful drawdowns. The framework’s posture, that oversold inside Breakdown is not a buy signal, has been validated repeatedly. Patience and rules have continued to compound.
Detailed Trade Setups
This article is a structured view of the market, not a set of predictions.
Every level, scenario, and setup is conditional on price behavior and market confirmation. Markets are dynamic, and outcomes depend on how price interacts with key levels, not on any single narrative. Use this as a framework for thinking, risk management, and preparation, not as a directive for action.
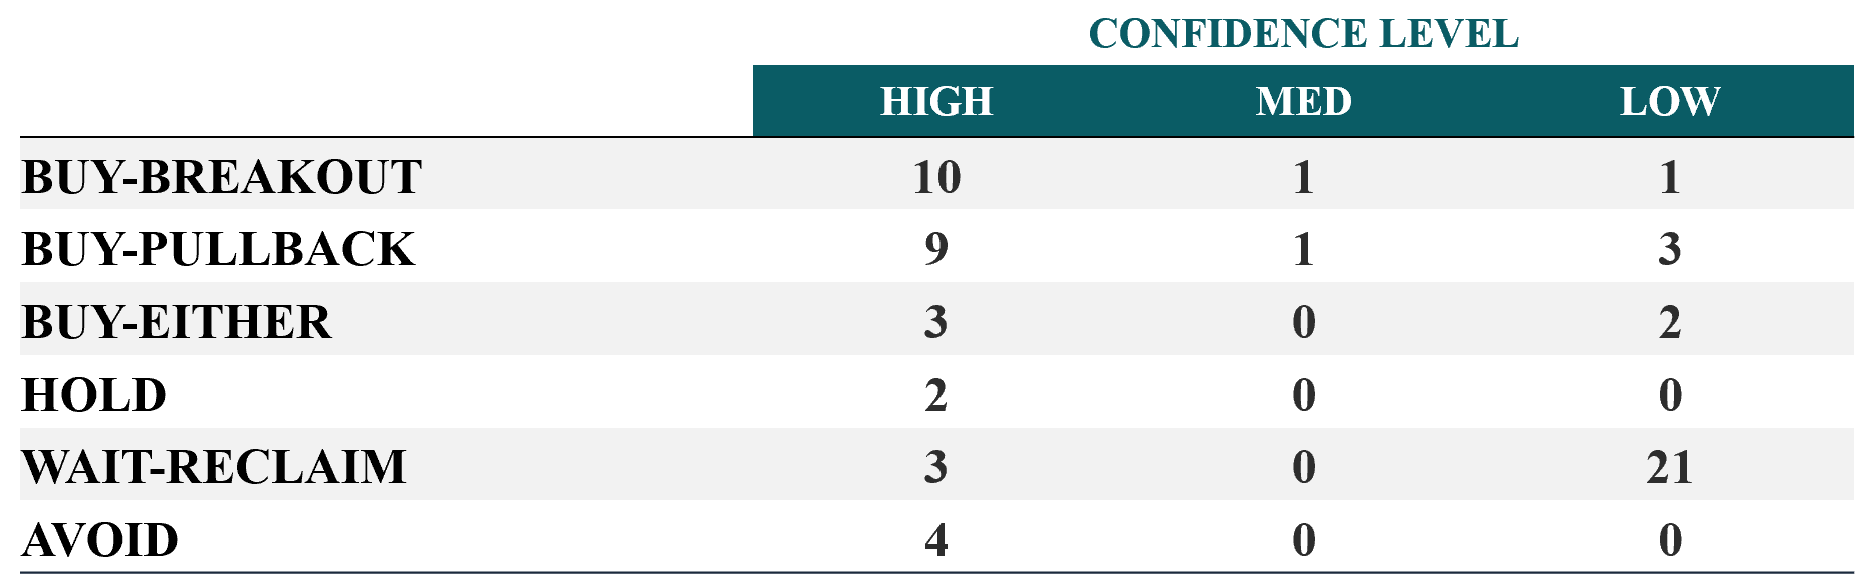
Full trade plan summary table at the end.
Apple Inc. (AAPL) Last close: 293.32
Setup: Apple is behaving like a structural leader within a setup that is increasingly rewarding mega-cap quality. The 1W chart sits in clear Trend-Hold with price (293.32) extended above the 20-week average at 264.84 and the 50-week at 252.51, the half-year average price. Daily RSI at 74 reflects strong momentum, and the daily Bollinger %B at 1.04 indicates price has pushed above the upper volatility band, a sign of trend acceleration but also short-term extension. The 4H chart confirms momentum with price above all EMAs and ADX at 34.7, meaning the trend has real strength. That matters because when weekly, daily, and intraday timeframes all align in Trend-Hold, conviction is highest. In plain terms, Apple is in a confirmed uptrend with no structural cracks. The tradeable risk is short-term overextension, not regime damage. If price holds the 20-day average at 274.80 on any pullback, the trend remains intact. If it loses 266 (the 50-day), the setup downgrades to Transitional. This is a trend-continuation setup, not a fresh entry zone.
· Current regime: Trend-Hold across 1W, 1D, and 4H, fully aligned.
· Key decision zones: Support at 274.80 (EMA20, 20-day average) and 266.65 (EMA50, 50-day average). Reclaim levels are not relevant; price is above all EMAs.
· If not in the position: Do not chase here. Wait for a pullback to the 274 to 280 zone, where the 20-day average sits, before initiating.
· Invalidation and thesis-failure rules: A daily close below 261.47 (EMA200) breaks the trend. Reduce or exit if that level fails.
Adobe Inc. (ADBE) Last close: 253.04
Setup: Adobe remains the mirror image of mega-cap leadership. The 1W chart is still in Breakdown with price (253) below the 20-week (270), 50-week (317), and 100-week (368) averages, evidence of multi-year structural damage. The 1D chart, however, has shifted to Transitional, with price now sitting just above the 20-day (248) and 50-day (249), a sign of stabilization. Daily MACD is bullish but fading, and the Ichimoku cloud shows price inside, neither bullish nor bearish. In plain terms, Adobe is attempting to build a base, but the weekly damage means any rally is a repair attempt, not a confirmed trend. That matters because oversold conditions inside structural breakdown are not buy signals; they are pauses before the next leg lower or before a base completes. If price can reclaim 265 (the 61.8% retracement) and hold, the daily structure improves. If it loses 248, the Transitional read fails and the breakdown resumes. This is a base-building setup, watch only, no action yet.
· Current regime: 1D Transitional, 1W Breakdown: short-term stabilization inside a longer-term downtrend.
· Key decision zones: Support at 248.02 (EMA20) and 241.78 (Kijun, mid-range trend marker). Reclaim levels at 259.89 (EMA100) and 281.50 (EMA200).
· If not in the position: No action. Wait for a confirmed reclaim of 281 (the 200-day average) on rising volume before considering entry.
· Invalidation and thesis-failure rules: A daily close below 241 fails the base. Stay out until structure repairs further.
Aixtron SE (AIXA.DE) Last close: 50.04
Setup: Aixtron is a textbook semiconductor capital-equipment momentum story tied directly to the AI build-out. The 1W chart shows price (50.04) extended far above all EMAs, with the 20-week at 32.92 and 200-week at 16.64, an extreme expansion that reflects a multi-year regime change. Weekly RSI at 91 and ADX at 59 confirm one of the strongest trends in our universe. The 1D chart is also Trend-Hold with price above all four EMAs. That matters because compound semiconductor deposition equipment is critical to AI accelerator manufacturing, and the chart is pricing that demand. In plain terms, this is a name in full breakout mode. The risk is not regime failure, it is mean reversion after vertical extension. If price holds the 20-day at 44.82 on any pullback, the trend is intact. If it loses 38.17 (the 50-day), the structure cracks and the move pauses materially. This is a hold-and-trail setup for existing holders, not a chase entry.
· Current regime: Trend-Hold on both 1W and 1D, no 4H data available.
· Key decision zones: Support at 44.82 (EMA20) and 38.17 (EMA50). No reclaim levels needed; price above all EMAs.
· If not in the position: Do not chase. Wait for a pullback to the 44 to 47 zone before considering entry.
· Invalidation and thesis-failure rules: A daily close below 38 breaks the trend. Reduce exposure on that signal.
Applied Materials Inc. (AMAT) Last close: 435.46
Setup: Applied Materials is leading the semiconductor capital-equipment complex alongside LRCX and ASML. The 1W chart is firmly Trend-Hold with price (435) above the 20-week (350), 50-week (286), and 200-week (197), reflecting a structural bull market in chip equipment spending. Weekly RSI at 71 shows overbought, but in trend-hold regimes this is strength, not a reversal signal. Daily and 4H charts both confirm Trend-Hold with all EMAs stacked bullishly. Daily MACD is bullish and expanding. That matters because AI capacity build-out is being financed by every major foundry simultaneously, and AMAT is a primary beneficiary. In plain terms, the trend is intact at every timeframe. If price holds the 20-day average at 399 on any pullback, the trend remains in good standing. If it loses 380 (the 50-day), the read shifts to Transitional. This is a trend-continuation setup; entries should be on weakness, not strength.
· Current regime: Trend-Hold across 1W, 1D, and 4H.
· Key decision zones: Support at 399.17 (EMA20) and 380.90 (EMA50). No reclaim levels; price is above all EMAs.
· If not in the position: Wait for a pullback toward 400 before initiating. Avoid chasing the upper Bollinger band at 1.12.
· Invalidation and thesis-failure rules: A daily close below 361 (EMA100) breaks the trend. Reduce on that signal.
Advanced Micro Devices Inc. (AMD) Last close: 455.19
Setup: AMD has been one of the cleanest momentum trades in the entire market. The 1W chart shows price (455) extended dramatically above all EMAs, with the 20-week at 262 and 200-week at 154, an enormous expansion. Weekly RSI at 85 and daily ADX at 57.9 (one of the highest readings in our universe) confirm an exceptionally strong trend. All three timeframes are aligned in Trend-Hold. Daily Bollinger %B at 1.06 shows price riding the upper band, a hallmark of momentum acceleration. That matters because AMD has captured genuine share in AI accelerators, and the market is repricing its earnings power. In plain terms, the trend is unbroken and powerful, but the magnitude of the move means short-term mean reversion risk is high. If price holds 337 (the 20-day) on any pullback, the trend is fully intact. If it loses 280 (the 50-day), the move requires reassessment. This is a hold-and-trail setup, not a fresh-entry chase.
· Current regime: Trend-Hold across 1W, 1D, and 4H, exceptionally strong.
· Key decision zones: Support at 337.06 (EMA20) and 280.56 (EMA50). No reclaim levels; price above all EMAs.
· If not in the position: Do not chase here. Wait for any pullback to the 380 to 400 zone before considering entry.
· Invalidation and thesis-failure rules: A daily close below 280 breaks the trend. Trim or exit on that signal.
Amazon.com Inc. (AMZN) Last close: 272.68
Setup: Amazon is acting like a quality compounder in clean trend, but the 4H is showing the first hints of short-term exhaustion. The 1W and 1D charts are both Trend-Hold with price above all EMAs. Daily RSI at 77 reflects strong momentum. However, the 4H chart shows MACD turning bearish and accelerating lower, with Williams %R deeply oversold at -83.8 on volume metrics, a sign that intraday buying pressure has paused. That matters because the higher-timeframe trend is healthy, but a short-term pullback would be normal and welcome. In plain terms, the trend is intact; the immediate setup is just extended. If price holds 258 (the 20-day) on any pullback, the structure is fully preserved. If it loses 239 (the 50-day), the trend is in jeopardy. This is a trend-continuation setup with a near-term wait-for-pullback bias.
· Current regime: Trend-Hold on 1W and 1D; 4H showing short-term momentum fading inside the larger trend.
· Key decision zones: Support at 258.12 (EMA20) and 239.81 (EMA50). No reclaim levels; price above all EMAs.
· If not in the position: Wait for a pullback into the 258 to 265 zone before initiating. Avoid chasing.
· Invalidation and thesis-failure rules: A daily close below 230 (EMA100) breaks the trend. Reduce on that level.
ASML Holding N.V. (ASML) Last close: 1591.78
Setup: ASML is the third leg of the semiconductor equipment trio (with AMAT and LRCX) and the structurally tightest of the three. The 1W chart is in clean Trend-Hold with price (1592) above all EMAs and ADX at 29.5. Daily and 4H charts both confirm Trend-Hold across all averages. Daily MACD is bullish and expanding. That matters because EUV lithography remains a near-monopoly franchise and the AI capex cycle continues to support multi-year demand visibility. In plain terms, this is one of the highest-quality trend names in technology. If price holds 1454 (the 20-day) on any pullback, the structure is fully intact. If it loses 1419 (the 50-day), the trend is impaired. This is a trend-continuation setup; entries belong on weakness.
