

The market is walking a tightrope this week, and it’s doing it well… but not comfortably.
Rates remain elevated, with the 10-year holding near 4.26% and the 30-year pushing 4.88%, keeping pressure on valuations. Yet at the same time, credit markets are calm, volatility is easing, and long-duration assets are quietly catching a bid. That combination tells you something important: this is not a risk-off environment. It’s a selective risk-on.
And the tape is reflecting that shift clearly.
Capital is rotating into momentum and growth. Small caps are leading. Cyclicals are outperforming. AI, semiconductors, and commodity-linked names are being bid. Meanwhile, defensives and balance sheet-heavy names are being trimmed, not because they’re broken, but because they’re not where the opportunity is right now.
But this is not a “chase everything” market.

Volatility is still elevated. Macro is unresolved. And with earnings season in full swing, single-stock moves are becoming more violent and less forgiving. The backdrop is constructive, but it demands discipline.
This is where the framework matters.
Not prediction. Not opinion. Structure.
Because in a market like this, the edge doesn’t come from guessing what happens next. It comes from knowing exactly where you’re wrong… and acting on it.
How Our Trade Plans Work
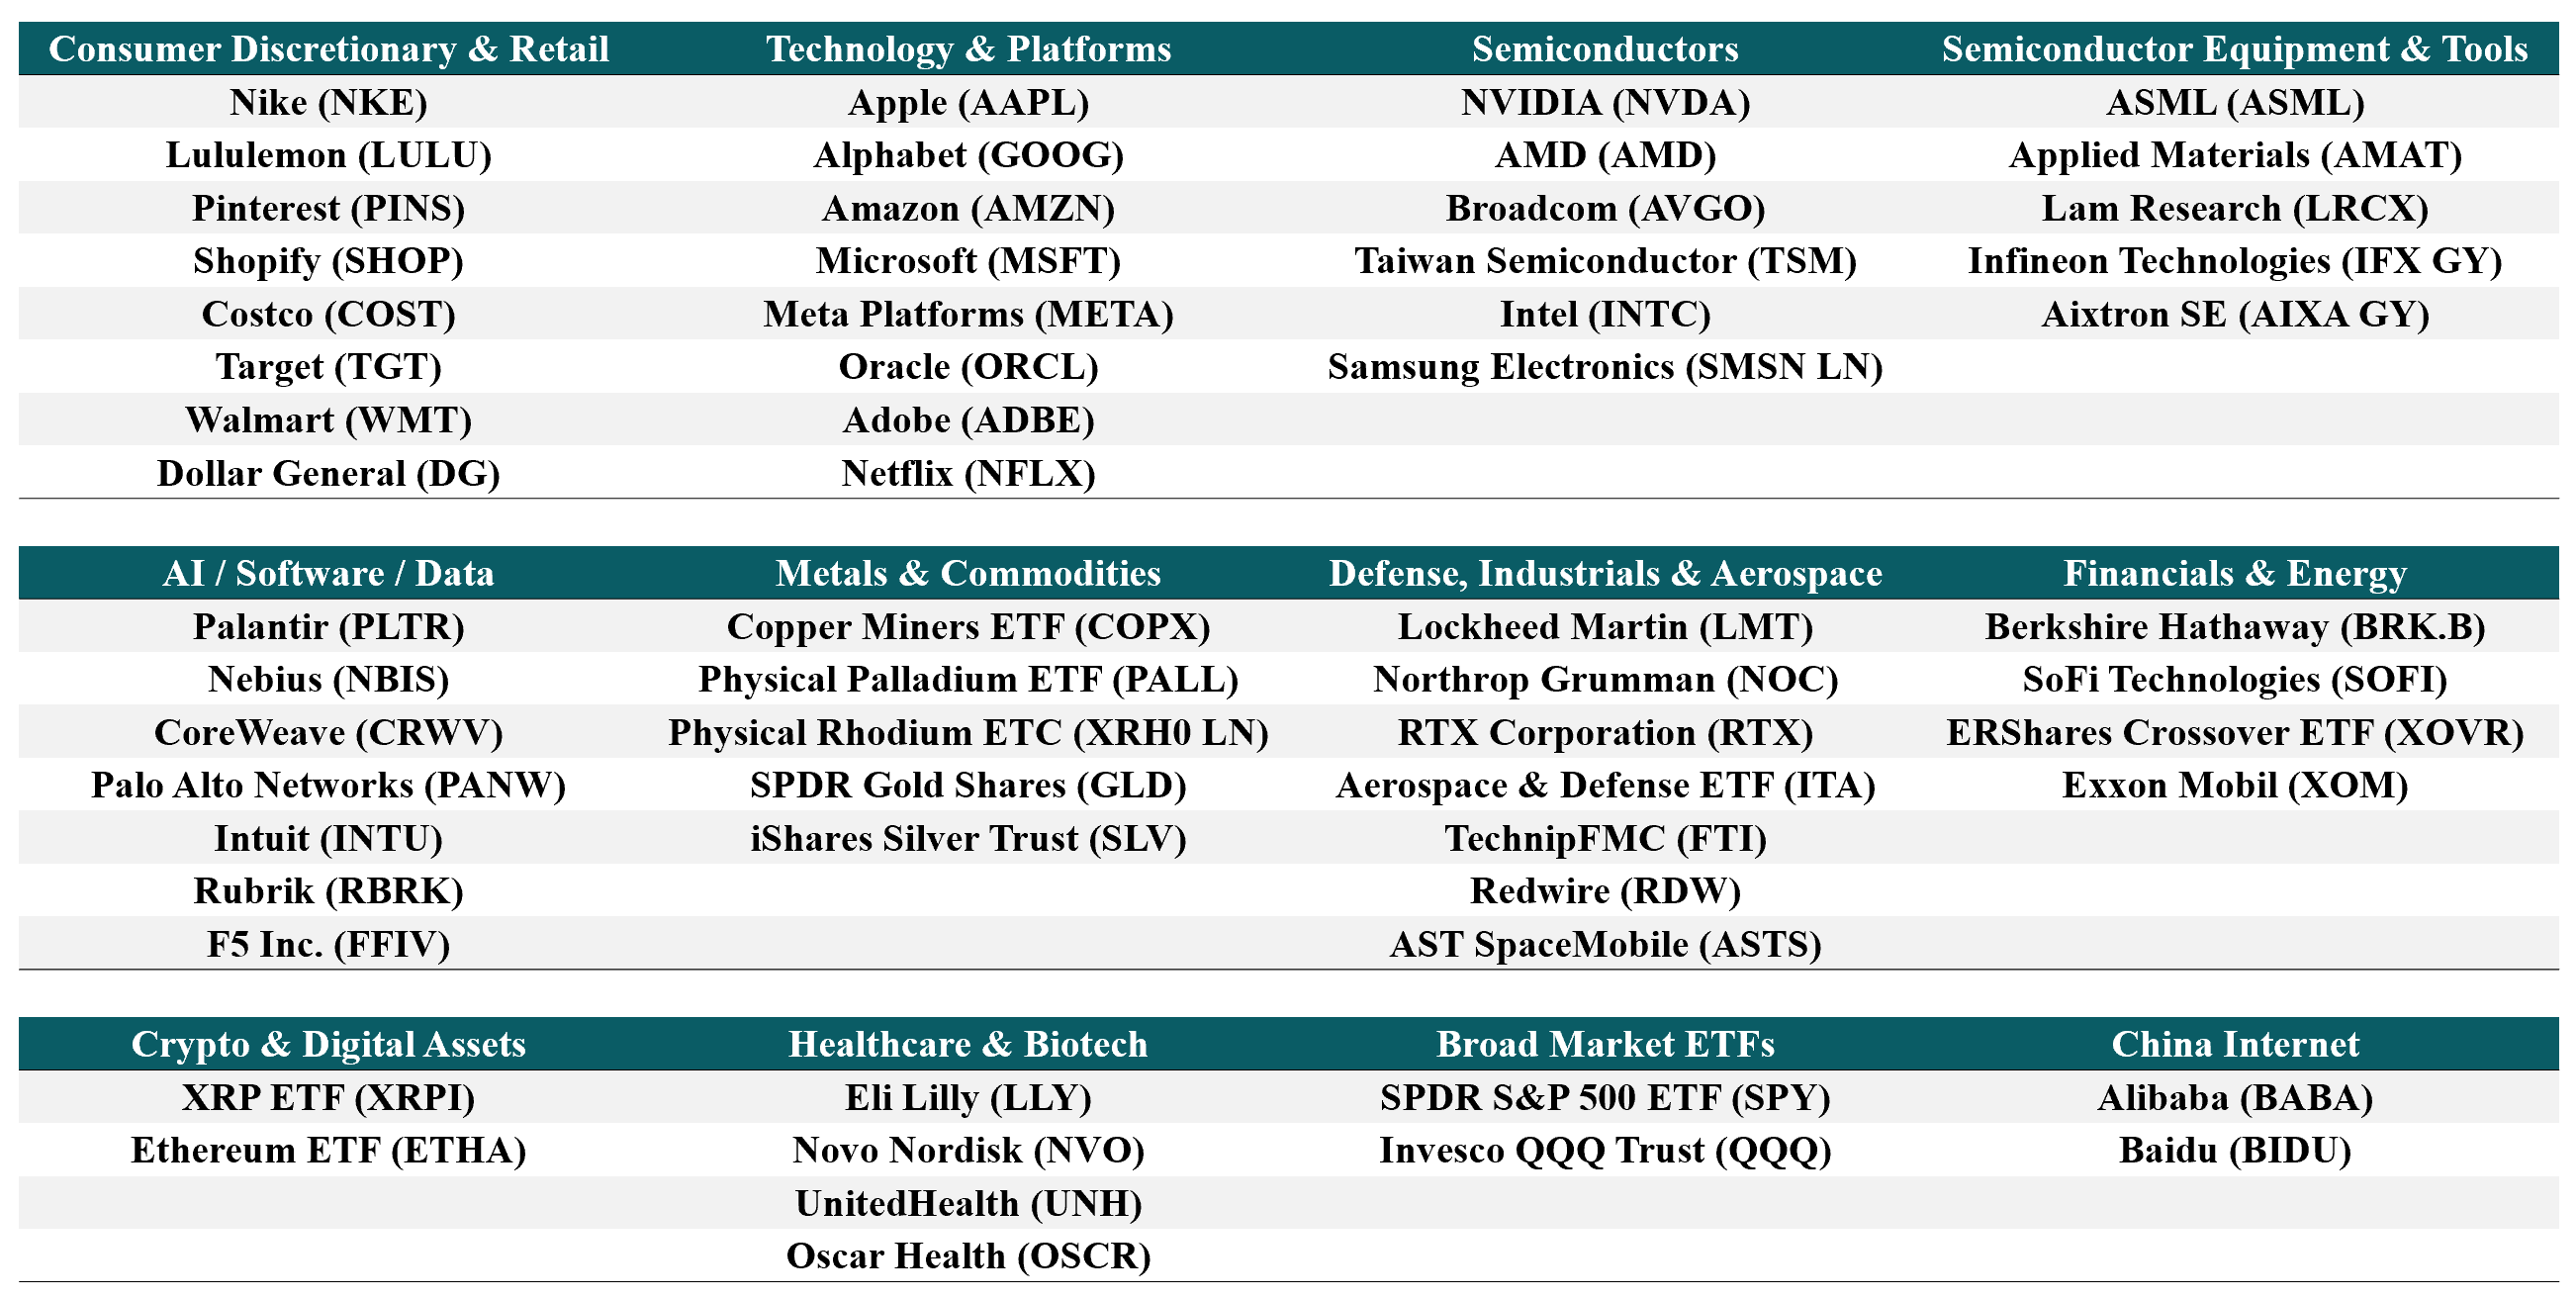
This framework is rules-based and level-driven. Every entry, hold, and exit decision flows from pre-defined structural levels, not from opinion or prediction. Regime classification, based primarily on how price relates to the four key moving averages on the daily chart, determines whether we engage, wait, or stay away entirely. Oversold conditions inside structural damage are not buy signals. Confirmation matters more than anticipation. Invalidation levels are rules, not suggestions, and when they break, exposure is reduced or removed without hesitation. Cash is treated as an active position, not a failure of conviction. This update covers the following 60 stocks and ETFs across consumer, technology, healthcare, industrials, and commodities:
What Has Been Working So Far
The framework’s discipline has continued to earn its keep. In names like ADBE and BRK.B, the regime classification kept capital away from what looked like “cheap” prices but were structurally damaged setups. ADBE’s weekly breakdown signal has been in place for months, and every short-term bounce has failed to reclaim the levels that matter. Holding cash there was correct. On the trend-hold side, AMAT, AVGO, and AMD rewarded those who stayed with the structure and did not panic during mid-week volatility. The COPX setup validated the thesis that commodity-linked names with strong weekly trend alignment would benefit from the global infrastructure and energy transition bid. GLD continued its steady structural trend, reflecting persistent institutional demand for real assets in a rate-uncertain environment. ASTS offered a lesson in the value of patience: the weekly trend-hold held, but the daily transitional signal correctly flagged that this was not a moment to add, and that caution proved warranted as price pulled back from its highs. The framework did not reward guessing. It rewarded waiting for structure to confirm.
Detailed Trade Setups
This report is a structured view of the market, not a set of predictions.
Every level, scenario, and setup is conditional on price behavior and market confirmation. Markets are dynamic, and outcomes depend on how price interacts with key levels, not on any single narrative. Use this as a framework for thinking, risk management, and preparation, not as a directive for action.
Apple Inc. (AAPL) Last close: 270.23
Setup: Apple is behaving like a large-cap quality anchor that the market is selectively bidding during a broader risk-on rotation. The stock sits above all four daily moving averages, with the EMA50 at 259.53 and EMA20 at 259.27 converged tightly, forming a structural support band that price has not threatened since its last pullback. On the weekly timeframe, the Ichimoku cloud (a Japanese trend-and-support visualization tool) confirms the bullish structure, and the 50-week average at 248.77 remains well below current price. The daily RSI (Relative Strength Index, a momentum oscillator where readings above 70 signal potential stretch) at 64.2 shows momentum without extreme overextension. The 4-hour chart shows RSI at 68.2 and MFI (money flow, a measure of buying pressure) at 55.7, suggesting buying interest is present but not yet exhausted. The daily Fibonacci 38.2% retracement level at 271.35 is the nearest overhead reference from the recent swing high, and price is pressing against it. If Apple can hold the 259 to 260 support zone on any pullback, the structure remains constructive. If price loses that cluster, the next meaningful support sits at EMA100 near 259.21, which essentially forms the same band. This is a consolidation-at-highs setup inside a confirmed uptrend.
· Current regime: Trend-Hold - all timeframes (1W, 1D, 4H) are aligned bullishly above all key moving averages, giving this the highest confidence classification available.
· Key decision zones: Support at 259.27 to 259.53 (EMA20/EMA50 cluster, daily) / 258.52 (4H Fibonacci 61.8%). Reclaim levels at 271.35 (daily Fibonacci 38.2%) / 280.90 (recent swing high).
· If not in the position: Wait for a pullback into the 259 to 261 support zone with a stabilizing daily candle before entering. Do not chase price at current levels, which are pressing against a Fibonacci resistance. Existing holders can trail risk below EMA20 at 259.27.
· Invalidation and thesis-failure rules: A daily close below 258.52 breaks the multi-EMA support cluster and shifts the read to Transitional. Below 252.12 (EMA200) the thesis fails entirely.
Adobe Inc. (ADBE) Last close: 244.45
Setup: Adobe is being treated as a structurally impaired franchise navigating the transition to AI-enabled creative tools, and the price chart reflects that uncertainty with unusual clarity. On the weekly timeframe, ADBE sits below all four moving averages, the nearest being the EMA20 at 277.35, more than 13% above current price. That is the definition of a weekly breakdown, meaning the longer-term trend damage is significant and not quickly repaired. The weekly MFI (money flow, a measure of buying pressure) at 16.8 is deeply suppressed, consistent with institutional distribution rather than accumulation. The one constructive development is on the daily chart: price has pushed above EMA20 at 243.42 and is pressing against EMA50 at 257.98, while the daily MACD (trend momentum indicator) is expanding bullishly. Put simply, there is a short-term recovery attempt underway inside a larger downtrend. The 4-hour MACD is fading, suggesting that near-term momentum is losing conviction precisely as price approaches the harder resistance levels above. If price can hold the daily EMA20 at 243.42 and push through EMA50 at 257.98 on volume, a more meaningful repair phase could begin. If not, this bounce fades and the weekly structure reasserts its dominance. This is a bounce inside damage, not a trend reversal.
· Current regime: 1D Repair / 1W Breakdown - short-term price action is recovering, but the longer-term structure remains deeply impaired. Repair trades carry higher failure risk.
· Key decision zones: Support at 243.42 (daily EMA20) / 239.32 (daily Ichimoku Tenkan). Reclaim levels at 257.98 (daily EMA50, first meaningful resistance) / 277.35 (weekly EMA20, structural recovery threshold).
· If not in the position: Do not engage until price reclaims and holds the daily EMA50 at 257.98 on a closing basis. The weekly structure makes this a low-probability setup for new long exposure. Patience here is not missed opportunity, it is capital preservation.
· Invalidation and thesis-failure rules: A daily close below 239.32 (Ichimoku Tenkan) puts the repair thesis at risk. A close below 224.13 (multi-timeframe swing low) confirms full breakdown continuation.
Aixtron SE (AIXA.DE) Last close: 44.27
Setup: Aixtron SE, a German manufacturer of compound semiconductor deposition equipment, is one of the cleanest trend-hold setups in the European semiconductor space right now, and it is benefiting from the same structural tailwinds driving the broader semiconductor equipment complex. The daily chart shows price above all four moving averages by a substantial margin, with EMA20 at 36.35 and EMA50 at 31.44 well below, indicating that the trend has been building momentum for an extended period rather than being a recent spike. RSI at 70.7 sits at the upper boundary of neutral-to-overbought territory, and the daily MACD (trend momentum indicator) is in bullish expansion mode. The MFI (money flow, a measure of buying pressure) at 53.4 is moderate, which is actually constructive: it suggests this move is not yet driven by speculative excess. That matters because sustained trends typically carry moderate, steady money flow rather than the extreme readings that precede reversals. Note that AIXA.DE does not have a 4-hour timeframe available, so this assessment is based on the daily and weekly data only. The Fibonacci structure from the longer-term swing shows 38.2% support well below at 32.70, confirming the trend has significant cushion before any structural test. If price stays above EMA20 at 36.35, the uptrend is intact. This is a strong-trend, elevated-RSI setup requiring careful entry management.
· Current regime: Trend-Hold (1D only, no 4H available) - price is comfortably above all four daily moving averages with expanding MACD. Weekly confirmation required from broader semiconductor equipment group.
· Key decision zones: Support at 36.35 (daily EMA20) / 31.44 (daily EMA50). Reclaim levels: price is currently in trend-hold, so the focus is on holding 36.35 rather than reclaiming anything.
· If not in the position: RSI at 70.7 argues against chasing here. Wait for a pullback toward EMA20 at 36.35 before initiating. Any retracement that holds above 36.35 on a daily close is the entry signal. Existing holders can trail risk below EMA20.
· Invalidation and thesis-failure rules: A daily close below EMA20 at 36.35 shifts the regime to Transitional and warrants reducing exposure. A close below EMA50 at 31.44 ends the thesis entirely.
Applied Materials, Inc. (AMAT) Last close: 396.94
Setup: Applied Materials is behaving like a sector bellwether for semiconductor capital equipment, and the weekly chart’s ADX (Average Directional Index, a measure of trend strength) at 34.3 confirms this is a genuinely trending stock, not one moving on noise. All three timeframes, weekly, daily, and 4-hour, are classified as Trend-Hold, which is the highest multi-timeframe alignment available. That matters because when all three timeframes agree on regime, the probability of a sustained move is meaningfully higher than when signals are mixed. The weekly RSI at 71.3 shows momentum extending into overbought territory, while the daily MACD is fading at 3.337, a signal that the most recent push is losing short-term acceleration even while the broader trend remains intact. The 4-hour MACD has turned to bearish stabilization, suggesting a minor consolidation or digestion phase is developing. The daily EMA20 at 374.41 and EMA50 at 354.45 form the two primary support reference levels for any pullback. The recent swing high near 407.29 is the overhead target, and price at 396.94 is approaching it. If AMAT can consolidate above EMA20 and not give back the EMA50, the structure remains fully constructive for a continuation to all-time highs. This is a high-conviction trend continuation setup in the leading semiconductor equipment name.
· Current regime: Trend-Hold - 1W, 1D, and 4H all in alignment above all key moving averages. Highest confidence classification.
