
TSM Hit Every Target. Is the Next Expansion Phase in Play?
Targets hit. Now TSM faces its next defining move.

In our previous post on TSMC, we laid out a clean plan for TSM 0.00%↑. Defined pullback zones. Clear breakout trigger. Layered targets. Strict invalidation.
The market respected every level.
Pullback entries held. Momentum expanded. Targets at 345, 352, and 362 were reached in sequence. The move was not luck. It was structure meeting demand.
Now the question shifts.
Not “Did we get it right?”
But “What changes here?”
TSM is no longer emerging from consolidation. It is extended, trending, and attracting attention. That changes positioning risk and opportunity simultaneously.
Let’s reset the framework calmly.
Key Takeaways
The primary trend remains firmly bullish above 313.
Short-term momentum is elevated but not broken.
Demand drivers remain structurally intact, especially AI and advanced nodes.
The next 10% move will likely require consolidation first.
327 to 336 is the structural invalidation zone for medium-term bulls.
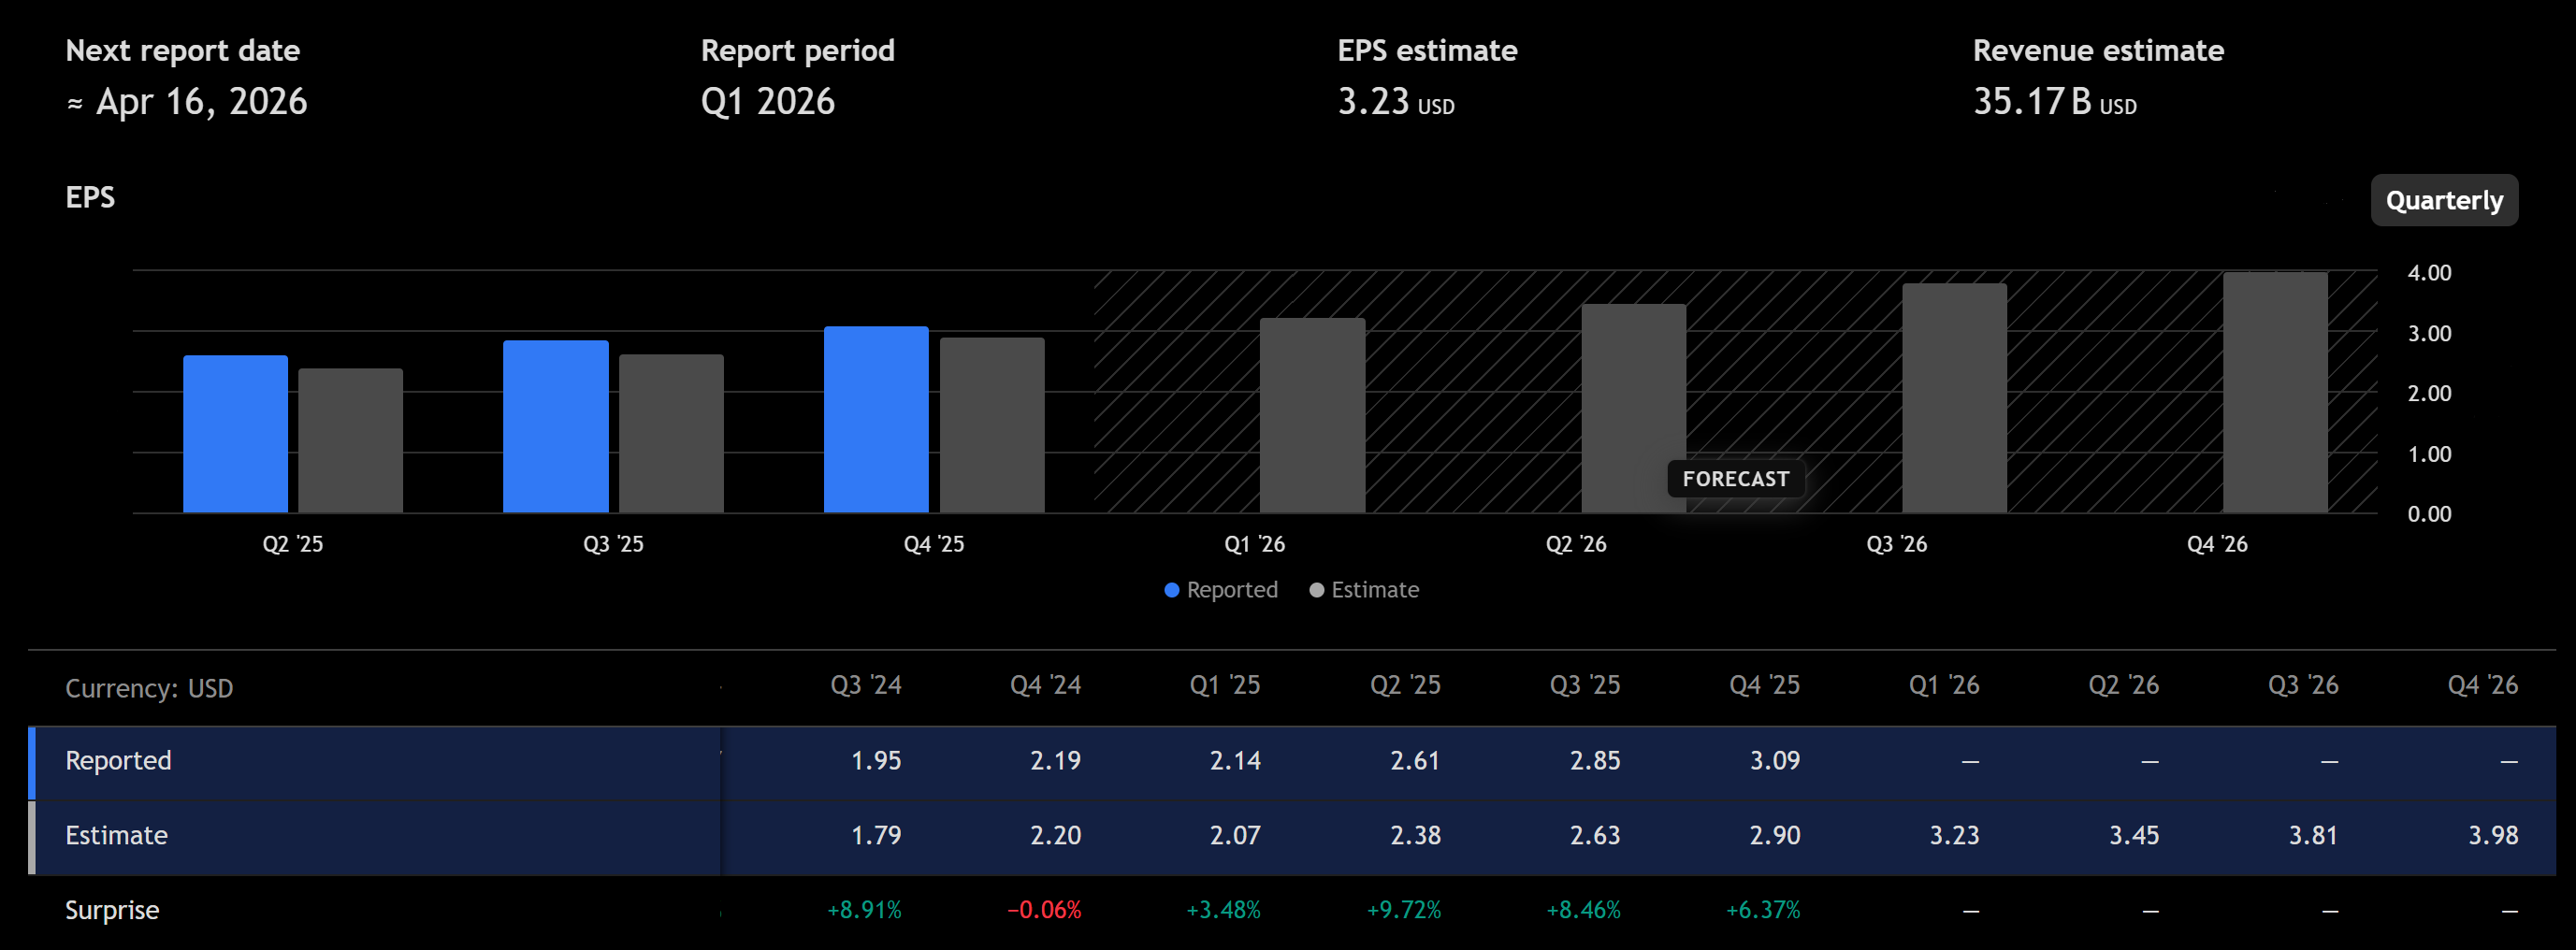
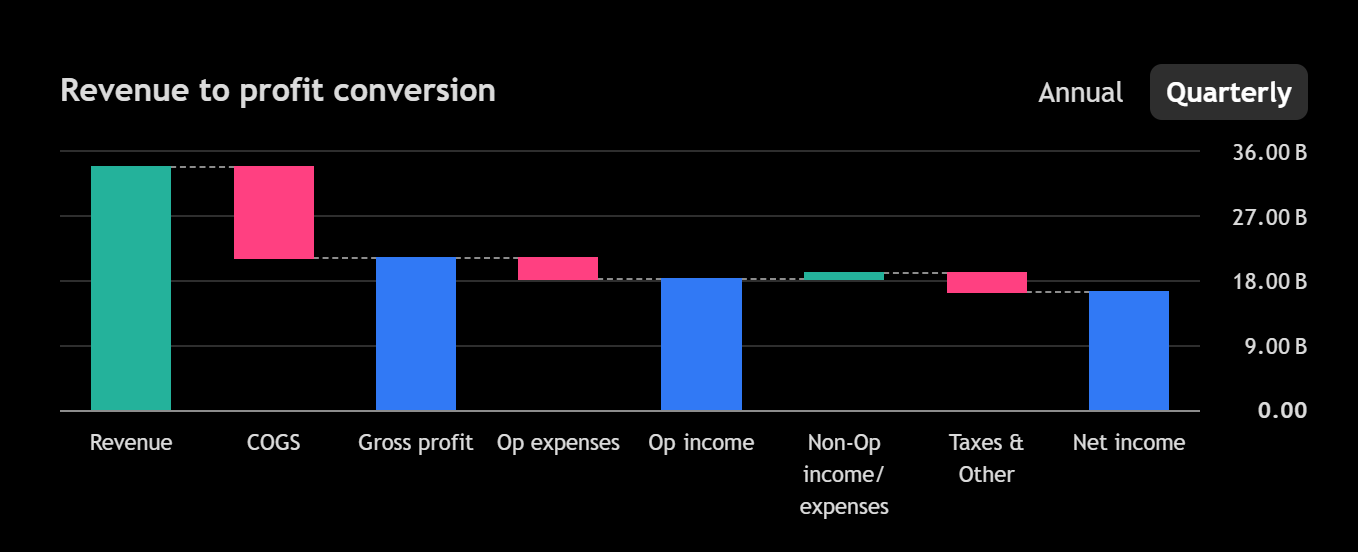
Pipeline, Backlog, Business, Latest Earnings
TSM is not a typical cyclical semiconductor name. It is the manufacturing backbone of the AI and high-performance compute ecosystem.
Revenue concentration matters.
Advanced nodes below 7nm now account for roughly 65% of wafer revenue. 3nm alone continues to ramp, and 5nm remains fully utilized. That mix shift is critical because advanced nodes carry materially higher margins.
High performance computing represents over 40% of total revenue. That segment is growing at a double-digit pace, driven by AI accelerators, GPUs, and custom silicon. Smartphones remain meaningful but no longer define the cycle.
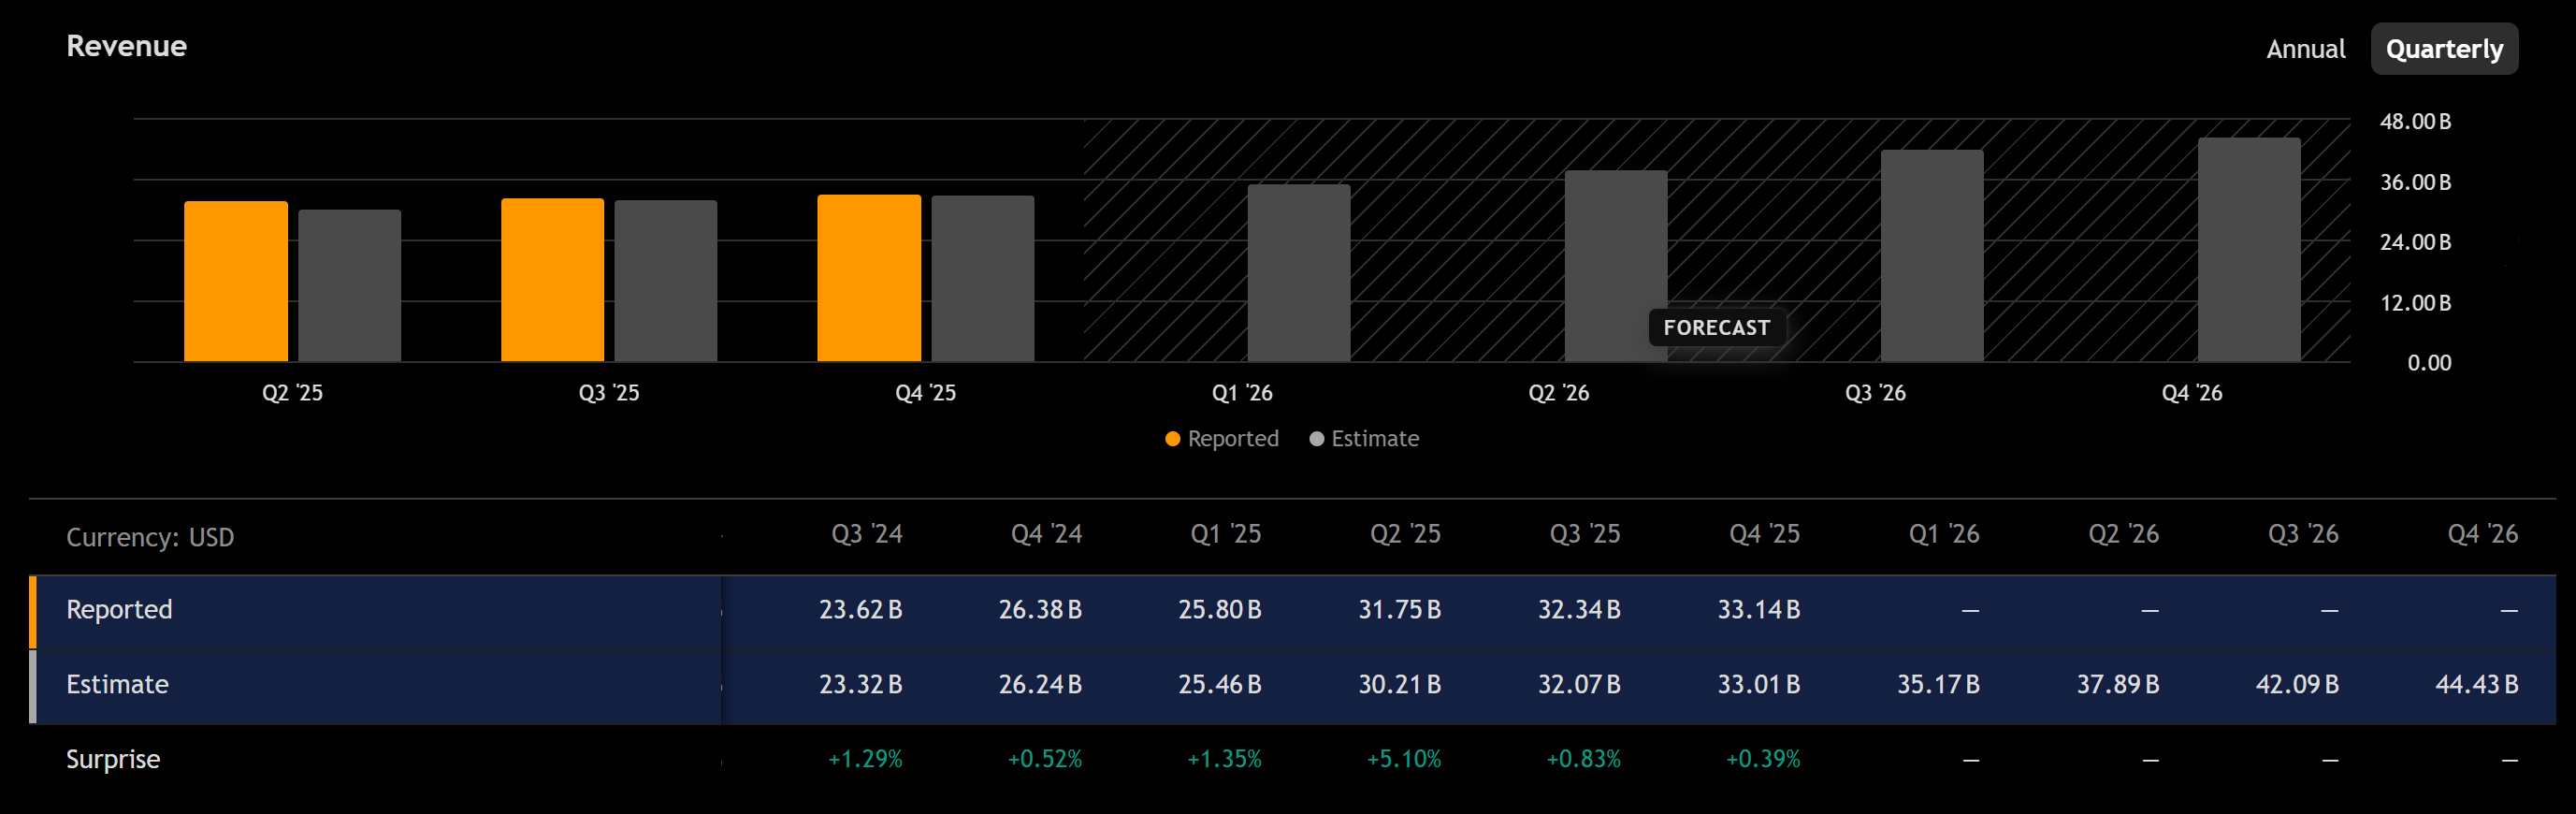
Capacity utilization has normalized after 2023 softness. Management guided to continued strength in AI-related demand with 2026 revenue growth expected in the low to mid-teens.
Capital expenditures remain elevated, in the 30B to 35B range annually, reinforcing technological leadership but compressing free cash flow near term.
The key change from the latest earnings was not just revenue growth. It was mix.
Higher 3nm contribution improved gross margin resilience despite elevated depreciation from new fabs.
That tells you something important.
Demand is not broad and fragile. It is concentrated and high quality.
Fundamental Analysis
TSM is currently operating at roughly:
Gross margin near 53%
Operating margin near 42%
Net margin above 35%
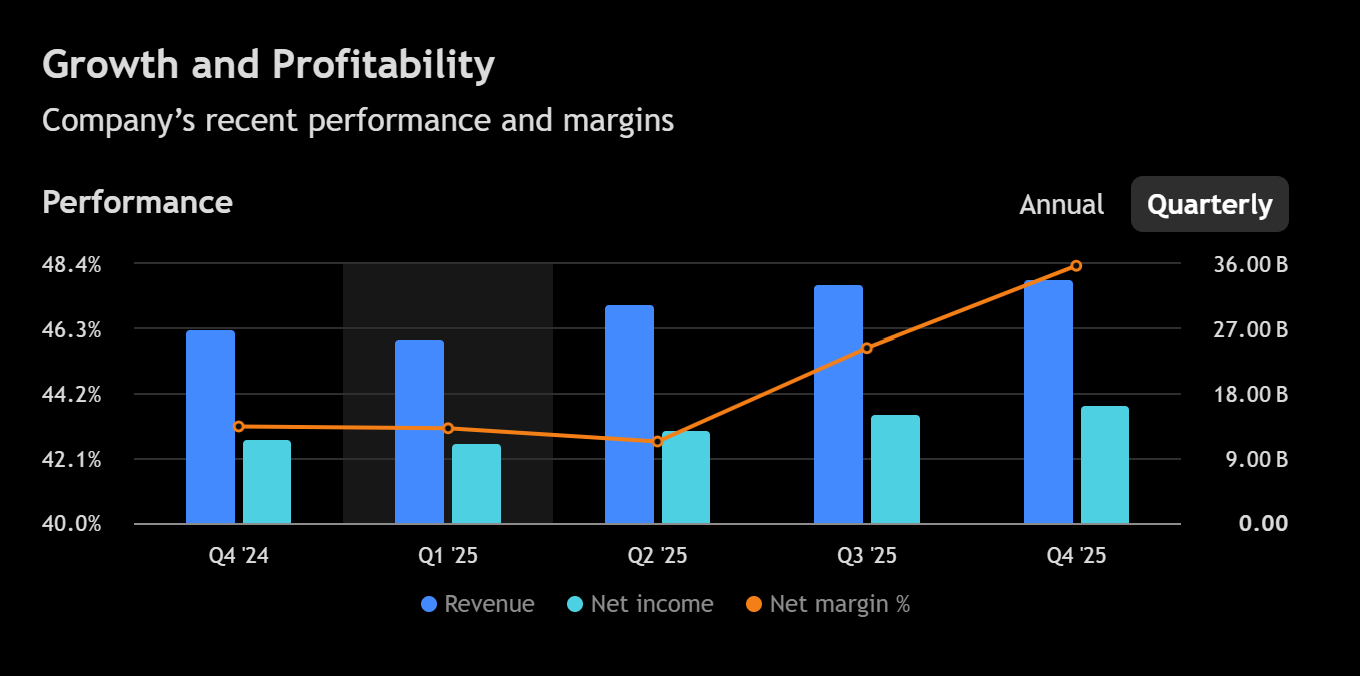

These are elite numbers for manufacturing. They reflect pricing power, scale, and technological moat.
Revenue growth is re-accelerating after a cyclical trough. Year-over-year growth has turned positive and is trending toward low double digits. If AI demand sustains, that trajectory could expand further.
Balance sheet strength remains a stabilizer:
Net debt remains modest relative to operating income.
Cash generation supports dividend stability and capital reinvestment.
Return on equity remains north of 30%.
Valuation is no longer cheap, but it is not speculative. Forward P/E sits in the mid 20s. For a company compounding earnings at 15% to 20% with dominant market share in leading-edge manufacturing, that multiple is defensible.
The key insight here is margin durability.
If gross margins hold above 50% during heavy capex cycles, earnings power in a mature expansion phase becomes meaningfully higher than prior cycles.
Fundamentally, the business is stronger than the price move alone suggests.
The earnings reset expectations higher. The moat is widening, not shrinking. Risk is cyclical volatility, not structural erosion.
Technical Analysis
Now we shift from business strength to price behavior.
Trend structure across weekly, daily, and intermediate timeframes remains intact. Higher highs and higher lows define the move.
The recent flush candle into the low 320s was a volatility event, not structural damage. It swept liquidity, then reclaimed support. That behavior often strengthens the base rather than weakens it.
Key structural levels:
366 is the recent pivot high and momentum trigger.
380 to 385 is the next major resistance cluster derived from prior impulse projections.
395 is the next extension threshold if momentum accelerates.
Support levels are layered, not singular:
353 to 356 represents short-term trend support.
343 to 346 aligns with the daily mean and rising trend structure.
336 to 327 represents deeper corrective support and medium-term invalidation zone.
313 is longer-term trend support tied to weekly structure.
Momentum profile:
Short term: Cooling but constructive.
Medium term: Bullish continuation pattern intact.
Long term: Strong trend with elevated but not exhausted conditions.
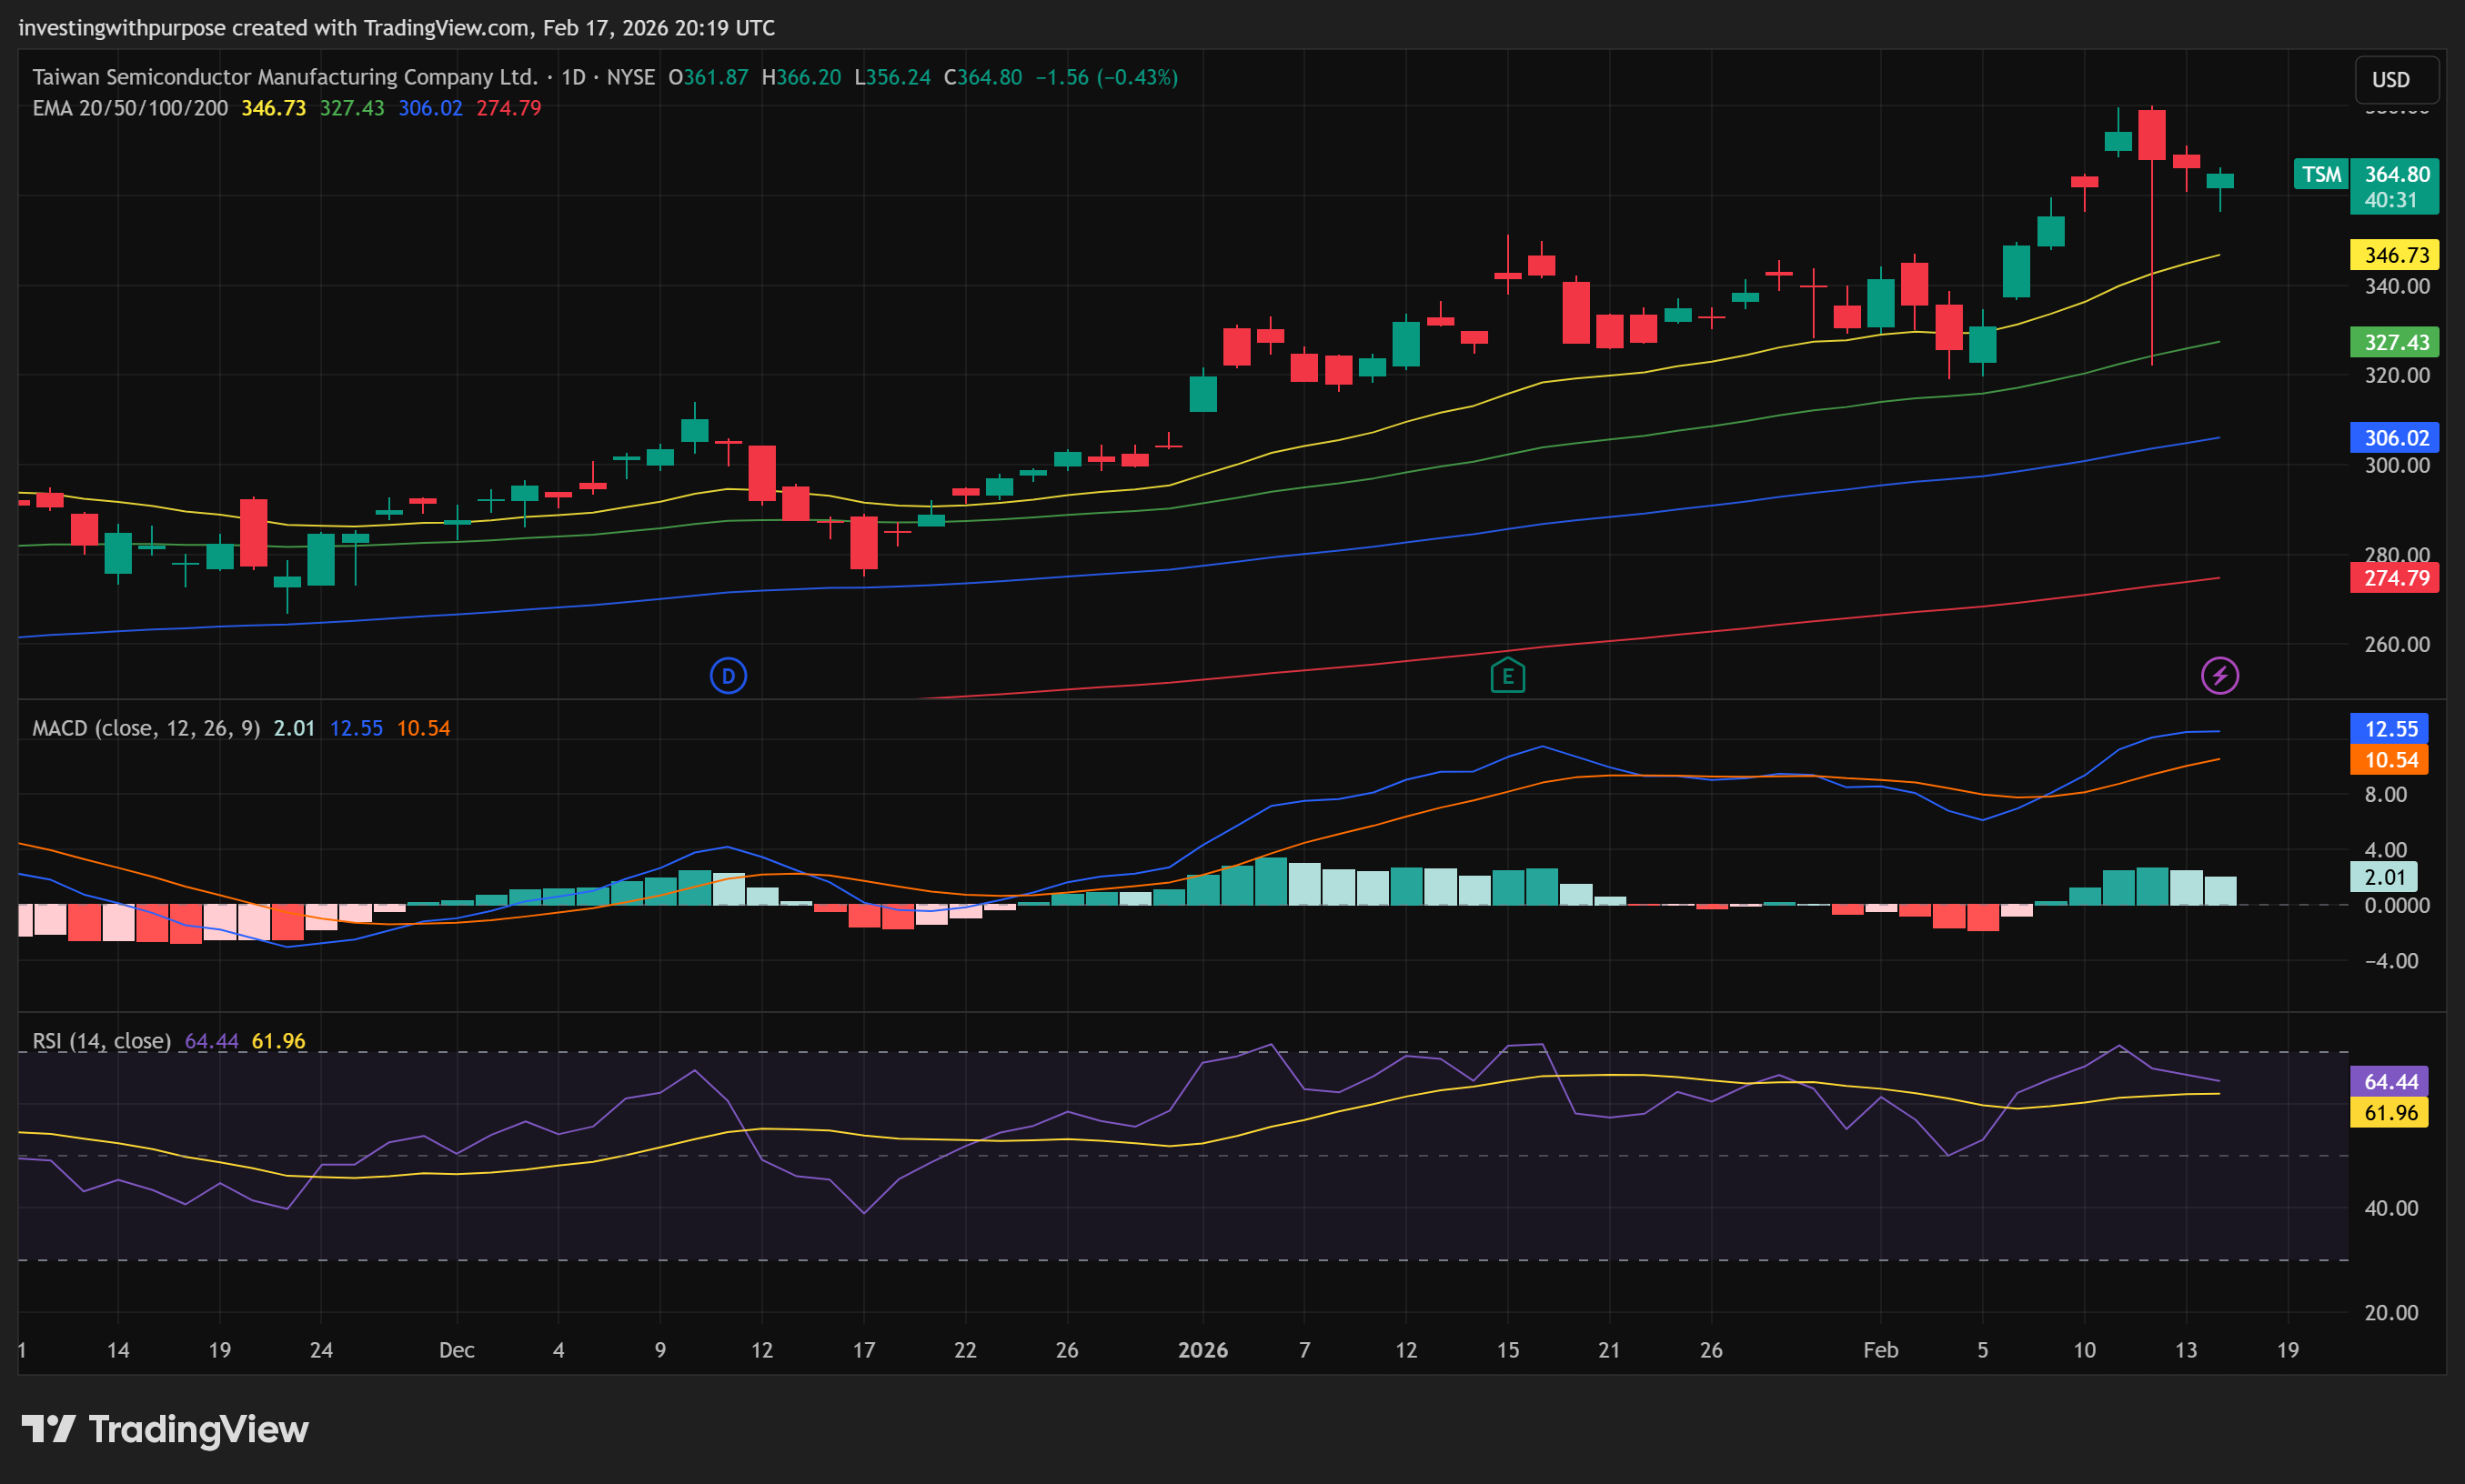
Importantly, price remains above its rising medium and long-term averages. That alignment is what defines institutional accumulation, not retail momentum.
Trend is intact. Risk has shifted from downside failure to upside digestion. The next move likely requires time or shallow pullback before continuation.
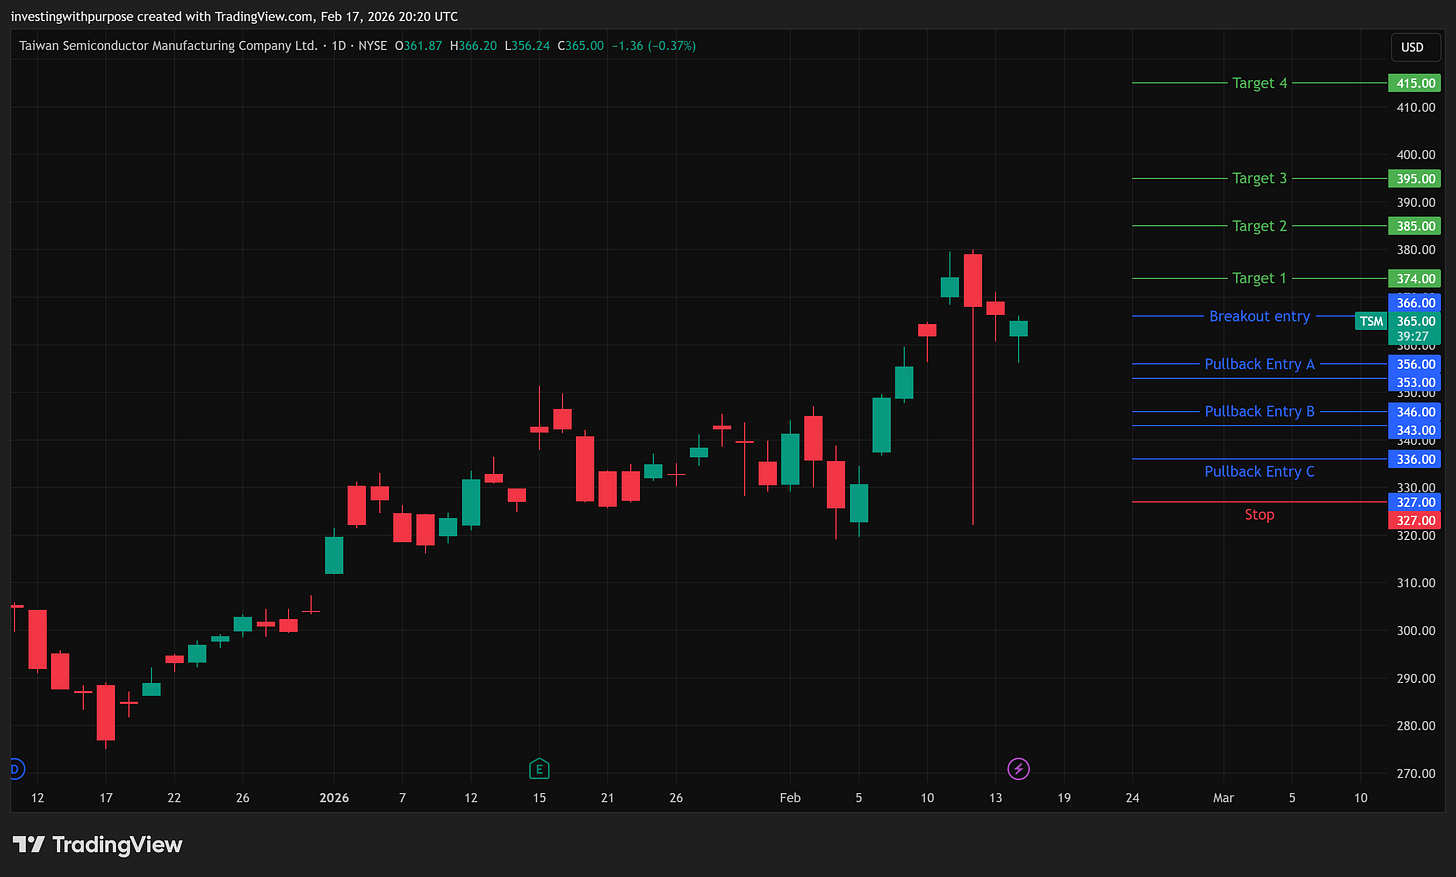
Our Trade Plan
Pullback entries
353 to 356 if structure stabilizes. This is where short-term trend support sits.
343 to 346 if a deeper reset occurs. This aligns with daily mean reversion.
336 to 327 only if volatility expands. This is the final structural defense for medium-term bulls.
Breakout entry
Above 366 on strong acceptance. That confirms momentum continuation.
Above 380 confirms expansion into a new impulse phase.
True invalidation
Sustained trade below 327 shifts structure from higher lows to potential trend change.
A break below 313 invalidates the broader bullish thesis.
Targets
374 to 380 near term resistance.
385 as short-term extension objective.
395 to 406 medium term projection zone.
416 longer-term expansion if AI demand accelerates earnings further.

Rolling stop logic
Stops should trail below the most recent higher low.
If entering near 353, stop logic belongs under 336.
If entering near 336, stop belongs under 327.
As price makes new highs, move stops under prior consolidation floors.
Position sizing framework
Size inversely to stop distance.
Wider stop near 327 requires smaller size.
Tighter stop near 353 allows larger size.
Risk per trade should remain constant as % of portfolio regardless of entry level.
This is how professionals manage volatility without guessing.
Bottom Line
TSM remains structurally strong.
The prior plan worked because it respected trend and invalidation. The same discipline applies now.
At current levels near 365, the stock is actionable only on controlled pullbacks or confirmed breakouts. Chasing strength without structure is not optimal.
Risk is defined below 327. Reward expands above 380.
If 327 holds, the medium-term bull case remains intact.
If 313 breaks, the thesis changes materially.
Process first. Always.
This article is for informational and educational purposes only and does not constitute investment advice. Markets involve risk, including the potential loss of capital.