


TSMC grew Q2 revenue 36% with record margins, lifted its 2026 outlook to more than 40% dollar growth, and guided Q3 higher again. The ADR fell about 4% anyway, because the same update raised capex 15% and quantified the margin cost of building fabs overseas.
When perfect numbers meet a higher bill, the bill wins the morning.
TSMC didn’t sell off because demand weakened. The July 16, 2026 report raised expected 2026 revenue growth to slightly above 40% in dollar terms, from more than 30% before, delivered record margins, and guided Q3 to another sequential increase. The stock fell because the same update paired that growth with a larger capital program, another major US commitment, and a more visible margin cost of expanding outside Taiwan.
That makes this a valuation and return-on-capital debate, not a broken-demand story, and the 2 sides of it are the whole article. Prices below are based on the July 15, 2026 close of $419.48; the ADR trades near $402 in the premarket as I write, down about 4%. 3 numbers frame the rest: the 396 to 408 zone the gap is landing in, the 376 level that would invalidate the setup, and roughly 30x, the trailing multiple including the new quarter.
Key Takeaways
The print: revenue of $40.20B (NT$1.27 trillion) hit the top of guidance, up 36% in NT$ terms and 33.7% in US dollars. Gross margin of 67.7% and operating margin of 60.3% both exceeded guidance.
The raise that matters: management now expects 2026 dollar revenue growth slightly above 40%, up from more than 30%. Q3 guidance of $44.6B to $45.8B implies 11% to 14% sequential growth.
The asterisk: net income of NT$706.56B rose 77%, flattered by NT$95.8B of non-operating items including a NT$63.2B gain tied to Vanguard International shares. Operating income, up 65.4%, is the cleaner read.
The bill: 2026 capex moved to $60B to $64B, about 15% higher at the midpoint, plus a separate multi-year $100B US commitment. Overseas fabs are guided to dilute gross margin 2% to 3% early, 3% to 4% later.
The map: the gap lands in the 396 to 408 support cluster. A close below 396 suspends new entries, 376 invalidates the setup, and repair begins above 440.
What Changed
The quarter needs little defense. Revenue reached the top of the company’s own guidance at $40.20B, gross margin printed 67.7% against a 65.5% to 67.5% guide, and operating margin came in at 60.3%, well above the guided range. Net income rose 77% to NT$706.56B, though that headline deserves its asterisk: non-operating items contributed NT$95.8B, more than triple the prior quarter, including a NT$63.2B disposal and revaluation gain on Vanguard International shares. Operating income, up 65.4% from a year ago, is the number that describes the business. Demand commentary centered on AI accelerators, with management noting CPUs are becoming a second engine of data-center silicon alongside them.
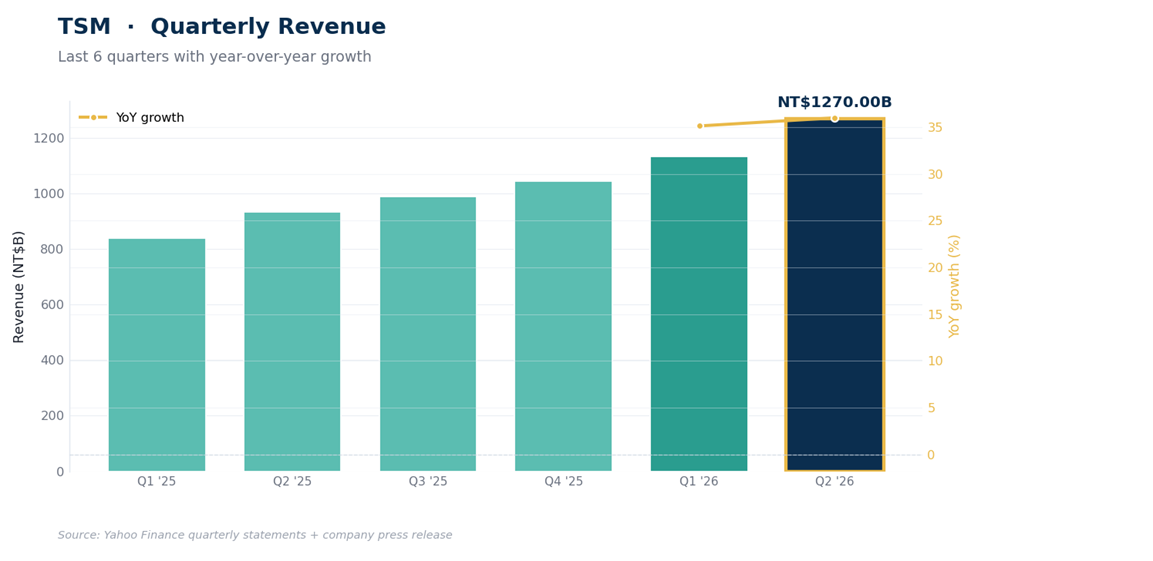
The guidance is the bigger event, on both sides of the ledger. The bullish side: full-year 2026 revenue growth is now seen slightly above 40% in dollar terms, a large upward revision from the prior “more than 30%,” and Q3’s $44.6B to $45.8B range implies another 11% to 14% of sequential growth at a 65% to 67% gross margin. The costly side: 2026 capex guidance moved from $52B to $56B up to $60B to $64B, roughly 15% higher at the midpoint, and a further $100B of US investment was announced, a multi-year commitment whose timing depends partly on market conditions rather than money spent this year.
Management repeated its arithmetic on what expansion costs: overseas fabs dilute gross margin 2% to 3% in their early stages, widening to 3% to 4% later. Add a tape that had sprinted 10% in 2 sessions into its June 30 record and a chip sector selling off around the report, and the likeliest reading is that the market repriced the cost and returns of growth, not the growth itself. That’s a smaller problem than a demand miss, but it isn’t nothing: at these margins, every point of dilution is real money.
One nuance keeps the selloff honest. A 67.7% gross margin is itself the evidence that past spending earned its keep; the dilution guide says a larger share of future capacity may carry lower early-stage margins as the overseas facilities ramp. The bet hasn’t changed. Its unit economics have, modestly, and at a $2T valuation “modestly” moves billions.
The Fundamentals and the Price
Housekeeping: TSMC reports in New Taiwan dollars while the ADR trades in US dollars, so statement figures are NT$ and price levels are ADR dollars. Over the 12 months through March, before this print, TSMC produced NT$4.10T of revenue at a 61.9% gross margin and a 46.5% net margin, converted NT$2.35T of operating cash flow into NT$1.05T of free cash flow while funding the capex wave, and earned a 36.7% return on equity with debt to equity of 0.19.
TSMC has never run margins like these at this scale, and the dashboard below reflects the window before this report improved them.
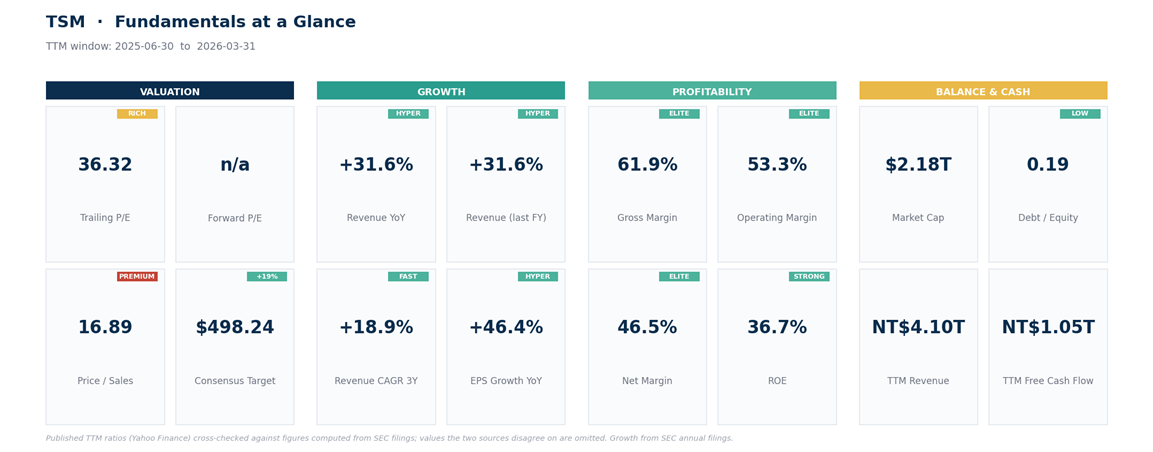
Fold in the new quarter and the multiple compresses, with one adjustment worth making. On reported earnings, trailing net income becomes about NT$2.22T, roughly $13.5 of EPS per ADR at the quarter’s NT$31.6 exchange rate, so the $402 premarket price is near 30x trailing earnings. Strip the one-time Vanguard gain and core trailing EPS is closer to $13.1, call it 31x.
Either way the direction matters more than the decimal: run it a step forward, labeled as the rough scenario it is, and if Q3 lands mid-guide at margins near the guided range, trailing earnings approach $15 per ADR by October and today’s price is paying about 27x. For a business now guiding to 40% dollar growth at record margins, that’s a full price but not a euphoric one. The Street’s mean target of $498 (set before the report, 19% above the July 15 close) will get revisited in both directions: higher revenue, but a fatter cost line.
The Risk Ledger
The risks are specific, so name them separately. Geography first: most leading-edge capacity sits on Taiwan, and that risk arrives by headline, on no schedule, which is part of why this stock has long traded below the multiple its numbers would justify elsewhere. Margins second: the overseas dilution is now quantified, and the enlarged capex plan deepens the depreciation wave that follows every spending cycle. Concentration third: a handful of AI customers drive the marginal wafer, and their plans can shift faster than a fab gets built. Cycle fourth: foundry demand has always been cyclical, and 36% growth invites the question of what the comparison quarter looks like in 2027. None of these is new. All of them got a little heavier this week.
The Technical Map
Trend: ADX near 40 on the weekly timeframe, a gauge of trend strength only, confirms the prevailing trend is powerful; direction comes from the price structure and buying-versus-selling pressure, and both still point up. The ADR is up about 80% from its 52-week low of $223.70.
Structure: the June 29 to 30 sprint added 10% in 2 sessions to the $479.00 record, and the 10 sessions since gave back 12% to the July 15 close. So far that’s a pullback digesting a vertical move rather than a broken trend.
Support: the premarket price is landing in it. The 396 to 408 band stacks the 100-day average ($397), the halfway retracement of the March-to-June rally ($396), the 20-week average ($399), round-number 400, and the lower volatility band ($408).
Momentum: the daily fast stochastic reads 0, extremely oversold on this setting, though oversold can persist when downside momentum is strong. Daily RSI, a 0-to-100 momentum gauge, sat at 45 before the gap; weekly RSI at 61 is elevated but short of prior extremes.
Resistance: the July 15 close and the 50-day average make 416 to 422 the first overhead test, then 434 to 442 (the 20-day average and the July shelf), then the 455 to 479 supply from the record week.
Failure: a daily close below 376 takes out the 61.8% retracement of the spring rally and turns a routine pullback into a trend question. Below that, the April base near 364 is the last shelf of the run.
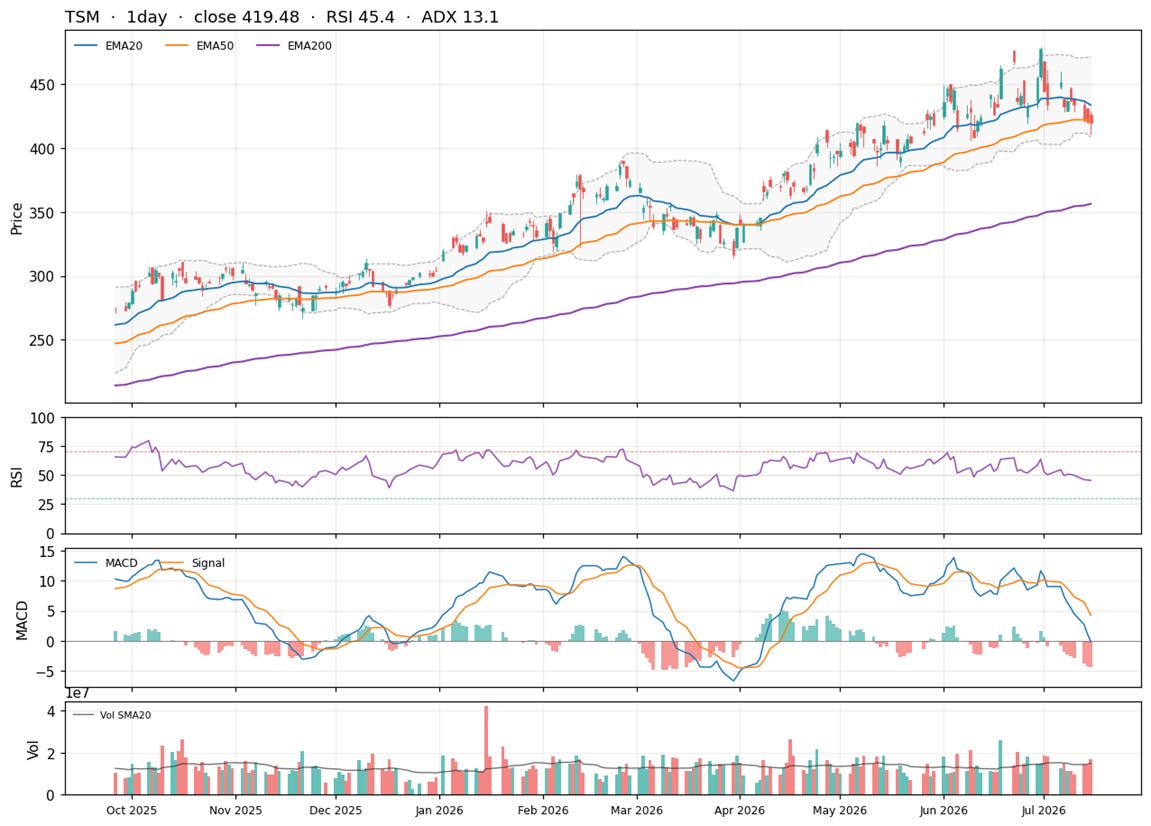
Net read: a record quarter is gapping the stock into the thickest support cluster in its structure, inside a weekly uptrend that hasn’t broken, on a complaint about the cost of growth rather than the existence of demand. Even justified gaps digest for a few sessions.
One possible framework, not a promise.
The Trade Plan
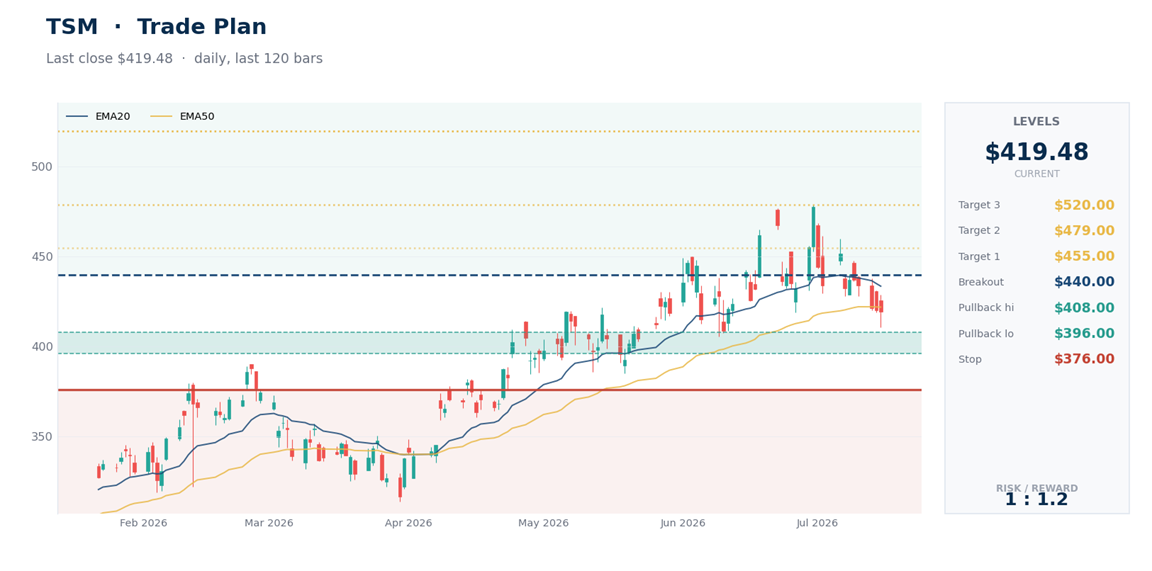
Thesis zone (illustrative): 396 to 408. The gap is opening inside this cluster; a hold here is the highest-information entry available. Between the zone and 440 is chop the framework has no opinion on.
Repair trigger: a daily close above 440 reclaims the 20-day average and the July shelf, the first evidence the spending complaint has been absorbed. 455 to 479 is the proving ground after it.
Below 396: no new entries, and the probability of a test of 376 rises. This is a suspension rule, and it stays suspended until the zone is reclaimed on a daily close.
Structural failure: a daily close below 376. The 61.8% retracement is gone, the pullback has become a downtrend question, and the framework above stops applying.
Objectives on repair, in order: 455 (the record week’s supply), then the 479 record. The 520 extension objective is only in play once 479 is reclaimed.
Catalysts: TSMC publishes revenue monthly, so evidence arrives every few weeks, and the next full report lands in mid-October 2026.
On sizing, an illustrative example rather than advice: a $402 reference entry against the $376 failure level risks about 6.5%. A reader budgeting 0.5% of a portfolio to that risk would arrive at a position near 7.5%; a 1% budget implies about 15%. One honesty note belongs here: 6.5% is a closing-price framework, not a guaranteed maximum loss, because this name can gap through levels on headlines. The average daily range is about 4.5%. Let the level come to you.
Bottom Line
TSMC raised both sides of the equation: expected 2026 growth moved above 40% while the cost of delivering it, capex now and margin dilution later, rose alongside. The selloff is the market charging for the second half of that sentence, and it’s a rational charge, not a verdict on demand. What would vindicate the bearish reading sits in next year’s numbers: overseas dilution running hotter than guided, or AI customers pausing while a $60B-plus capex year turns into depreciation.
Until then, this looks like a routine repricing inside a strong trend, delivered at prices sitting on the thickest support of the run. The zone is 396 to 408, the line that changes the story is 376, and a close above 440 says the argument is over. Monthly revenue prints referee from here.
This is research and commentary, not personal investment advice. Levels and trade plans are illustrative; size positions to your own risk tolerance and time horizon. The author may hold positions in names discussed.
Two things stand out. The 77% net income jump is flattered by a one-time NT$63 billion gain on Vanguard shares and the operating income, the cleaner number, rose 65% (still elite, but that’s the real growth rate). And overseas expansion now comes with a quantified cost, 2-3% margin dilution early, widening to 3-4% later, on top of a 15% capex raise. So the market isn’t questioning whether AI demand is real, it’s pricing in what it actually costs TSMC to capture it outside Taiwan. That’s a different, more useful debate than “AI slowdown or not.