


This week’s read: the index numbers look mild and the single session that produced them did not. Only 7 of our 59 names offer an entry that pays at least one to one against its own stop, so the bar for new money is higher than the headline suggests.
Friday did the damage. The S&P 500 fell 1.77% and the Nasdaq-100 3.47% in that one session, and 45 of our 59 names closed lower. 27 of the 59 are now classed Breakdown, up from 24. What has changed is the price of starting something new; positions you already hold are governed by their own stops below.
Every Sunday we sort those 59 stocks and ETFs into four trend regimes and publish three prices for each: where the name may be bought, where to take something off, and where we step aside. They are fixed before Monday opens, because a price set in advance beats a decision made while a position is already moving.
Market Conditions
The broad tape softened this week. The S&P 500 (SPY) closed at 755.72, Repair and roughly flat on the week, while the Nasdaq-100 (QQQ) at 690.49 is Repair and down 2.0% on the week. Almost all of it came on the Friday: SPY fell 1.77% and QQQ 3.47% in that session, 45 of our 59 names closed lower, median -2.8%, and every level below is set from that close. Those regimes are the daily ones; the weekly has not followed, with SPY still Trend-Hold on the weekly and QQQ still Transitional on the weekly. That is where price sits against its weekly averages, not a prediction that the trend holds.
Beneath the surface, regime breadth deteriorated: Breakdowns rose from 24 to 27, Repairs rose from 8 to 9, and Trend-Holds fell from 14 to 13. Regime downgrades outnumbered upgrades 12 to 8, a clear risk-off tilt. The selling concentrated in FFIV -26% (ours last week), INTC -24%, PINS -13%, GOOG -12% on the downside, while SOFI +15%, AIXA.DE +14%, LLY +11%, LULU +8% held up against the tape. Fresh damage showed up in AMZN, ETHA, FFIV and NVDA, among others, dropping to Breakdown. Trend-Hold was reclaimed in NOC, RTX and TGT.
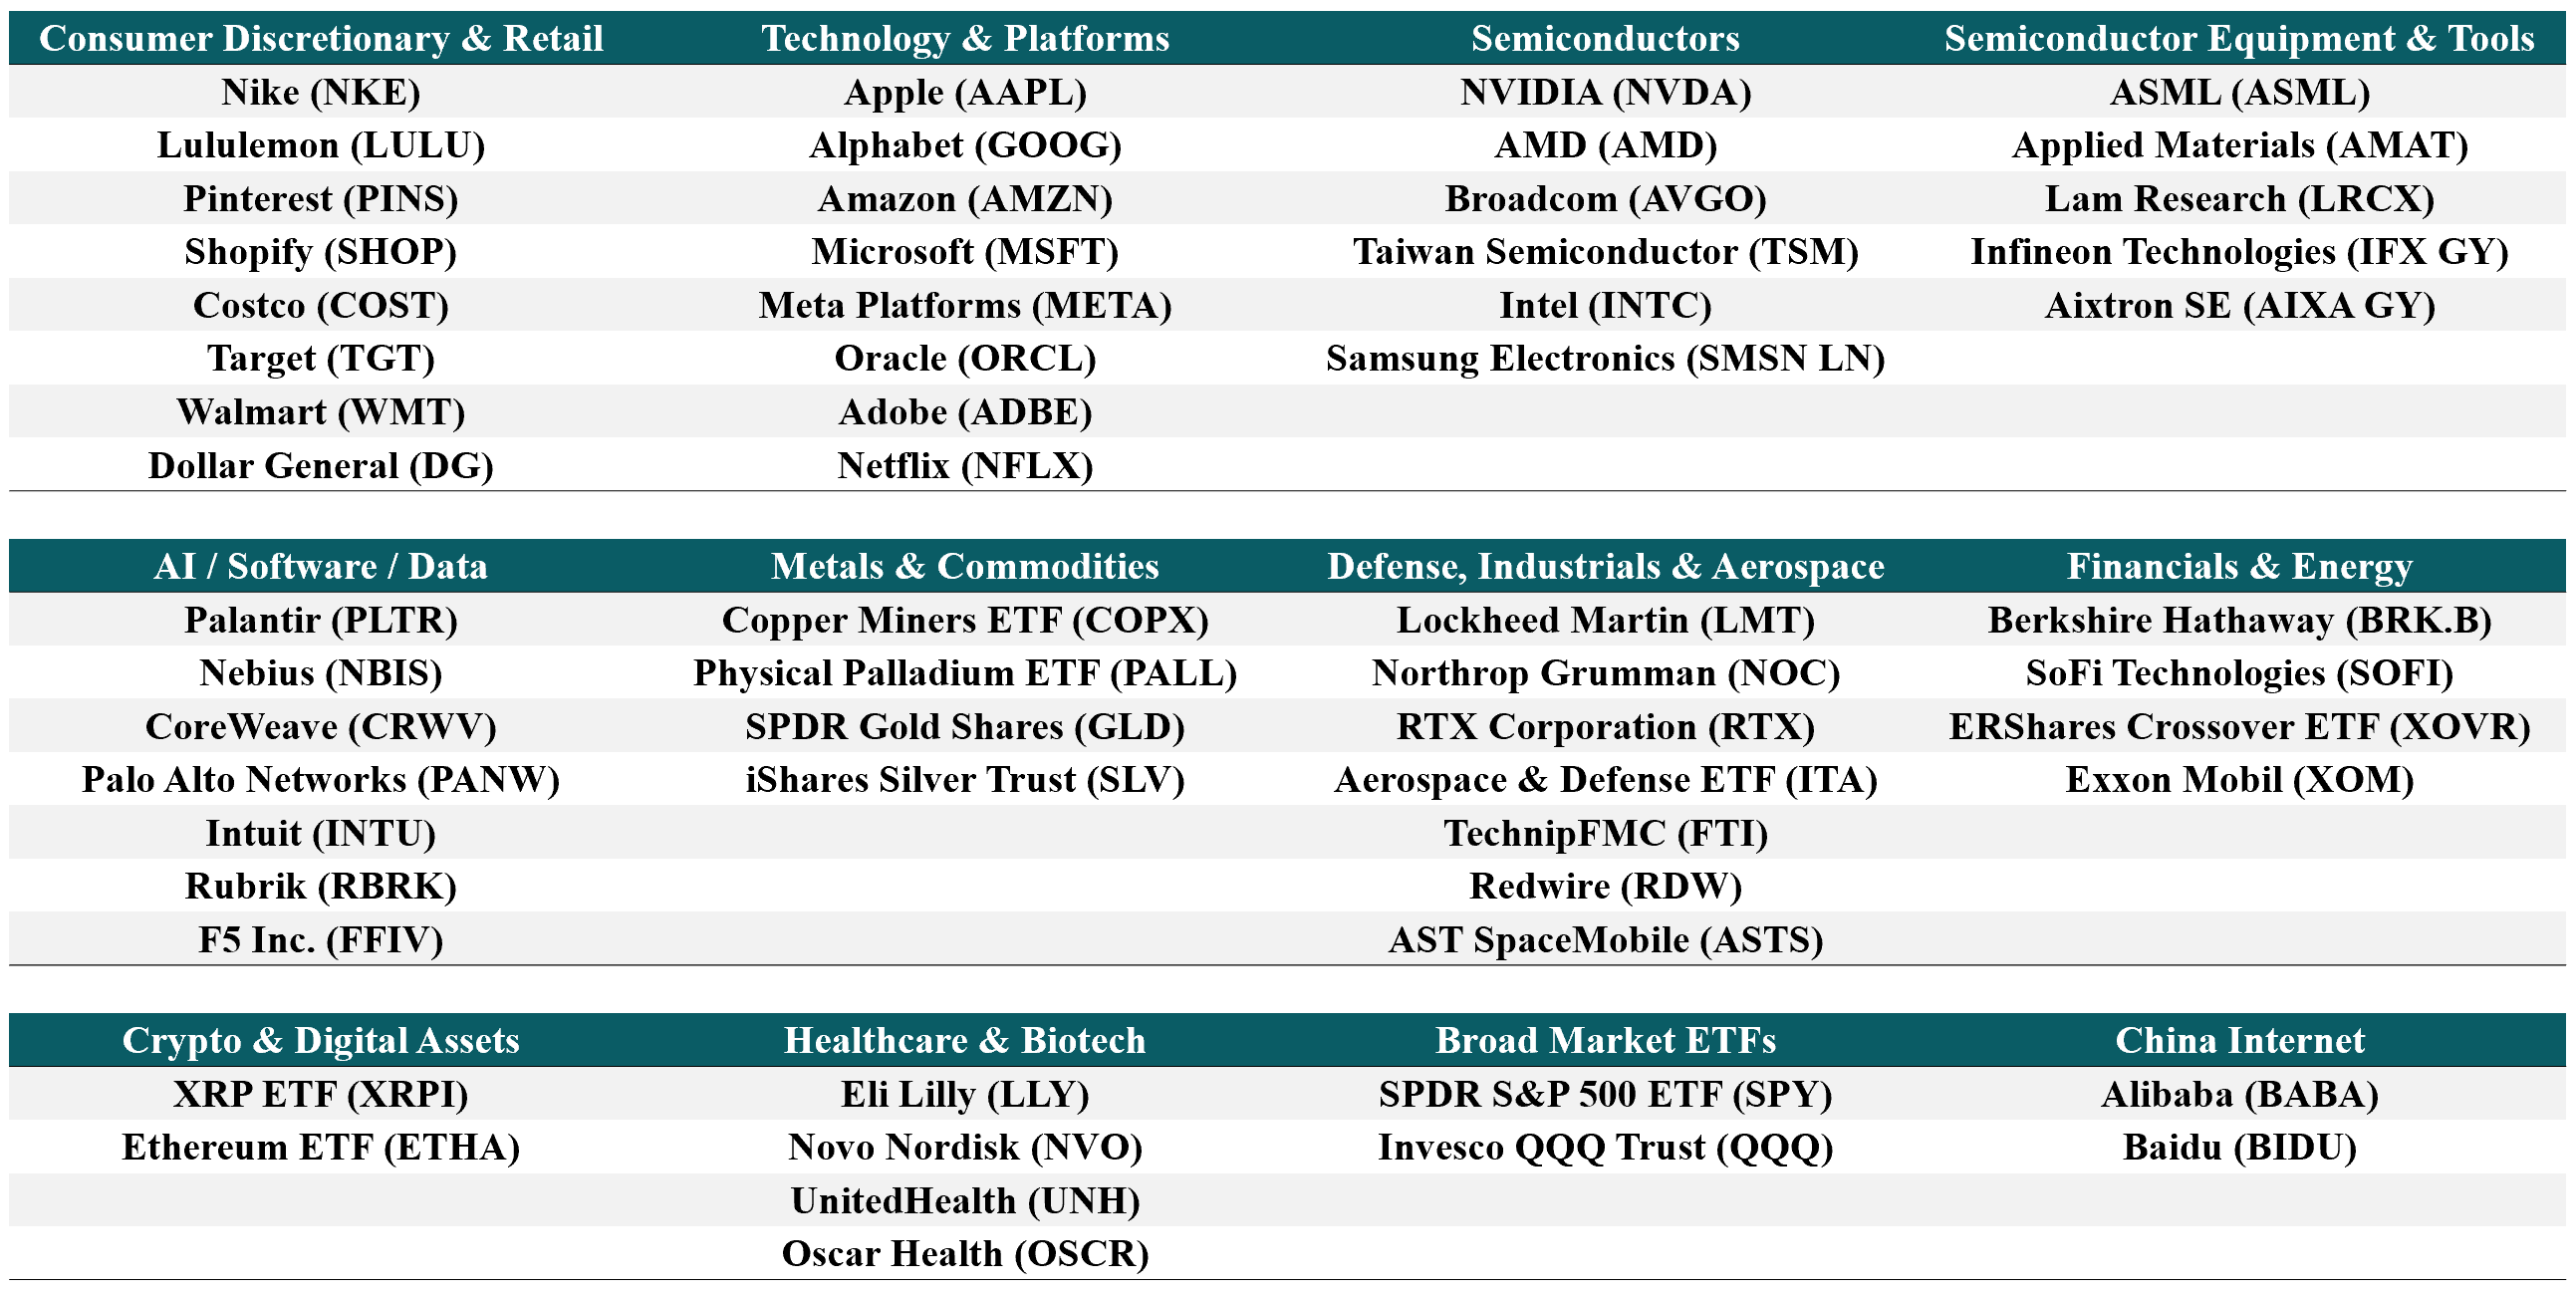
Read those counts as a statement about where our own rules will let us buy, not as market breadth. 59 names are not a representative sample, and they are not 59 independent bets: 11 semiconductor names, 4 defence, 4 metals, 2 index ETFs and 2 crypto vehicles move largely together. That leaves few places to buy weakness: 34 names sit below their own trend and so offer no dip to buy at all, and on a further 18 the dip that exists runs into its own stop, which leaves strength as the only honest trigger.
What Changed From Last Week
Reclaimed Trend-Hold: NOC, RTX, TGT. These reclaimed while the benchmarks did not, so they are isolated pockets of strength rather than the leadership of an advancing tape, and the weekly chart still has to hold what the daily just took. We rank fresh reclaims behind names that already held the regime.
Lifted out of Breakdown into Transitional: SOFI. An early bounce that still has to prove itself.
Up a step from Repair into Transitional: LULU, NKE. Basing turned into actual recovery attempts, one notch short of a trend.
First repair off the lows: ITA, NVO. Damaged names showing the first sign of basing.
Cooled out of Trend-Hold into Transitional: PANW, PLTR, SHOP. Leaders that lost their trend and now need to re-prove it.
Lost the trend, into Repair: AMD, FTI, SPY. Downgraded a full step, treat these as damaged until reclaimed.
Broke down: AMZN, ETHA, FFIV, NVDA, PINS, XOVR. Fresh damage, the framework moves these to the avoid list. FFIV went from Trend-Hold to Breakdown in a single week, which is a three-regime fall and the sharpest kind of break the framework registers.
How Our Trade Plans Work
Each name is classified into a regime (Trend-Hold, Transitional, Repair or Breakdown) from the 1D EMA stack. The five detailed setups print the 1W regime beside the 1D one; the condensed tables carry the daily classification only, so a name can be Trend-Hold in the table and weaker on the weekly chart. Every level traces back to a specific indicator. T1 is the first profit-take, T2 the structural objective, T3 the stretch target. Regime sets how much risk a name is allowed and when: Trend-Hold earns full risk but only on a pullback to support or a confirmed breakout; Transitional gets half or nothing; Repair gets a starter only after a reclaim; Breakdown gets none until a reclaim confirms. Those words are shares of a fixed risk budget and nothing more: if a full position risks half a percent of the account, half size risks a quarter of a percent and a starter less again. They are not statements of conviction, and a smaller size does not improve a trade, it only limits what a bad one costs.
Two stops, two jobs, and the tighter one governs. The trade stop is the tactical level where we step aside and let the position go, and it is the number the Stop column carries. The regime invalidation is the deeper level at which price sits under the whole moving-average stack and the trend structure is gone. Be clear that the second is not the first thing to change: the classification is the count of moving averages price closes above, so it steps down one notch at the nearest average below price, usually a few per cent away, and each detailed setup now prints that level too. Every stop here is a daily CLOSE condition, not a resting order, so it can be passed through on a gap and an intraday break that recovers by the bell does not trigger it.
Which level wins when two of them fire. Four prices can apply to one position, so the order of precedence is fixed. The tactical stop comes first: a daily close below it and the position is closed, whatever else is true. Second, the trailing level in the setup, which only ever tightens that exit for a position already in profit and never loosens it. Third, a regime step down, which does not close anything; it caps the size, so a position already open is held under its stop and not added to. Last, the invalidation, which sits below the tactical stop and is reached only if the stop was already passed through on a gap. Entries are read intraday, and classification is read at the close, so a dip entry can fill in the morning on a day that ends in a weaker regime: the stop still governs, and the new classification applies to what you do next rather than forcing a sale. For most setups the invalidation was the only number we showed, and across the 441 fills from those issues it sat a median of 10% away while the typical trade never travelled more than 3.2% against us: only one trade in seven ever reached it. A stop that far out is a thesis level, not risk control, and printing it alone was our mistake.
The counts below are not interchangeable. Across 20 weeks we have published 969 entries carrying a price: 564 triggers above the close, of which 283 were reached, 50%, and 405 dip bands at or below it, of which 261 filled, 64%. A band fills more often because price only has to come back to it. Together 544 of 969 filled, 56%. Six further rows printed “on reclaim” with no level at all, an old fallback we have since removed; they could not fill and are excluded. The 441 figure beside the invalidation is narrower again: the fills from the fifteen issues that published an invalidation rather than a governing stop. None of these is a count of independent experiments. They are 59 overlapping names across consecutive weeks, so one bad week moves all of them, and the rules were being adjusted as the history accumulated.
How long a trade lasts, and when to take something. Every level here is a one-week level: take it during the plan week, and if neither the first target nor a stop has been reached, mark it at Friday close and re-read the structure next issue. T1 is touched at some point in the week on 53% of 544 filled setups, and what you do there matters more than where you entered. Held to Friday or the stop, 42% of setups finish green and the average returns -0.7%. Closing the entire position at T1 lifts the green share to 64% but cuts the average to -2.1%, because it sells every winner at the first target and keeps every loser. Half off at T1 with the rest left to run lands between the two: 44% green, -1.4% average. Pick on that basis rather than on instinct, and be clear what none of the three does: every one of those averages is negative, so T1 management changes the shape of the record, not its sign.
When a level is a trade and when it is only a level. Every entry here is measured from its own price to the stop that governs it, and on to the first target that entry can still reach. If that pays less than one to one we print the level and say it does not qualify, because below that we would rather hold the cash. The threshold is our choice rather than a law, and clearing it is not proof of a profitable trade: it is the floor, not the case. A failing entry is never rescued by a smaller position, because size changes what a bad trade costs and not whether it is bad.
A note on what our own record does and does not show. The one place we thought we had measurable value was the avoid tag, and it does not survive being measured as a policy you could run. Counting only the avoid names that never reclaimed, they fell 2.3%, which looks decisive until you notice that you can only identify that group after the week has finished. Counting every name we tagged avoid, the figure is -0.5% against -1.0% for the rest of the book. So the tag has neither helped nor hurt, and we would rather say that than quote the flattering version.
One name you cannot size in. XRPI clears too little daily volume for a retail order to fill without moving the price, so its classification is coverage rather than a tradeable signal.
Size by risk, not by dollars. Among the names this issue says you may take, stop distances run from 1.3% to 7.1%, so the same dollar amount in two names can mean risking 5 times as much on one as the other. Decide what a single losing trade may cost you, say half a percent of the account, and divide it by the distance from entry to stop. A 1.3% stop carries 5 times the position of a 7.1% stop for identical risk. The wide-stop names are not off limits; they are simply small.
Two limits on that formula, because on its own it will concentrate you. Risking half a percent of the account against a 1.3% stop puts about 38% of the account in that one position, which is more than any single idea in this letter deserves: cap any one name at a fixed share of the account as well, and treat two names in the same sector or two index ETFs as one position for that purpose. And every stop here is a daily CLOSE condition rather than a resting order, so the distance to it is not a maximum loss. A gap can close well through it, and an intraday break that recovers by the bell does not trigger it at all. Size for a worse outcome than the arithmetic shows.
This update ranks 59 names. You are not meant to trade all of them, or even most of them. Most weeks a handful sit at a level worth acting on and the rest are there so you can check our work.
The Week Ahead
These names in the universe report during the plan week:
Monday: AAPL, PLTR
Tuesday: AMD, SHOP
Wednesday: NVO, RDW
Thursday: OSCR
Confirmed from the companies themselves: OSCR Q3 call 8:00 a.m. ET on November 5 (ir.oscarhealth.com) and RDW results after the close on November 4, call 9:00 a.m. ET on November 5 (rdw.com newsroom).
On NVO, our second calendar says November 4 and an SEC filing summary agrees, but Novo Nordisk’s own financial calendar does not render a date and third-party sources give November 3, 4 and 5. Treat the day as unsettled.
Two notes on these dates. NVO appears in only one of our two calendars, so that date is unconfirmed and the rest (AAPL, AMD, OSCR, PLTR, RDW, SHOP) are confirmed by both. Check the company before you size into any of them.
Market-wide releases this week, from the BLS calendar: Tuesday 10:00 a.m. ET, Job Openings and Labor Turnover Survey (September), Thursday 8:30 a.m. ET, Productivity and Costs, preliminary (Q3) and Friday 8:30 a.m. ET, Employment Situation (October). These move the whole book at once rather than one name, so a single level surviving them is not the test; the payroll print on the last session of the week lands after most of these levels have had their chance to fill.
Earnings are binary, and the framework does not trade into them: if a name on this list reaches its entry before it reports, we do not take it. There is no reduced-size version of that, because a gap through the stop costs the same multiple of the risk whatever the size. Wait for the print, then re-read the structure. A level that was valid on Friday is not wrong after a gap, it is simply no longer the level.
Those matter more than the rest of the list, because you have a live instruction on them this week: AAPL is tagged “Watchlist, below minimum reward/risk”, AMD is tagged “Skip, no room”, NVO is tagged “Watchlist, below minimum reward/risk”, OSCR is tagged “Watchlist, below minimum reward/risk”, PLTR is tagged “Watchlist, below minimum reward/risk” and SHOP is tagged “Watchlist, below minimum reward/risk”. No new position goes on in any of them before the print. If you already hold one, that is a decision about an open position rather than a new entry: it runs under its own stop, and our scorecard marks it at Friday close whether or not you actually sold. After the print the levels have to be re-read before they mean anything again.
Just beyond the plan week: BRK.B on Saturday November 7, ASTS on Monday November 9, IFX.DE on Tuesday November 10, CRWV on Tuesday November 10, NBIS on Thursday November 12, AMAT on Thursday November 12. Worth knowing now if you are sizing a position you intend to hold through it.
Note that BRK.B is among this week’s detailed setups, and that print lands after the plan week ends. Our convention of marking every level at Friday close is how we score the week; it is not a sale. So there are two coherent choices and no third: close the position before Friday’s bell, which is the only thing that removes the event, or carry it knowingly through the report at a size that survives a gap. Our scorecard takes the first, which is why the record will not show what the print does to anyone who took the second.
This Week’s Playbook
Same four regimes as above, in the order they earn risk. Regime decides how much a name is allowed; the level beside it decides when. Detailed setups for the top names follow, and the watchlist carries every level.
Within each group the names are ordered by how close the entry sits to Friday close, nearest first, which is what the Trigger odds column in the tables below reports. That shows where a decision is likely to be needed, not where the reward is. Of the 564 triggers we have published, the ones we would have called likely were reached 76 percent of the time, even odds 47 percent, and unlikely 17 percent, with roughly half never touched at all. Reaching a level is not the same as profiting from it: of the 146 likely ones that filled, the average came back about one percent negative, with about four times in ten closing green. Read the top of each list as the levels most likely to demand a decision, and size them off the stop underneath.
Where that leaves your exposure. The 59 names we cover split in one way that matters: 7 publish an entry that clears our one-to-one minimum (BRK.B, COST, MSFT, NOC, RBRK, RTX, TGT), and the remaining 52 do not, so they are reference levels this week and not purchases. Of the 7 that qualify, 4 are dips you would buy into weakness and 3 are triggers above the price. That is a separate question from whether a level gets reached, which the Trigger odds column answers, and from whether the level is worth watching at all, which is what the watchlist is for. So little new money goes to work until a level prints, and that is about fresh capital for new trades, not an instruction to sell what you already hold: positions you own are governed by their own stops and the trail lines in each setup. Cash is an allocation rather than the absence of one, and it is not free: it loses purchasing power while it waits, and whether it beats the names it is waiting on is exactly what none of us knows in advance. What it buys is the ability to take a level when one prints. The S&P regains its trend on a daily close above 767.73, +1.6% from Friday (its row in the table shows 756.27, the 1D EMA100, which is the nearest level back rather than the full reclaim). The Nasdaq-100 regains its trend on a daily close above 723.04, +4.7% from Friday (its row in the table shows 705.70, the 1D Tenkan, which is the nearest level back rather than the full reclaim). Those two levels are context rather than a gate. Every entry here is permitted by its own regime and its own level, so a qualifying setup is takeable with the benchmarks where they are; what the index regime changes is how much of the book should be working at once, not whether a single trade is allowed. What would make us less defensive: either benchmark reclaiming its trend, the Breakdown bucket shrinking two weeks running, or dip bands reappearing on names that clear one to one to their first target. What would make us more defensive: more names dropping into Breakdown, the weekly classifications following the daily ones lower, or stops hit on the setups below. Until something moves, do not manufacture a trade out of a name you like at a price the plan never gave you.
Trend-Hold, full risk, but only at a level. On a pullback to support: RBRK, TGT, BRK.B, COST. Only on strength, above the trigger in the table: RTX, NOC. On XOM, WMT, AAPL, DG, UNH the first target does not clear the distance to the stop, so those are a level to watch and not a position: see the payoff line below. LLY, LMT are also Trend-Hold and carry the overbought instruction below rather than a level here.
Transitional, half size or nothing. The trend is not confirmed, so a position here is a probe rather than a holding. Only on strength, above the trigger in the table: MSFT. On ADBE, NKE, PANW, OSCR, SHOP, LULU, SOFI, PLTR, INTU the first target does not clear the distance to the stop, so those are a level to watch and not a position: see the payoff line below.
Repair, nothing to take this week. A reclaim buys a trend that has not formed yet, which is only worth paying for when the first target is further away than the stop. On every Repair name this week it is nearer, so these are reference levels and not starters: SPY, AMD, FTI, SMSN.L, ASML, NVO, TSM, ITA, and 1 more carrying the same instruction in the table below.
Breakdown, no exposure until a reclaim confirms. Not every dip is a setup, and cash is the position: AIXA.DE, ORCL, ETHA, RDW, IFX.DE, ASTS, AVGO, XOVR, and 19 more carrying the same instruction in the table below.
Overbought inside their trend: LLY, LMT. The trend is real but the entry is not. A Trend-Hold does not earn its full size at any price, so wait for the reset.
Where the payoff justifies the stop. A wide stop is not a bad setup, it is a small one, but some names are not paying enough to be worth much size. Both figures are measured from the published entry to the governing stop and to T1, the first target, which is the only one the condensed tables carry; T2 and T3 sit further out and are in the detailed setups.
- Tight and paying: BRK.B (1% stop for 7% to T1), COST (2% stop for 6% to T1), RTX (5% stop for 11% to T1), RBRK (7% stop for 16% to T1)
- Do not take, the first target does not clear the risk: LULU (7% stop for 1% to T1), SHOP (8% stop for 1% to T1), PANW (11% stop for 2% to T1), OSCR (6% stop for 1% to T1)
Top 5 Actionable Setups
Five names taken only from the Trend-Hold group, after dropping anything overbought above RSI 73, anything whose EMA stack is inverted, anything reporting earnings inside the plan week, and anything without at least one average daily range between its entry and its stop.
What ranks the survivors is distance to the 20-day EMA, nearest first, with the strongest trend by ADX breaking ties among names at a similar distance and a name that only reclaimed its regime this week ranking behind one that already held it. A name too closely correlated with one already chosen is swapped out for the next candidate. That ordering is a screen for proximity, not a measure of trade quality: it finds the names whose price is near a level we have defined, and says nothing about whether the trade pays. Whether it pays is tested separately, on each entry, and stated with each setup. Full detail, levels and both stops for each.
The screen is mechanical, but reproducing it exactly needs the indicator settings and thresholds behind it rather than the published levels alone, so treat it as auditable rather than as something you can rebuild from this page. “Actionable” here means a level exists and the rules permit acting on it, not that we have shown the trade pays: on the record above we have not. Each setup below states its own reward against its own risk, and in a week like this one several of those numbers are poor; where they are, the setup says so rather than being dressed up or dropped. The next tier follows in the Also Actionable table, and the rest of the universe in the full watchlist below it.
