
Weekly Trade Plan Update Week 2 April 2026
Regime awareness, key decision zones, and disciplined risk framing

Geopolitics is setting the tone, not the charts.
Escalating conflict risk, supply uncertainty, and energy market tightness are pushing oil higher and forcing a repricing across global assets. That shift is feeding directly into inflation expectations, rate sensitivity, and ultimately equity positioning.
This is why the setup looks the way it does.
Capital is rotating out of duration-sensitive growth and into hard-asset exposure, defense, and cash-generative businesses that can absorb macro volatility. The breakdowns in names like Adobe Inc., Intuit Inc., and Lululemon Athletica Inc. are not random. They are a direct consequence of higher discount rates and deteriorating earnings visibility in a less stable macro environment.
At the same time, the China complex including Alibaba Group and Baidu continues to reflect geopolitical risk premium expansion rather than company-specific weakness.
Even defensives are no longer immune. Berkshire Hathaway slipping below its EMA stack is a key signal. When capital preservation vehicles start breaking structure, it tells you liquidity is tightening and risk tolerance is shrinking across the board.

Energy is the cleanest expression of this shift.
Names like Exxon Mobil are holding trend while large parts of the market are deteriorating. That divergence is not technical noise. It reflects real capital rotation into sectors directly leveraged to the geopolitical backdrop.
Semiconductors remain the battleground.
While ASML, Applied Materials, and Broadcom are stalling or correcting, Advanced Micro Devices continues to trend with strong momentum. The market is not abandoning AI, it is demanding clarity, near-term catalysts, and insulation from geopolitical risk.
Meanwhile, SPDR Gold Shares consolidating despite a supportive macro backdrop is a signal worth watching closely. It suggests real rates and dollar direction are still unresolved, even as geopolitical risk rises.
The takeaway is simple: This is no longer a liquidity-driven market. It is a macro-driven market.
Positioning should reflect that reality. Focus on strength tied to real-world demand and capital flows, avoid structurally broken growth, and treat everything else as conditional.
Cash is not hesitation here. It is positioning.
How our trade plans work
Our process is rules-based and level-driven. Every setup is framed around a small number of decision zones: reclaim zones, pullback shelves, breakout triggers, targets, and a clear invalidation level. We act only at defined levels, where downside risk is already known.
We avoid the middle. We do not chase strength. We step aside when structure breaks. Not every dip is a buy. Not every bounce deserves exposure. Cash is a position. Waiting is part of the plan.
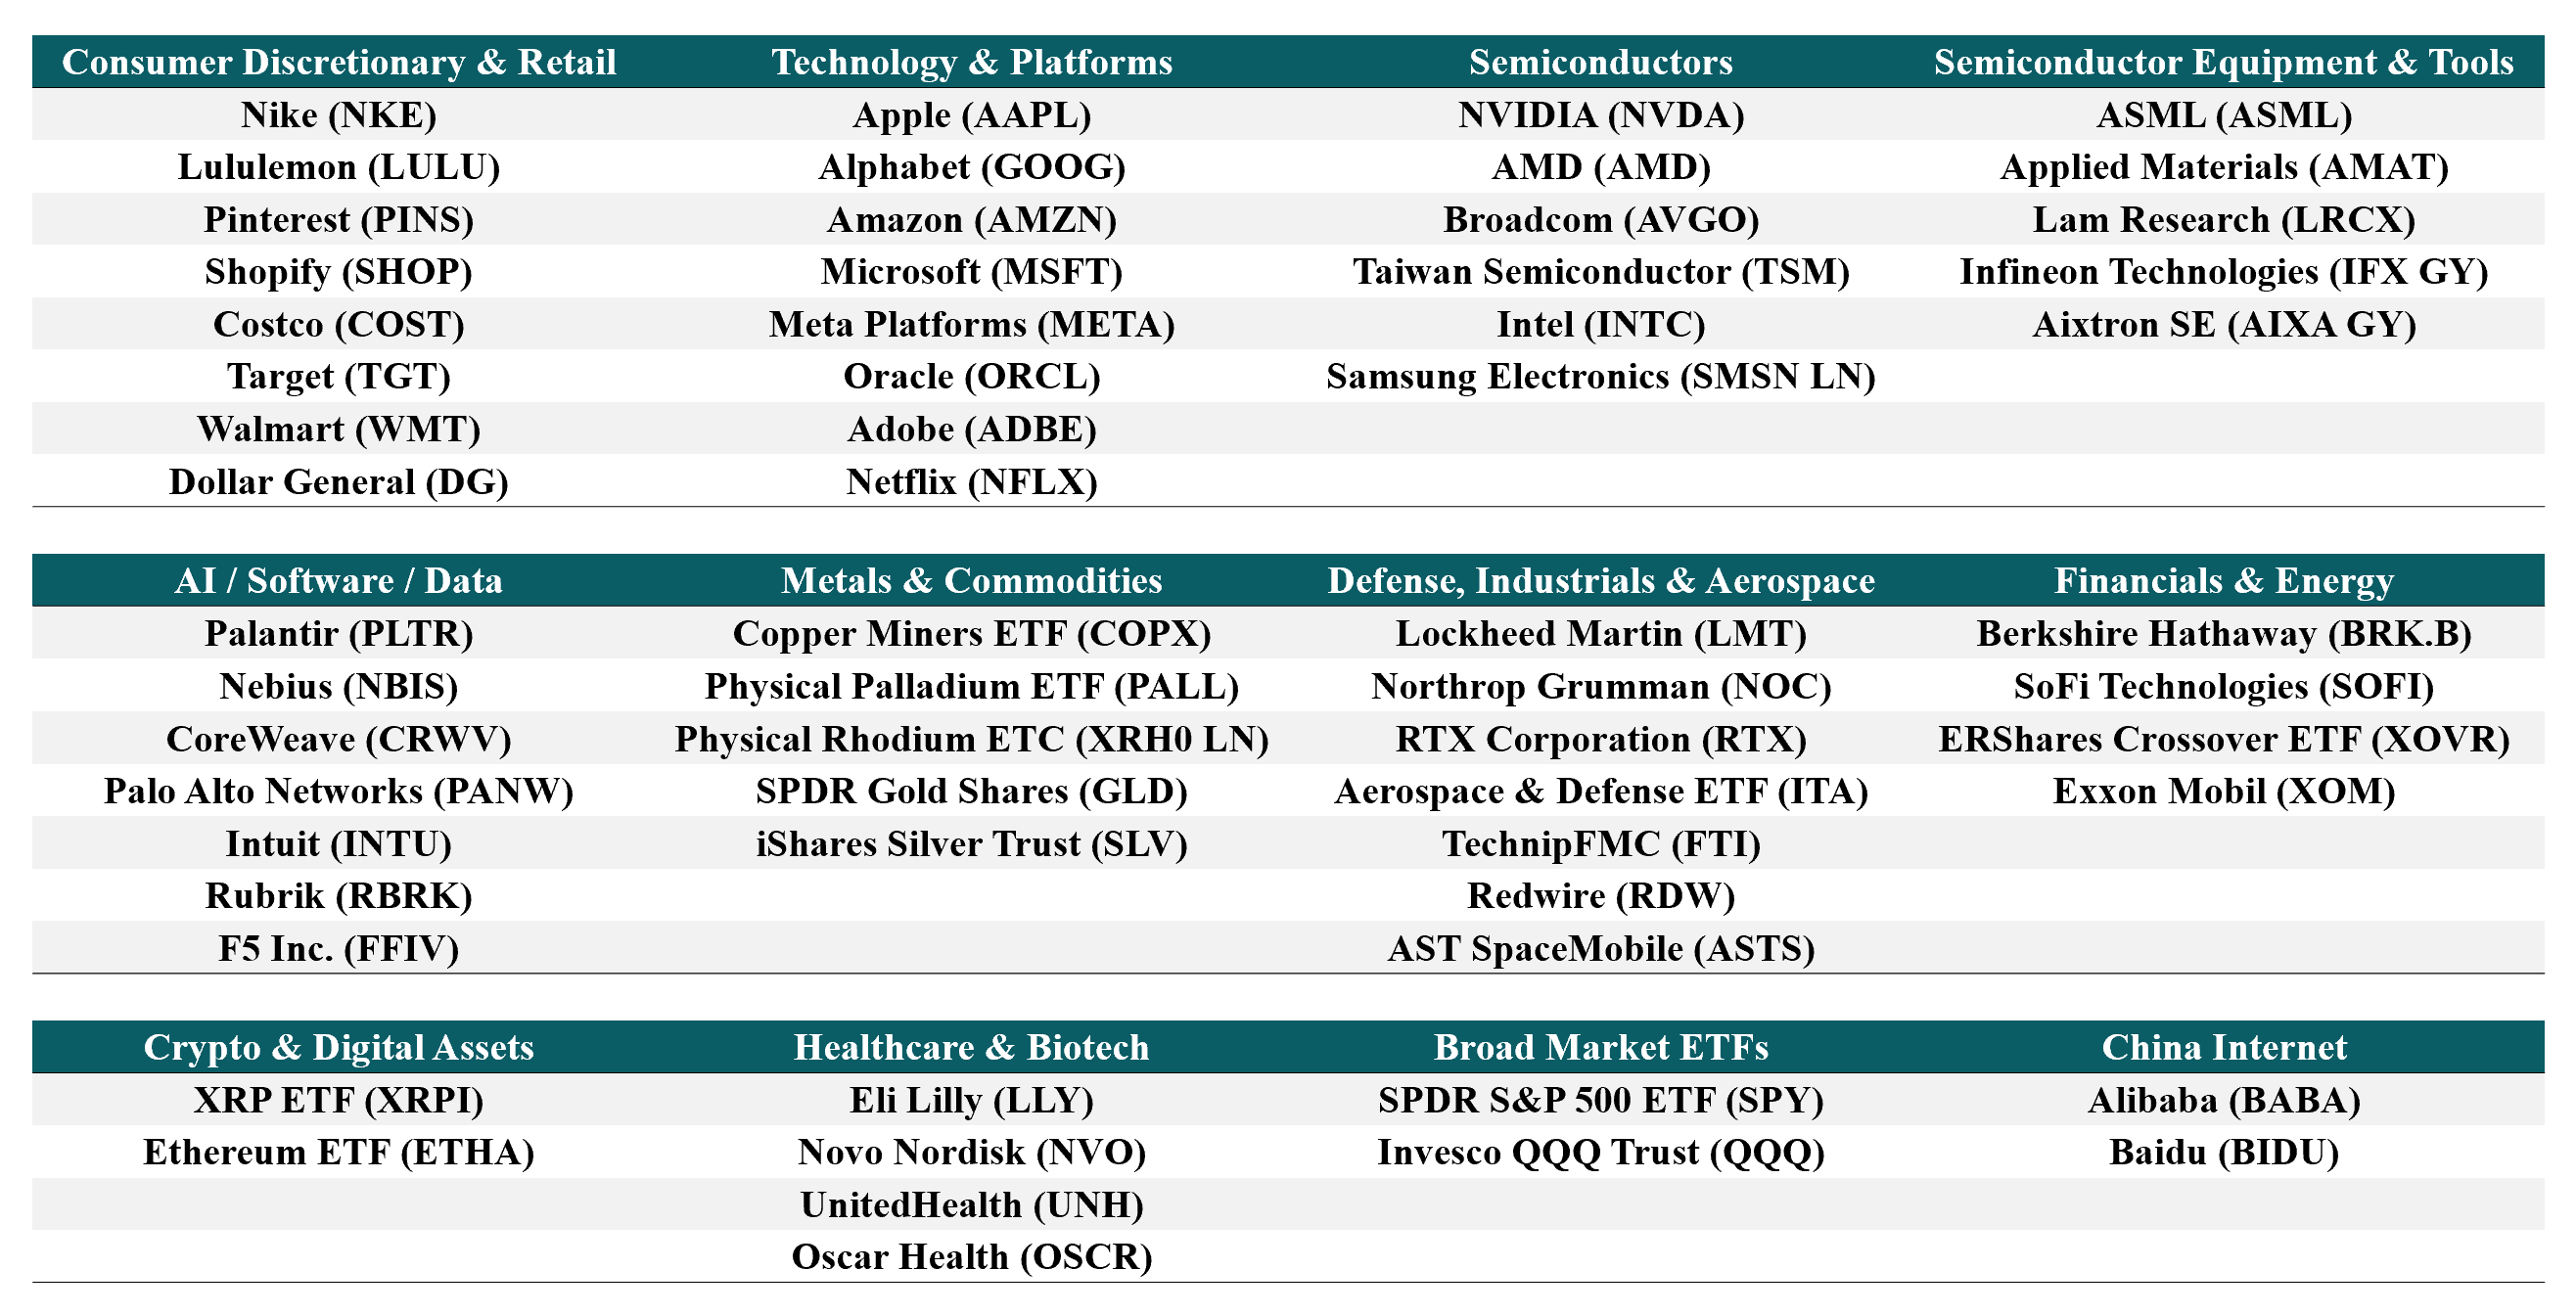
This update covers the following 60 stocks and ETFs across consumer, technology, healthcare, industrials, and commodities.
What Has Been Working So Far
The edge hasn’t been prediction. It’s been discipline.
Avoiding broken structure has mattered more than catching bottoms.
Staying out of Adobe Inc. and Intuit Inc. despite short-term MACD stabilization avoided names still in active downtrends. The same applies to Lululemon Athletica Inc., where oversold signals never translated into opportunity because structure never repaired.
That’s the key distinction in this setup: oversold is not a signal inside Breakdown.
On the other side, strength has been rewarded.
Advanced Micro Devices continues to trend with expanding momentum, while Costco Wholesale and F5 Inc. have held clean, above-EMA structures with consistent participation. That’s where capital has actually been working.
Equally important has been avoiding “cheap” narratives.
Alibaba Group and Baidu looked attractive on valuation, but remained structurally broken. Price confirmed the risk, not the story.
The consistent theme is simple: Respect the regime. Respect invalidation.
The difference between protecting capital and losing it in this market has been the willingness to exit when structure fails, not average into weakness hoping it recovers.
Detailed Trade Setups
Apple Inc. (AAPL) Last close: 255.92
Setup: Apple is being treated as a barometer for the consumer technology complex at a moment when the broader large-cap tech tape is bifurcating sharply between franchise names with near-term earnings visibility and those carrying valuation risk into a challenging macro. Price has recovered above the EMA20 at 254.43, which is constructive on the surface, but remains trapped below the EMA50 at 258.59 and EMA100 at 258.77, exactly where the 61.8 percent Fibonacci retracement of the 120-bar range lands at 260.69. That confluence is meaningful, because it defines the ceiling that must be resolved for any constructive re-rating to begin. The Ichimoku cloud sits above current price, adding a third layer of overhead. MACD is bullish and expanding with a histogram reading of positive 0.794, and the Kalman filter is in agreement with price above filter and positive speed, suggesting the short-term momentum lean is to the upside. However, ADX at 20.5 with negative DI dominant at 25.7 argues this is a corrective bounce inside a larger mixed structure rather than a new impulse. If Apple can reclaim and close above the 258.59 to 260.81 zone (EMA50, EMA100, and Kijun convergence), the transitional regime becomes credibly upgradeable. If not, it remains a range-bound tape name in a sector where capital is being selectively deployed rather than broadly committed.
Current regime: Transitional
Key decision zones: Support at 254.43 (EMA20) / 251.20 (EMA200). Reclaim levels at 258.59 (EMA50) / 260.81 (Kijun).
If not in the position: Wait for a confirmed close above 260.81 on expanding volume before considering initiation. Avoid chasing short-term MACD momentum into unresolved Fibonacci resistance.
Invalidation and thesis-failure rules: A close below 251.20 (EMA200) would shift the regime toward Repair and warrant staying on the sidelines. Structural thesis fails if price cannot reclaim the EMA50 within two to three weeks of price stabilizing above EMA20.
Adobe Inc. (ADBE) Last close: 242.92
Setup: Adobe’s chart is a textbook representation of institutional distribution in the software sector, a group that has been a consistent source of liquidity for managers redeploying into more defensive or cyclically advantaged names. Price sits below every EMA in the stack, with the EMA200 at 324.00 now more than 80 points above current levels, underscoring how deep the structural damage runs. ADX at 37.7 with negative DI at 29.0 dominating confirms that the downtrend is not exhausted but directionally intact. The MACD histogram is technically in positive territory at 0.281, a fact that has trapped buyers in names like this before: a modest bullish histogram reading inside a Breakdown regime with dominant directional pressure to the downside is a mean-reversion signal at best, not a trend reversal. MFI at 34.1 reflects genuine selling pressure at the institutional level. The 50 percent Fibonacci retracement of the 120-bar range sits at 298.43, more than 55 points above current price, and the 38.2 percent level at 313.83 represents the first credible structural resistance. Until ADBE can reclaim its EMA20 at 249.40 on volume and then hold it as support, this remains a Breakdown regime name where any long exposure is capital misallocation relative to the structural alternatives available in this tape.
Current regime: Breakdown
Key decision zones: Support at 233.16 (120-bar low) / 242.09 (Tenkan). Reclaim levels at 249.40 (EMA20) / 267.08 (EMA50).
If not in the position: Do not initiate. The MACD bullish histogram inside a Breakdown regime is a technical mirage without EMA stack reclamation. This name requires a multi-week base, EMA20 reclaim, and confirmed volume expansion before it warrants attention.
Invalidation and thesis-failure rules: Any rally that fails at or below 249.40 and reverses with volume confirms the distribution thesis. A close below 233.16 would represent new 120-bar lows and accelerate downside target projections meaningfully lower.
Aixtron SE (AIXA.DE) Last close: 33.28
Setup: Aixtron occupies a unique position in the European semiconductor equipment space, benefiting from the same structural buildout of compound semiconductor capacity that has driven thematic interest in the group over the past 18 months, but now entering a period of short-term consolidation after an extraordinarily steep recovery off the lows. Price remains above the full EMA stack, with the EMA200 at 20.02 and EMA50 at 28.30 providing substantial distance below current levels, which speaks to the trend’s durability on an intermediate basis. However, MACD is bearish and accelerating with a histogram reading of negative 0.475, and the Kalman filter speed has turned negative at minus 0.191, flagging near-term deceleration. Volume data is non-contributory at effectively zero, which limits conviction on directional signals this week. The Ichimoku cloud remains below price, a supportive structural backdrop, and Fibonacci levels from the 120-bar range place the first meaningful support at 27.17 (38.2 percent retracement), well below current levels, underscoring how much cushion the trend has built. If AIXA.DE can hold above the EMA20 at 32.33 and arrest the MACD deterioration, the trend structure remains intact. For existing holders, the setup is a trailing discipline exercise rather than an add opportunity at current extension.
Current regime: Trend-Hold
Key decision zones: Support at 32.33 (EMA20) / 28.30 (EMA50). Reclaim levels are not applicable given above-stack positioning; monitor EMA20 as the trailing anchor.
If not in the position: Trail risk below EMA20 at 32.33 for existing holders. New entries require a pullback toward EMA20 with MACD stabilization and volume confirmation. Do not chase at current levels with a decelerating Kalman filter and bearish MACD histogram.
Invalidation and thesis-failure rules: A weekly close below the EMA20 at 32.33 with negative volume would shift the regime to Transitional and warrant reducing exposure. A close below EMA50 at 28.30 would constitute full thesis failure and require exiting remaining position.
Applied Materials Inc. (AMAT) Last close: 348.47
Setup: Applied Materials is navigating a crossroads that is representative of the broader semiconductor equipment group’s dilemma: structurally intact longer-term positioning above the EMA100 and EMA200, but short-term momentum stalling at a cluster of medium-term moving averages and cloud resistance. Price has slipped just below the EMA20 at 348.86 with a negative MACD histogram of minus 1.575 that is described as stabilizing but not yet reversing, and Kalman filter speed at minus 0.698 confirms short-term deceleration. The Ichimoku cloud contains current price inside its boundaries, which is the definition of a range-resolved-nothing environment. ADX at 15.1 reflects low trend conviction in either direction. That matters because a low-ADX, inside-cloud setup with decelerating momentum argues for patience rather than commitment. The 38.2 percent Fibonacci retracement of the 120-bar range sits at 322.40, representing the next meaningful technical floor below the current EMA cluster. MFI at 61.7 is one of the more constructive money flow readings in this tape, suggesting that institutional selling has not been aggressive despite the price stall. If AMAT can reclaim the EMA20 at 348.86 and push through the Kijun at 355.07, the setup improves. Until then, this is a consolidation-within-uptrend structure requiring confirmation rather than anticipation.
