
Weekly Trade Plan Update - Week 3 April 2026
Regime awareness, key decision zones, and disciplined risk framing

The market is not moving as one.
Leadership is narrow and highly selective. Semiconductor equipment, AI infrastructure, and parts of mega-cap tech continue to attract real institutional capital. Names like AMD, AMAT, AVGO, and LRCX are holding above full EMA stacks with expanding momentum. That is not random strength. That is where money is being deployed.

At the same time, large parts of the market are still under pressure. Enterprise software, Chinese ADRs, and segments of consumer discretionary are being actively sold. ADBE and INTU are not stabilizing, they are breaking down on volume. That signals a broader repricing across software, not isolated weakness.
Defensives are not providing a clean signal either. Berkshire breaking down and gold remaining range-bound suggests capital is not rotating cleanly into safety. Instead, it is concentrating into a small group of “must-own” themes while exiting everything else.
This is not a broad bull market. It is a selective one. And that distinction matters.
What Has Been Working So Far
The edge has come from one thing: respecting structure over opinion.
Avoiding breakdowns has mattered more than chasing upside. Staying out of names like ADBE, INTU, and DG prevented unnecessary losses because oversold conditions never translated into real support.
On the other side, sticking with confirmed trends has worked. Semiconductor names like AMAT, LRCX, AVGO, and AMD continued higher because they never broke structure. Waiting for confirmation in GOOG before re-engaging also paid off.
The takeaway is simple. This market is not rewarding anticipation. It is rewarding patience.
The goal is not to catch every move. It is to stay aligned with strength and avoid participating in weakness.
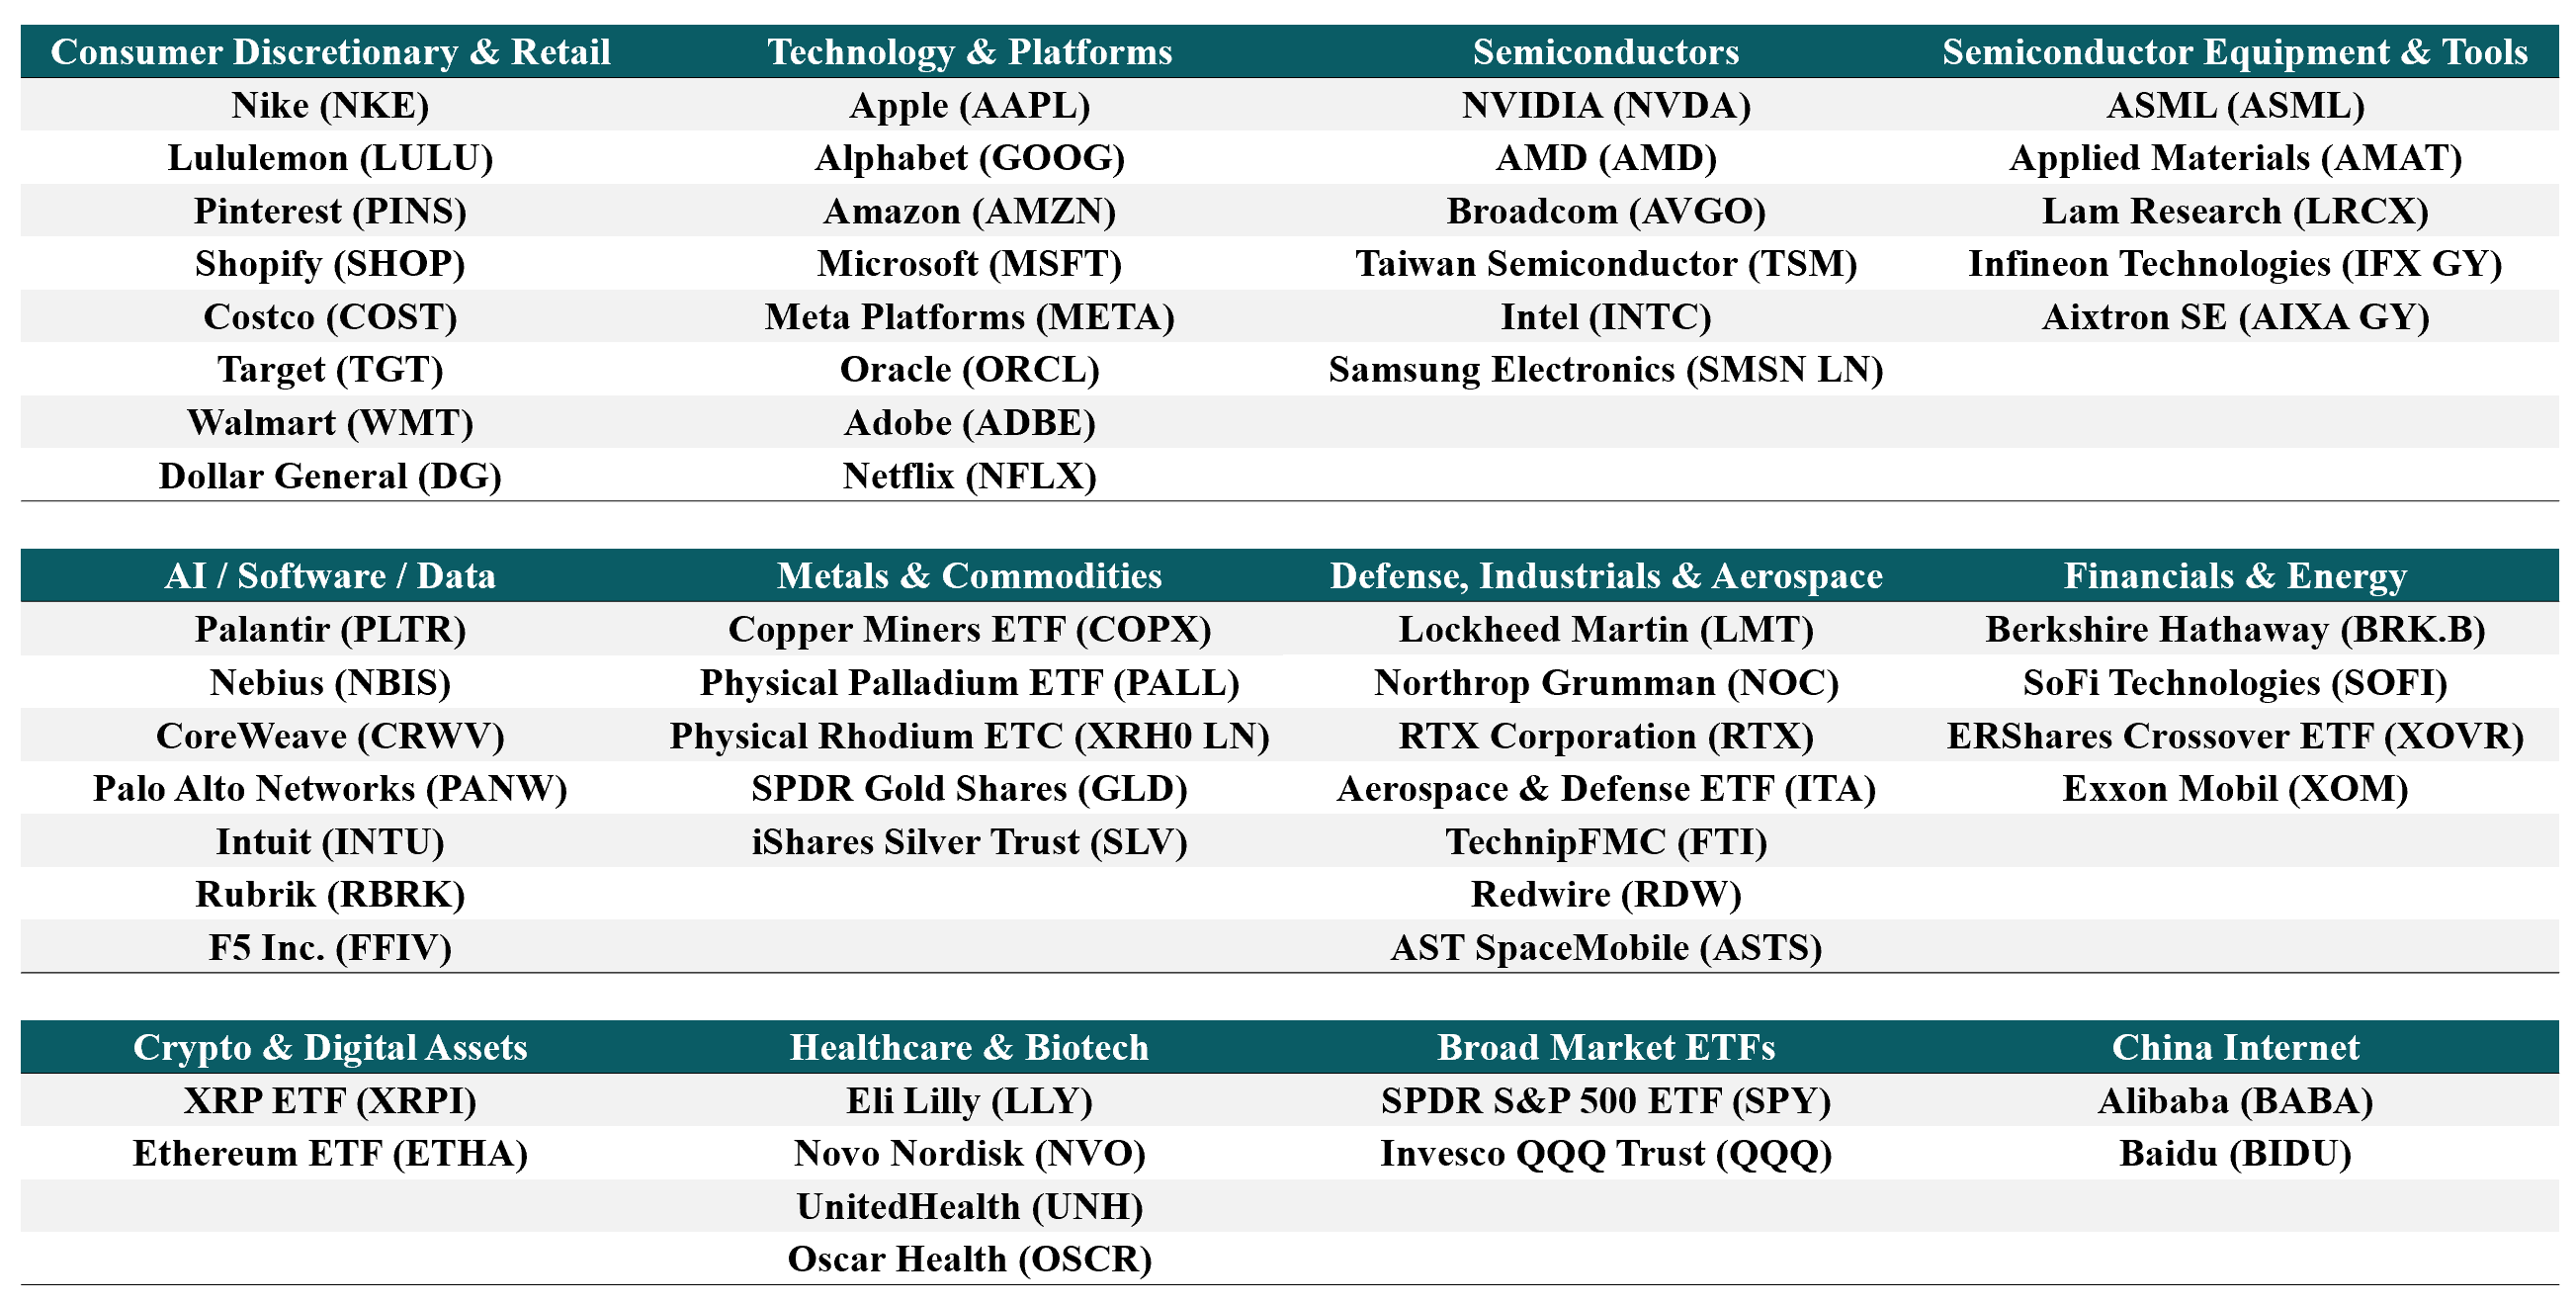
This update covers the following 60 stocks and ETFs across semiconductor equipment, mega-cap technology, enterprise software, Chinese internet, consumer defensive and value retail, aerospace and defense, European industrials, precious metals, digital assets, healthcare, fintech, cybersecurity, commodities, and broad market indices:
How Our Trade Plans Work
The framework is simple: we act only when risk is clearly defined.
We do not chase extended moves, average into weakness, or treat oversold conditions as automatic entries. Every setup must pass three filters:
Regime – Is the stock in a trend, repair, or breakdown?
Structure – Are we near a level that defines risk?
Confirmation – Is price action and volume supporting the move?
If those conditions are not met, we do nothing.
Cash is not idle. It is optionality. And invalidation levels are rules, not suggestions.
Detailed Trade Setups
The complete framework, including risk parameters and invalidation levels, is outlined below; all content is for informational purposes only.
Apple Inc. (AAPL) Last close: 260.48
Setup: Apple sits at the center of the mega-cap technology narrative in a week where the tape is selectively rewarding large-cap quality with visible earnings and cash return frameworks. Price is holding above the full EMA stack, a technically clean posture, but the internal architecture is less straightforward than the headline regime suggests. The 61.8 percent Fibonacci retracement from the 120-bar range rests at 260.69, essentially at current price, meaning AAPL is pressing into a significant structural resistance node rather than clearing through open air. The Ichimoku cloud sits above price, reinforcing that overhead supply remains a material constraint, and the ADX at 17.2 with a negative DI exceeding the positive DI suggests directional conviction has not yet been established by the buying side. Volume running at 0.77 times average confirms this is not a high-conviction accumulation environment. If AAPL can clear 260.69 and then the cloud, a path toward the 50 percent retracement at 266.02 and the prior swing high near 271.35 opens. If price fails to hold the EMA20 at 256.09, the setup reverts from trend-hold to a range-testing structure with meaningful risk of compression back toward the EMA50 cluster at 258.58.
Current regime: Trend-hold
Key decision zones: Support at 256.09 (EMA20) / 258.58 (EMA50). Reclaim levels at 260.69 (61.8% Fib) / 266.02 (50% Fib).
If not in the position: Wait for a confirmed close above 260.69 with volume expansion before initiating; the current Fibonacci resistance and Ichimoku cloud overhead make chasing this print unattractive.
Invalidation and thesis-failure rules: A daily close below 256.09 (EMA20) removes the constructive case and suggests the structure is consolidating downward rather than building for extension.
Adobe Inc. (ADBE) Last close: 225.35
Setup: Adobe is exhibiting all the characteristics of institutional distribution in the context of a broad enterprise software de-rating that has been accelerating across the sector. This is not isolated stock-specific weakness. It reflects a repricing of growth multiples for subscription-dependent software businesses where AI competition is increasingly perceived as a top-line headwind rather than a platform opportunity. Price at 225.35 sits below every major EMA, with the EMA200 at 319.62 representing a gap of nearly 95 points overhead, a level of structural damage that cannot be repaired through tactical bouncing. The Kalman filter speed of negative 2.223 confirms the selling pressure is not decelerating, and the BB %B at negative 0.10 indicates price is trading outside the lower Bollinger Band, reflecting distribution momentum rather than a mechanical washout. RSI at 29.2 is technically oversold, but inside a breakdown regime, oversold is a descriptor of damage severity, not an entry signal. The nearest Fibonacci support from the 120-bar range rests at the low of 224.13, essentially at current price. If that level fails, there is no structural floor until a longer-term lookback is applied. Until ADBE can reclaim the EMA20 at 243.67 with expanding volume, this remains a breakdown in progress rather than a bottoming process.
Current regime: Breakdown
Key decision zones: Support at 224.13 (120-bar Fibonacci low) / 220.00 (longer-term structural reference). Reclaim levels at 235.78 (Tenkan) / 243.67 (EMA20).
If not in the position: No entry under current conditions. Oversold RSI inside a confirmed breakdown with accelerating Kalman speed is not a contrarian setup; it is a warning to stay out.
Invalidation and thesis-failure rules: Any attempt to re-engage on the long side would require a confirmed reclaim of 243.67 (EMA20) on above-average volume; anything short of that represents structural resistance, not recovery.
Aixtron SE (AIXA.DE) Last close: 38.17
Setup: Aixtron is functioning as one of the cleaner trend-hold expressions within the European semiconductor equipment complex, a group that has been quietly garnering institutional interest as capital searches for AI-infrastructure exposure outside the crowded U.S. semiconductor trade. Price at 38.17 sits above the full EMA stack, with the EMA20 at 33.77 and EMA50 at 29.53, suggesting the trend has been building over a multi-month base rather than a recent parabolic extension. The Ichimoku cloud is below price in a confirmatory posture, and the MACD histogram is expanding in the bullish direction with a Kalman filter showing positive speed. The concern entering this week is the elevated BB %B at 1.07, indicating price is extended beyond the upper Bollinger Band, and the RSI at 68.7 is approaching levels where short-term exhaustion can temporarily interrupt uptrends. Williams %R at negative 1.4 reflects a nearly overbought condition. The Fibonacci structure from the 120-bar range shows the 120-bar high at 38.27, essentially at current price, making this a test of a significant structural ceiling. If AIXA.DE can close above 38.27 on expanded volume, the trend-extension thesis gains credibility. If not, a pullback toward the EMA20 zone at 33.77 would be a natural and healthy reset within the broader uptrend.
Current regime: Trend-hold
Key decision zones: Support at 34.57 (Tenkan) / 33.77 (EMA20). Reclaim levels at 38.27 (120-bar high, structural ceiling).
If not in the position: Trail risk below EMA20 at 33.77 for existing holders; new entries should wait for a confirmed breakout above 38.27 or a constructive pullback to the 34.57 to 33.77 zone with momentum reset.
Invalidation and thesis-failure rules: A close below EMA20 at 33.77 would signal the breakout attempt has failed and the trend structure is beginning to erode.
Applied Materials Inc. (AMAT) Last close: 399.49
Setup: Applied Materials is behaving like the institutional consensus expression of the semiconductor equipment cycle thesis, benefiting from the same capital flows that have driven LRCX and ASML higher as the AI-driven wafer fabrication investment cycle continues to attract front-end spending commitments. Price at 399.49 is above the full EMA stack with meaningful separation, and the Kalman filter speed of positive 8.712 is the highest in the semiconductor equipment group, confirming active and accelerating accumulation. The MACD histogram at 5.263 is expanding, ADX at 16.8 is beginning to trend higher with positive DI at 35.5, and MFI at 64.6 confirms money flow is supporting rather than distributing into price. The primary near-term risk is the proximity to the 120-bar high at 407.29, a ceiling that has contained prior advances and now sits approximately 7.8 points above the current close. At BB %B of 1.04 and RSI of 66.2, the setup is extended but not at a level that historically precedes immediate mean reversion in strong trend-hold names. If AMAT can clear 407.29 on volume, the next reference becomes open air above the prior cycle peak. If price fades from that level without follow-through, a retest of the EMA20 at 361.40 remains entirely consistent with the broader uptrend.
Current regime: Trend-hold
Key decision zones: Support at 363.99 (Tenkan) / 361.40 (EMA20). Reclaim levels at 407.29 (120-bar high) as the immediate structural ceiling.
If not in the position: Trail risk below EMA20 at 361.40 for existing holders; new entries at this extension require either a confirmed breakout above 407.29 or a constructive consolidation back toward the 363 to 361 zone.
Invalidation and thesis-failure rules: A daily close below EMA20 at 361.40 would represent a meaningful trend break and require reduction of exposure without hesitation.
Advanced Micro Devices Inc. (AMD) Last close: 245.04
Setup: AMD has emerged as the highest-beta beneficiary of the current AI chip demand narrative within the U.S. semiconductor complex, trading above its full EMA stack with the widest Bollinger Bandwidth in the group at 0.278 and a Kalman filter speed of positive 5.302 that reflects institutional velocity rather than retail-driven momentum. RSI at 70.1 and Williams %R at negative 8.0 indicate the name is technically overbought, and BB %B at 1.09 places price above the upper Bollinger Band, a position that in trending regimes often precedes brief consolidation rather than structural reversal. The EMA20 cluster at 215.83 and EMA50 at 212.39 are tightly coiled below price, providing a well-defined support zone for trailing risk management. The 38.2 percent Fibonacci retracement from the 120-bar range at 236.96 offers a nearer-term reference in the event of a pullback. Volume running at 1.06 times average is constructive without being excessive, consistent with measured accumulation. If AMD holds above the 236.96 Fibonacci level on any pullback, the trend-hold thesis remains intact and the extension toward prior highs near 267.08 becomes the operative scenario. If price breaks below 215.83, the structure would require a full re-evaluation.
