
What Google’s Earnings Volatility Actually Tells Us
Everyone Saw the Drop. Few Saw the Structure

In December, we laid out a structured plan for Google that required patience, confirmation, and respect for levels. That plan played out cleanly. Price broke above the defined breakout zone, advanced into our upside targets, and only then reversed following earnings.
That sequence matters.
It tells us two things at once. First, the original framework was sound. Second, earnings introduced a new volatility regime that resets the setup rather than invalidating it. This post is a continuation of that work, not a rewrite. We will reassess the business, what changed with earnings, and how the technical structure now looks across timeframes.
This is not about chasing strength or fading fear. It is about understanding where Google sits today, what the market is pricing, and what conditions would make the next trade attractive.
Key Takeaways
The December breakout plan worked. Price cleared resistance and reached target before reversing.
Earnings did not break the long-term trend, but they did increase volatility and compress risk tolerance.
Google’s core business remains strong, with advertising stabilizing and Cloud continuing to scale.
Margins are expanding, but AI investment intensity is rising and must be monitored.
Technically, the stock is correcting within an uptrend, not entering a bearish regime.
At current levels, patience is required. Better risk-reward exists either on pullbacks or on confirmed reclaims.
Business, Pipeline, and What Changed With Earnings
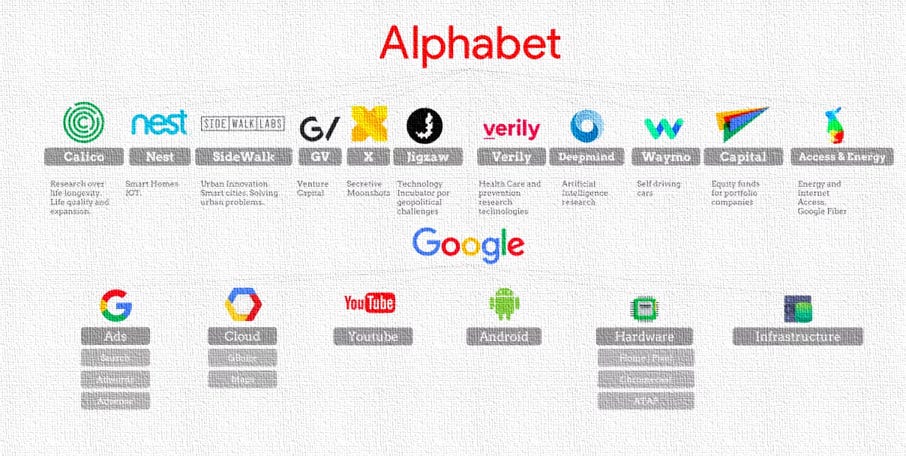
Alphabet Inc. operates a diversified digital ecosystem built around Search, YouTube, Network advertising, Google Cloud, and a portfolio of long-dated optionality through Other Bets.
Revenue composition and demand drivers
Advertising remains the core engine, representing roughly three-quarters of total revenue.
Search continues to benefit from intent-driven demand and pricing power.
YouTube advertising is recovering as brand budgets normalize and short-form monetization improves.
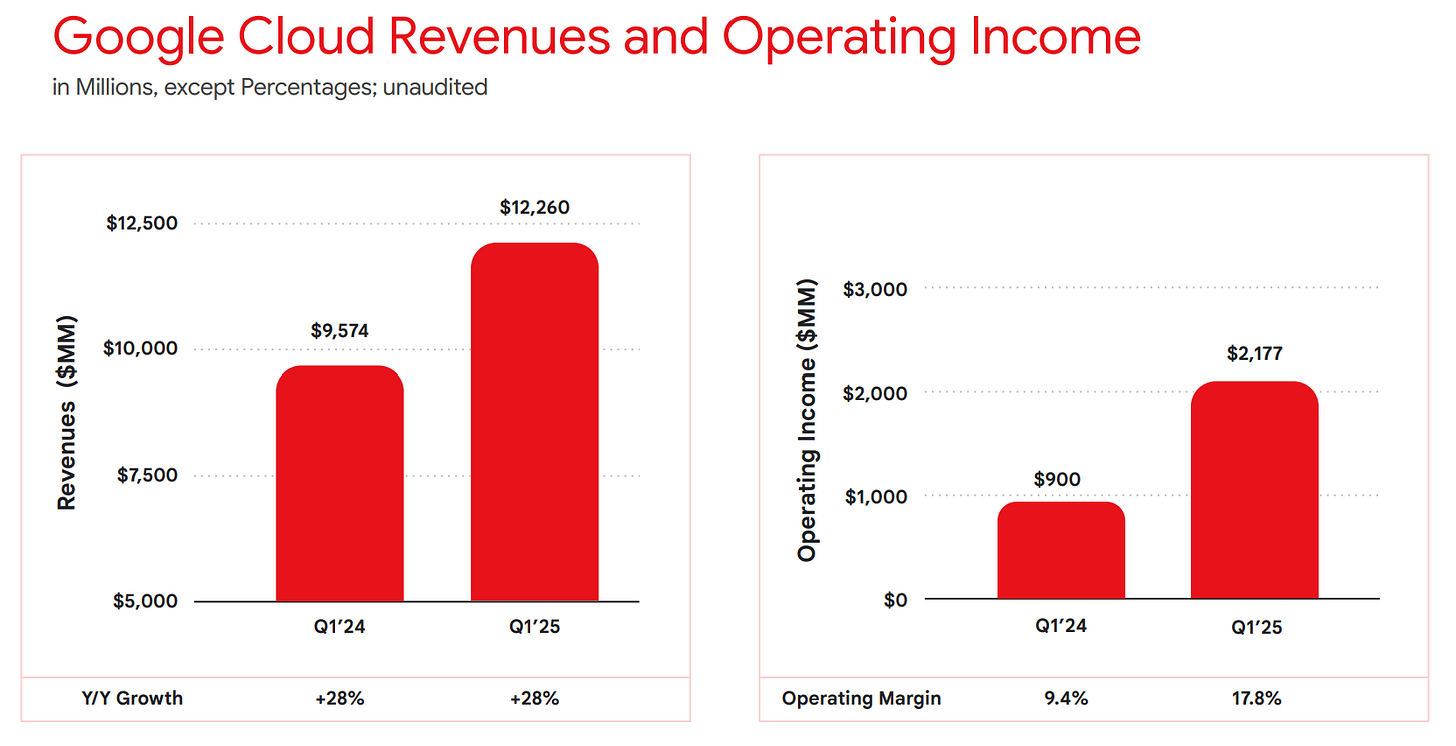
Google Cloud is now a material growth driver, with revenue growth consistently outpacing the company average.
Subscriptions, platforms, and devices provide incremental diversification and margin stability.

What the latest earnings told us
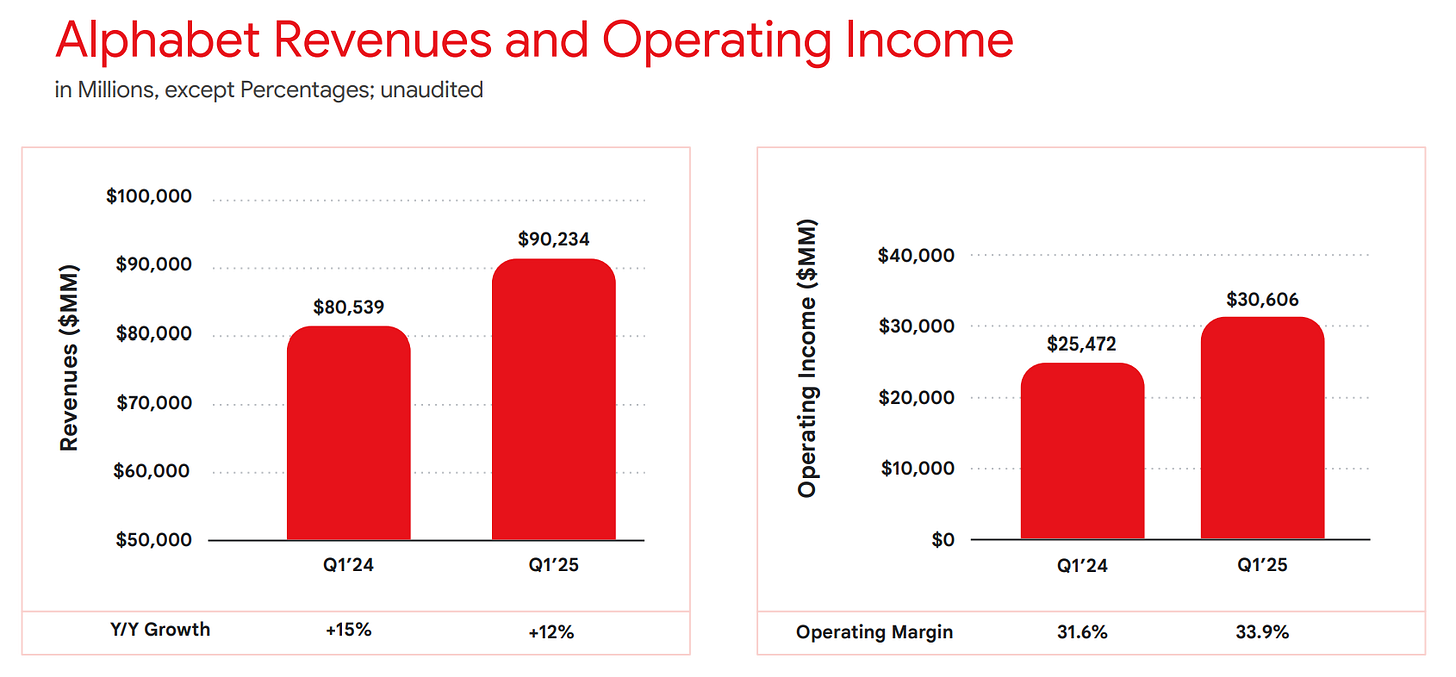
Consolidated revenue growth re-accelerated into the mid-teens year over year, driven by Search stability and Cloud strength.
Google Cloud grew at a high-20s to low-30s % rate, continuing its multi-year scaling trajectory.
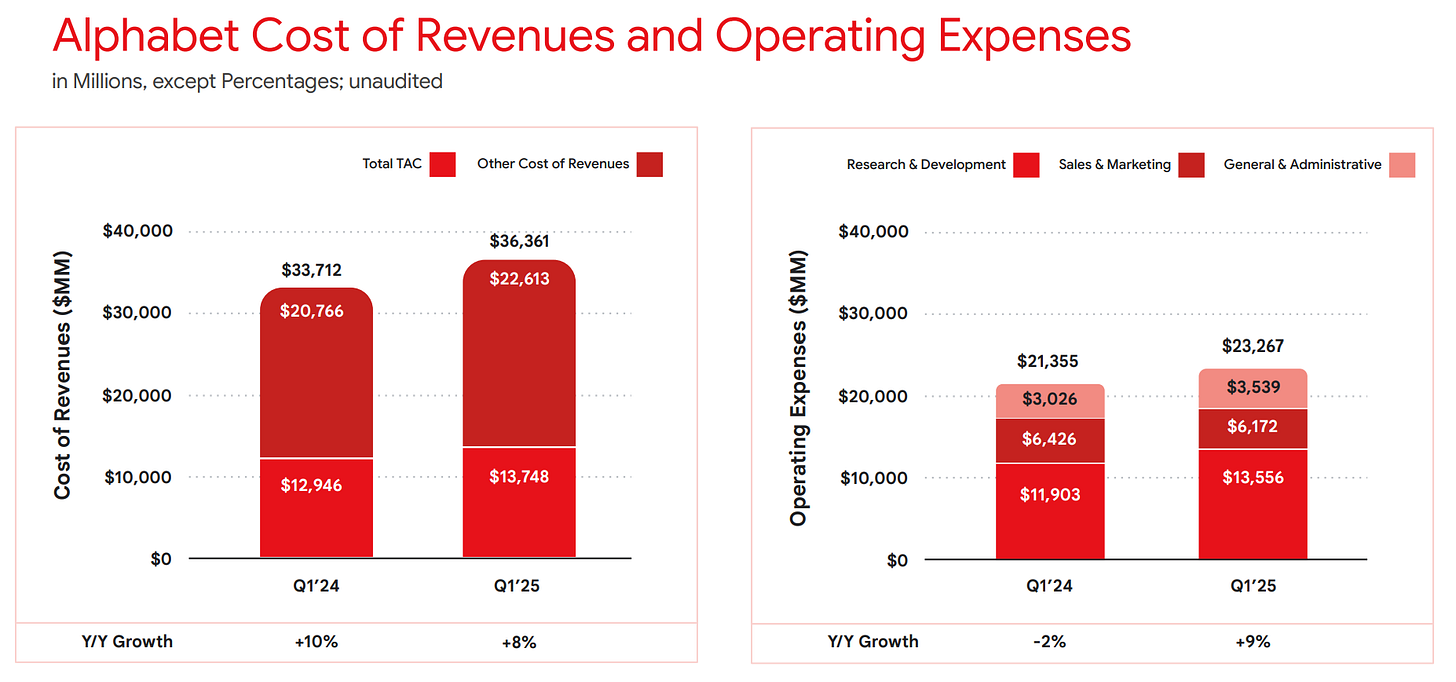
Operating margins expanded year over year, reflecting cost discipline and operating leverage.
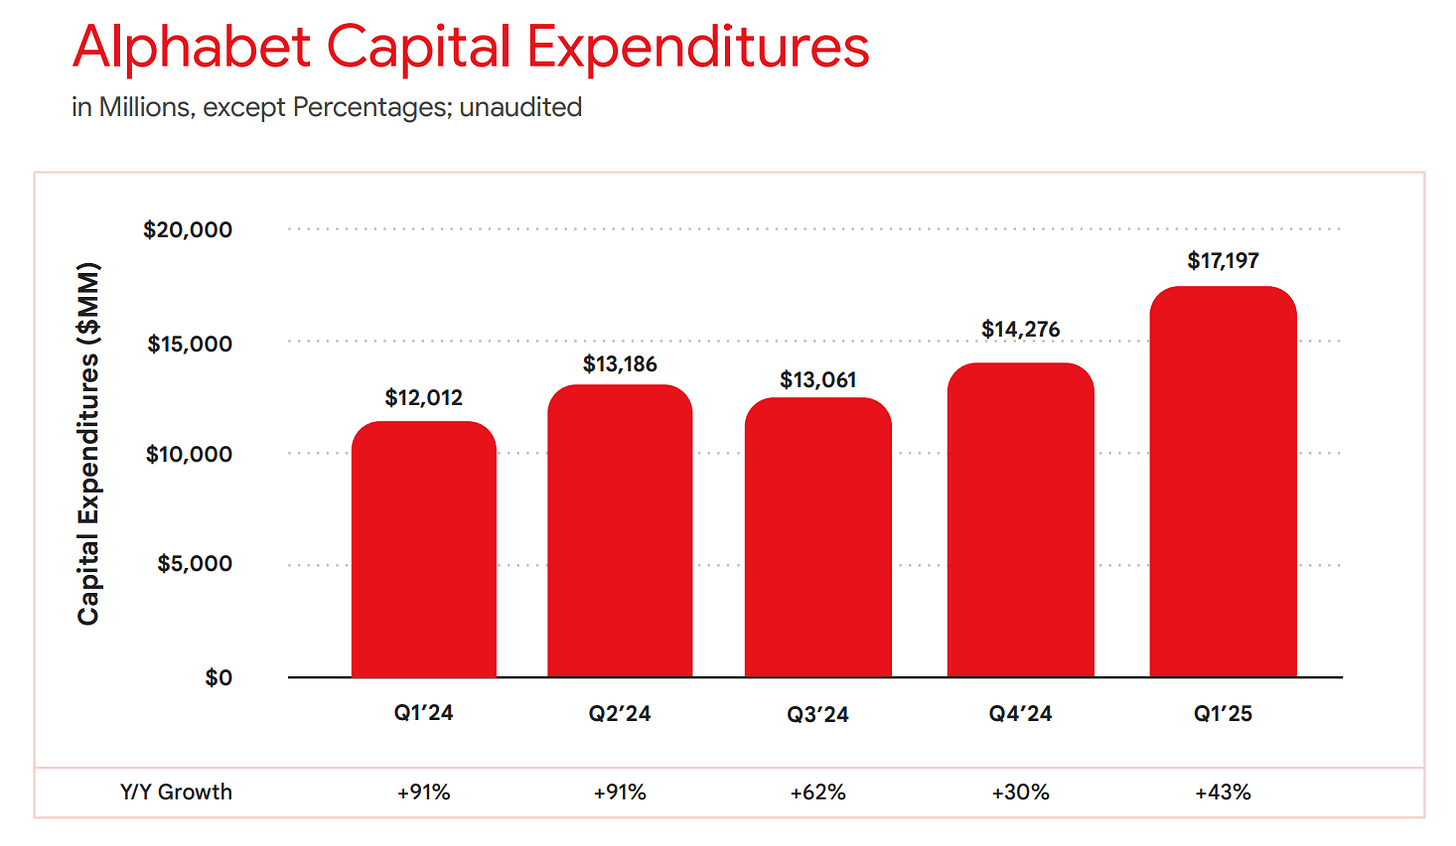
Capital expenditure guidance stepped higher, reflecting increased AI infrastructure investment.
The key change from earnings was not demand weakness. It was the market recalibrating how much near-term profitability it is willing to discount in exchange for long-term AI positioning.
Fundamental Analysis
Top line
Revenue growth in the mid-teens % confirms that Google remains a secular compounder rather than a mature, low-growth platform.
Search advertising growth stabilized after prior deceleration, alleviating fears of structural disruption.
Cloud revenue is now large enough that incremental growth meaningfully impacts consolidated results.

Margins and profitability
Operating margin expanded into the low-30s %, up several hundred basis points year over year.
Free cash flow margins remain robust despite elevated capital expenditures.
The company continues to convert a high % of operating income into free cash flow.

Balance sheet and capital return
Net cash position remains substantial, providing strategic flexibility.
Share repurchases continue to reduce share count, supporting per-share growth even in moderate revenue environments.
What changed expectations
Higher AI-related capex pushed out some margin expansion expectations.
Long-term earnings power remains intact, but the market is now more sensitive to execution cadence and return on investment timelines.
Google’s fundamentals remain strong and improving. Earnings did not weaken the business. They raised the bar for proof that AI investment can scale profitably without eroding the margin profile that makes this business so attractive.

Technical Analysis
Quick context reset
Our prior plan defined a breakout zone around 319.7 to 322.5. Price broke above that zone, held, and advanced into the mid- to high-330s before earnings triggered a sharp reversal. That sequence matters because it confirms the structure before the pullback.
Trend structure
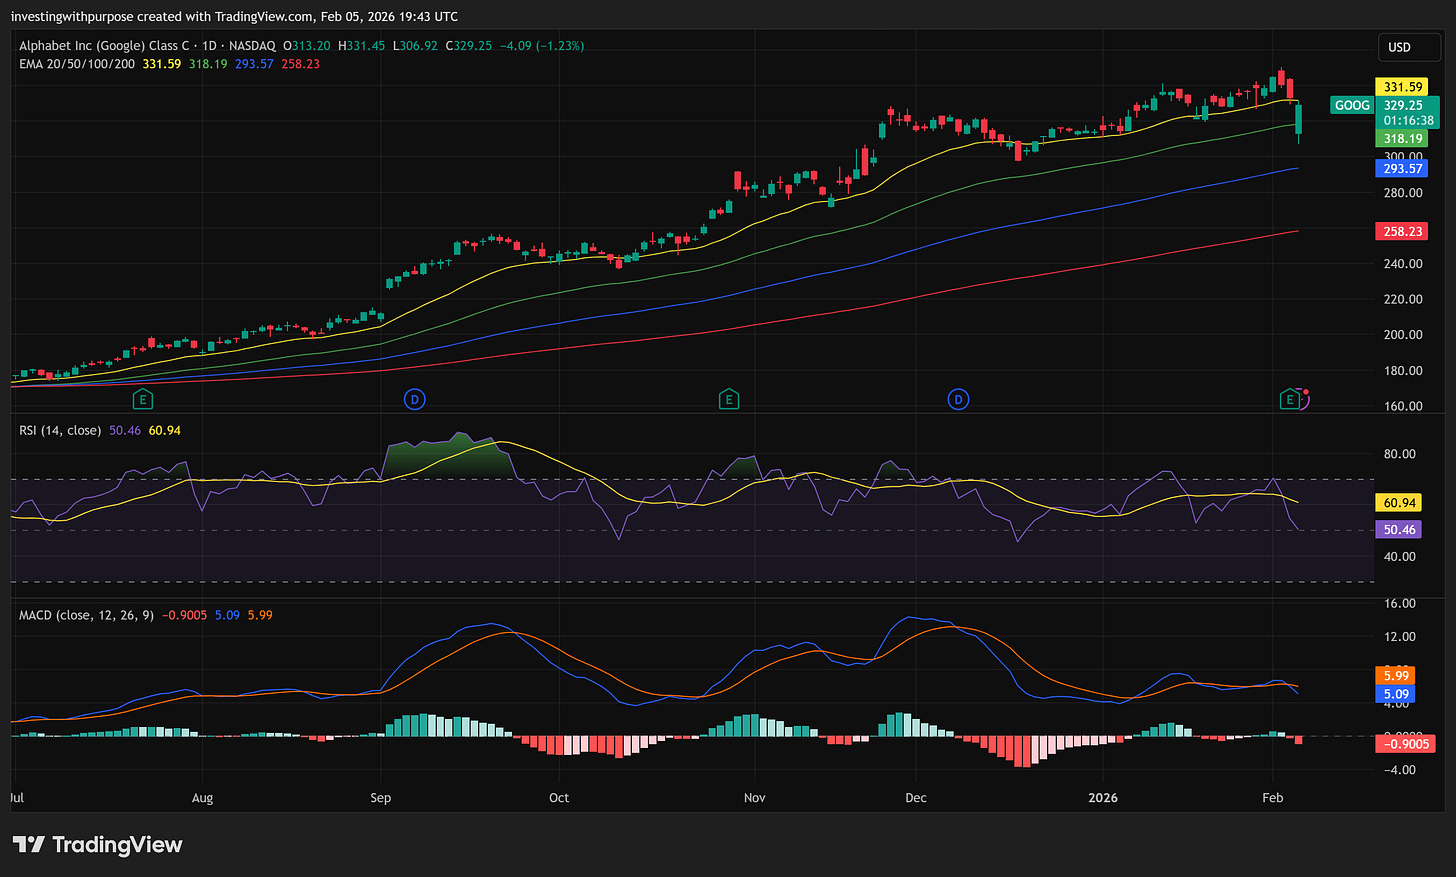
Long-term trend remains upward. Higher highs and higher lows are intact on the weekly timeframe.
Medium-term structure is consolidating after an impulsive advance.
Short-term structure is corrective, not impulsively bearish.
How the key levels were derived
The 319 to 322 area was prior multi-week resistance. Once reclaimed, it acted as support before earnings.
The 306 to 308 zone aligns with prior consolidation and Fibonacci retracement of the latest impulse leg.
The 295 to 300 region represents deeper demand where prior breakouts originated.
The 291 area is the structural invalidation, where the trend thesis breaks on a closing basis.
Momentum across timeframes
Short-term momentum was overextended into earnings and has since reset sharply.
Medium-term momentum is cooling but remains positive.
Long-term momentum remains constructive, consistent with a trend pause rather than reversal.

What the recent candles and volume say
The large post-earnings down candle reflects forced de-risking, not steady distribution.
The immediate rebound on high volume suggests responsive buyers defending structure.
Follow-through has been more measured, indicating a market that wants confirmation, not speed.
Google is digesting gains after a successful breakout and target hit. This is a correction within an uptrend. The question is not direction, but timing and risk control.
Our Trade Plan
This is a framework, not a forecast.
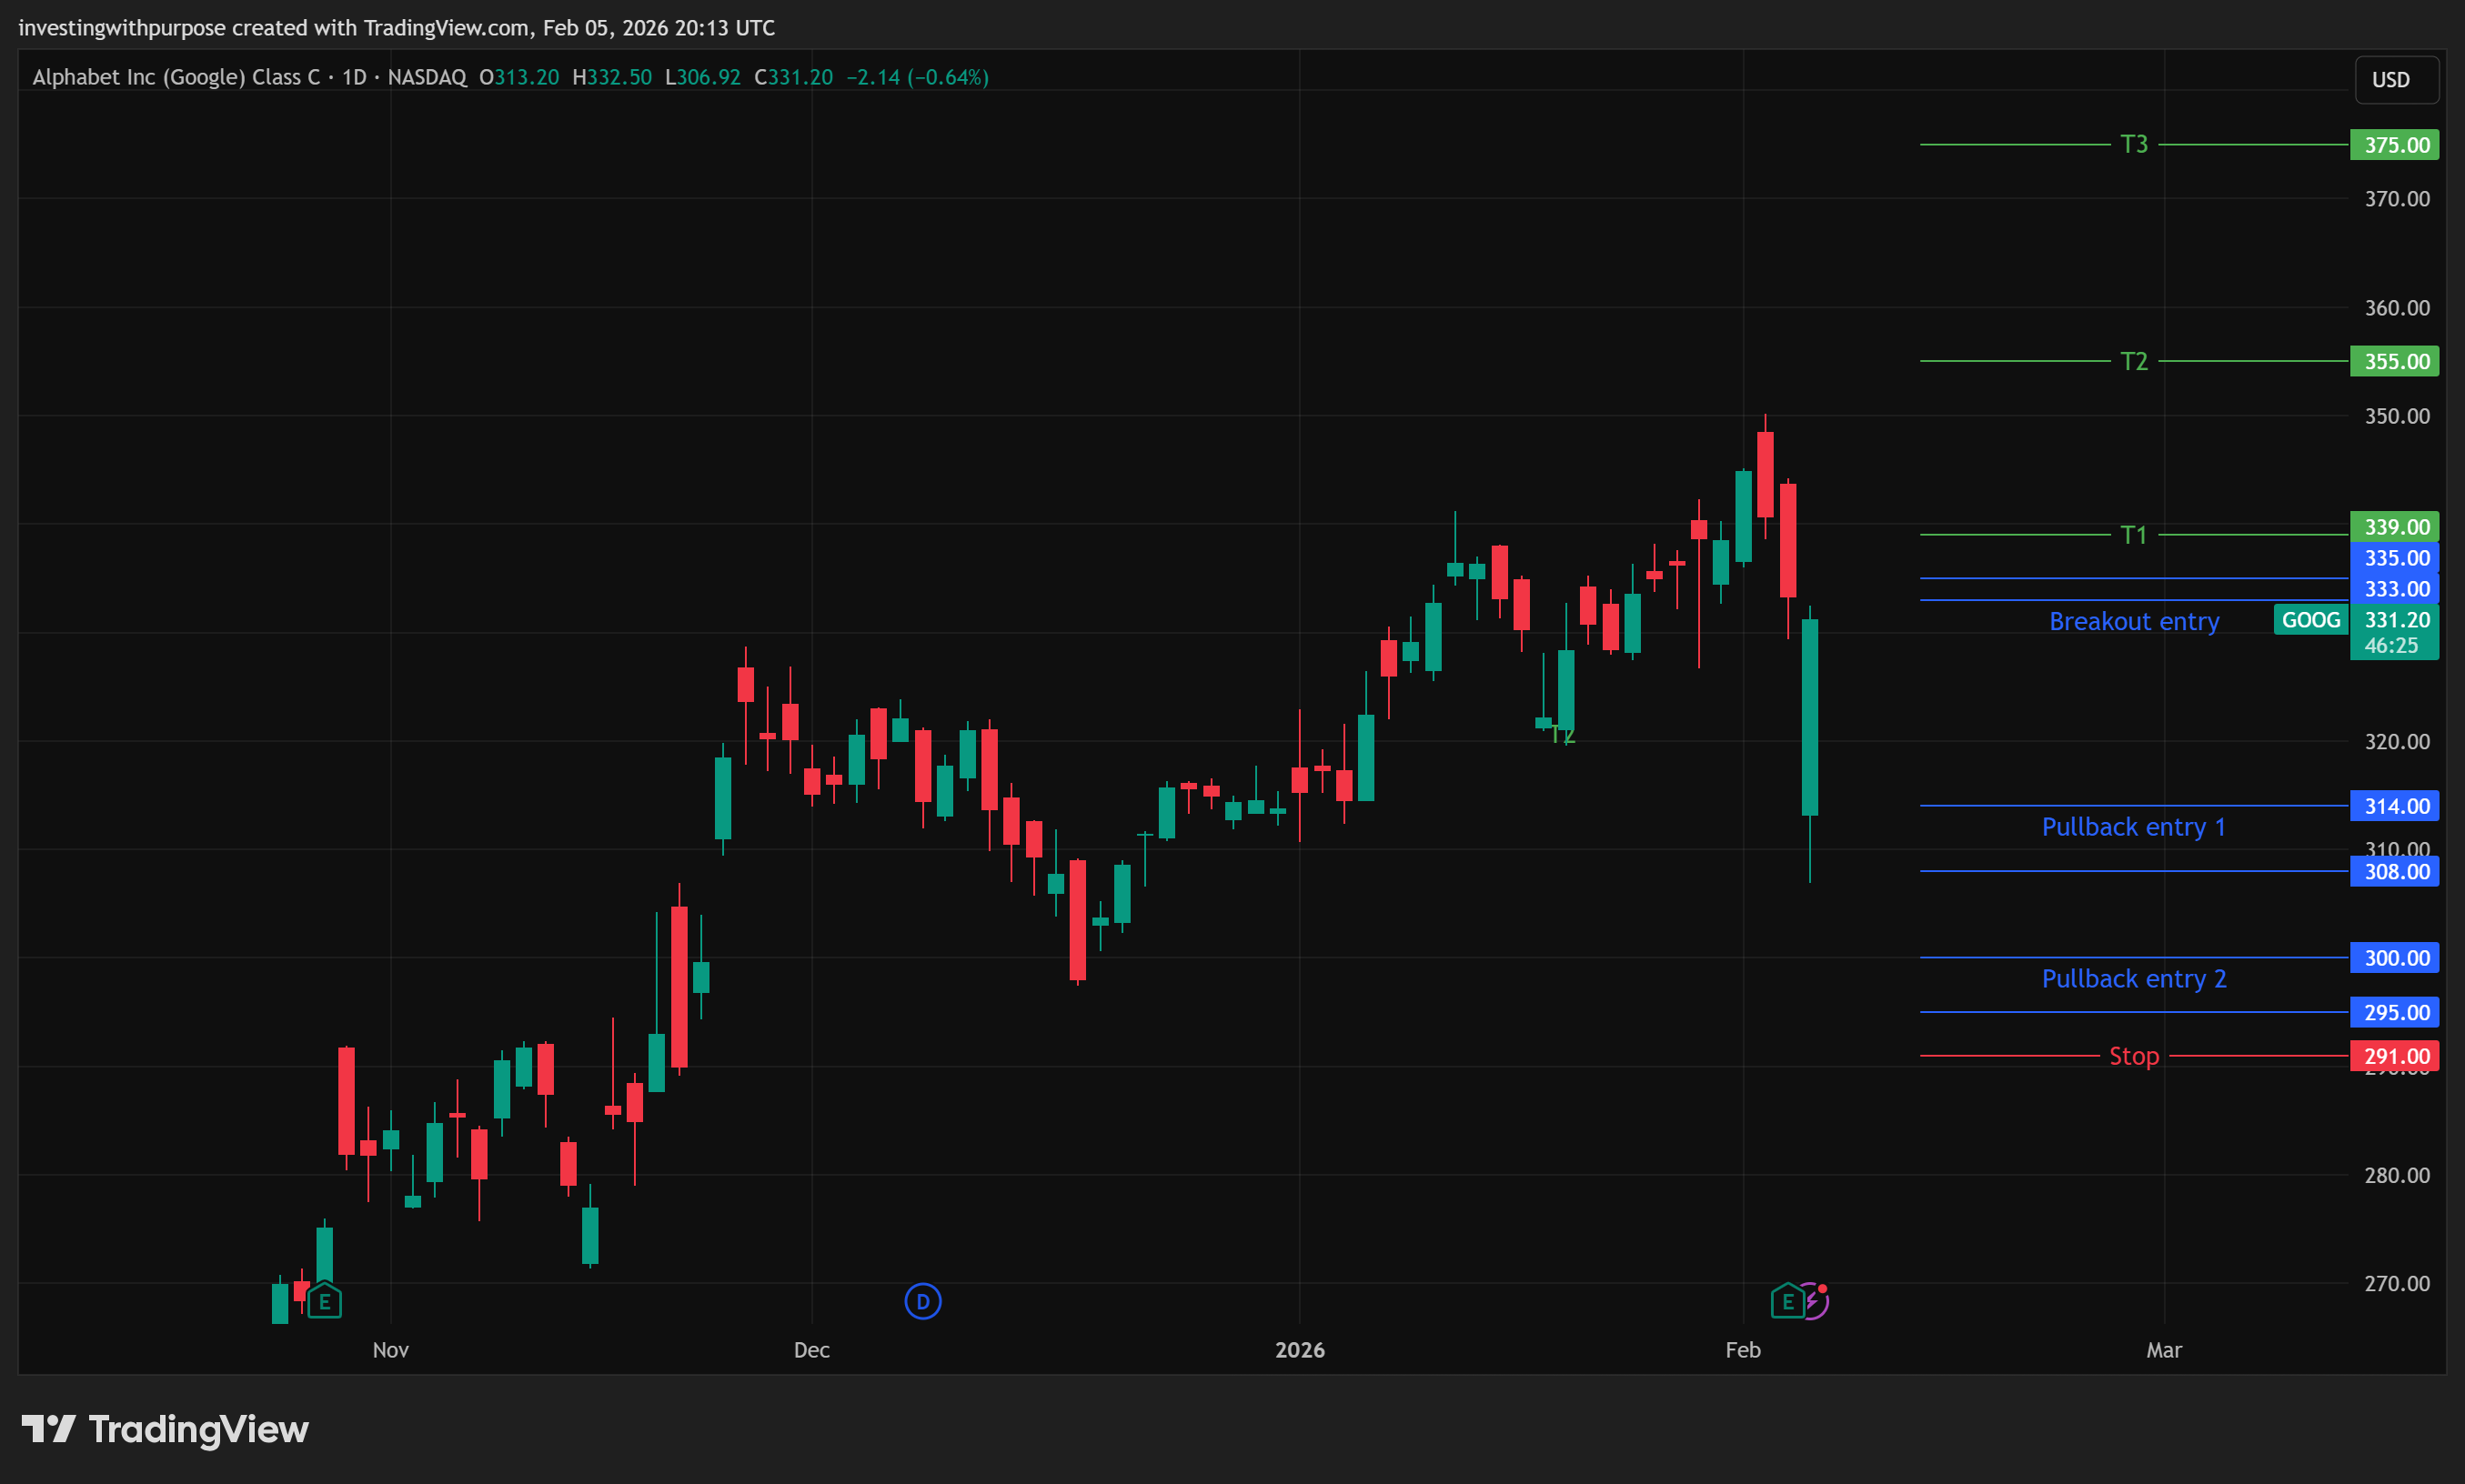
The 322–325 zone was the original breakout level identified in our December plan. That breakout triggered, held, and reached target before earnings introduced a sharp volatility reset.
At the current price around 330, that breakout has already played out. The 322–325 area now functions as structural support, not a fresh entry.
From here, there are two actionable paths:
Next breakout zone: A sustained reclaim and acceptance above 333–335 would signal that post-earnings consolidation is complete and open the door to renewed upside momentum.
Pullback zone: A controlled pullback into the 314–308 region offers a more attractive risk-reward setup, where former structure and retracement levels align.
Until one of those conditions is met, price is in a transition zone where risk is harder to define. The trend remains intact, but patience is required.
Invalidation: Sustained close below 291
This breaks the higher-low structure and invalidates the bullish thesis.
Targets
Short-term: 338 to 340 Prior highs and initial resistance on a rebound.
Medium-term: mid-350s Extension of the prior impulse leg.
Long-term: high-370s and above. Requires renewed momentum and supportive macro conditions.
Quick note: please read the full analysis for context.
The trade plan screenshot shows levels, not the full thesis.
Strategy, confirmations, market structure, and invalidation matter just as much.
Jumping straight to levels without that context misses the framework entirely.
Rolling stop logic
After reclaiming 322, stops trail below 315.
After clearing prior highs, stops trail below the most recent higher low.
Structure, not emotion, determines stop placement.
Risk-based position sizing
Wider stop means smaller size.
Tighter stop means smaller expectations.
No single trade should materially impact portfolio health.
Bottom Line
The December plan worked. The breakout triggered, the target was reached, and earnings introduced a new phase.
Today, Google is not a chase. It is a stock that demands patience and respect for levels. The long-term trend remains intact, fundamentals are solid, and the business continues to compound. But the next attractive entry requires either a cleaner pullback or a confirmed reclaim.
Risk is defined. Reward remains compelling. The most important line in the sand is 291.
Above it, this is consolidation. Below it, the story changes.
For now, discipline beats urgency.
This analysis is for educational and informational purposes only and reflects personal opinions based on publicly available information. It is not investment advice, a recommendation, or an offer to buy or sell any security.