
Why Shopify’s Momentum Is Just Getting Started
The Engine of Modern Retail: Shopify’s Structural Advantage

Shopify SHOP 0.00%↑ just delivered another strong earnings report. Revenue is growing at scale. Free cash flow is real. The balance sheet is clean.
And yet the stock broke.
That tension is exactly where opportunity and risk coexist. When a fundamentally strong company resets technically, investors are forced to decide whether the move is a temporary repricing or the start of a deeper unwind.
This is not about whether Shopify is a good business. It is.
This is about whether the stock is actionable here.
Let’s break it down calmly and precisely.

Key Takeaways
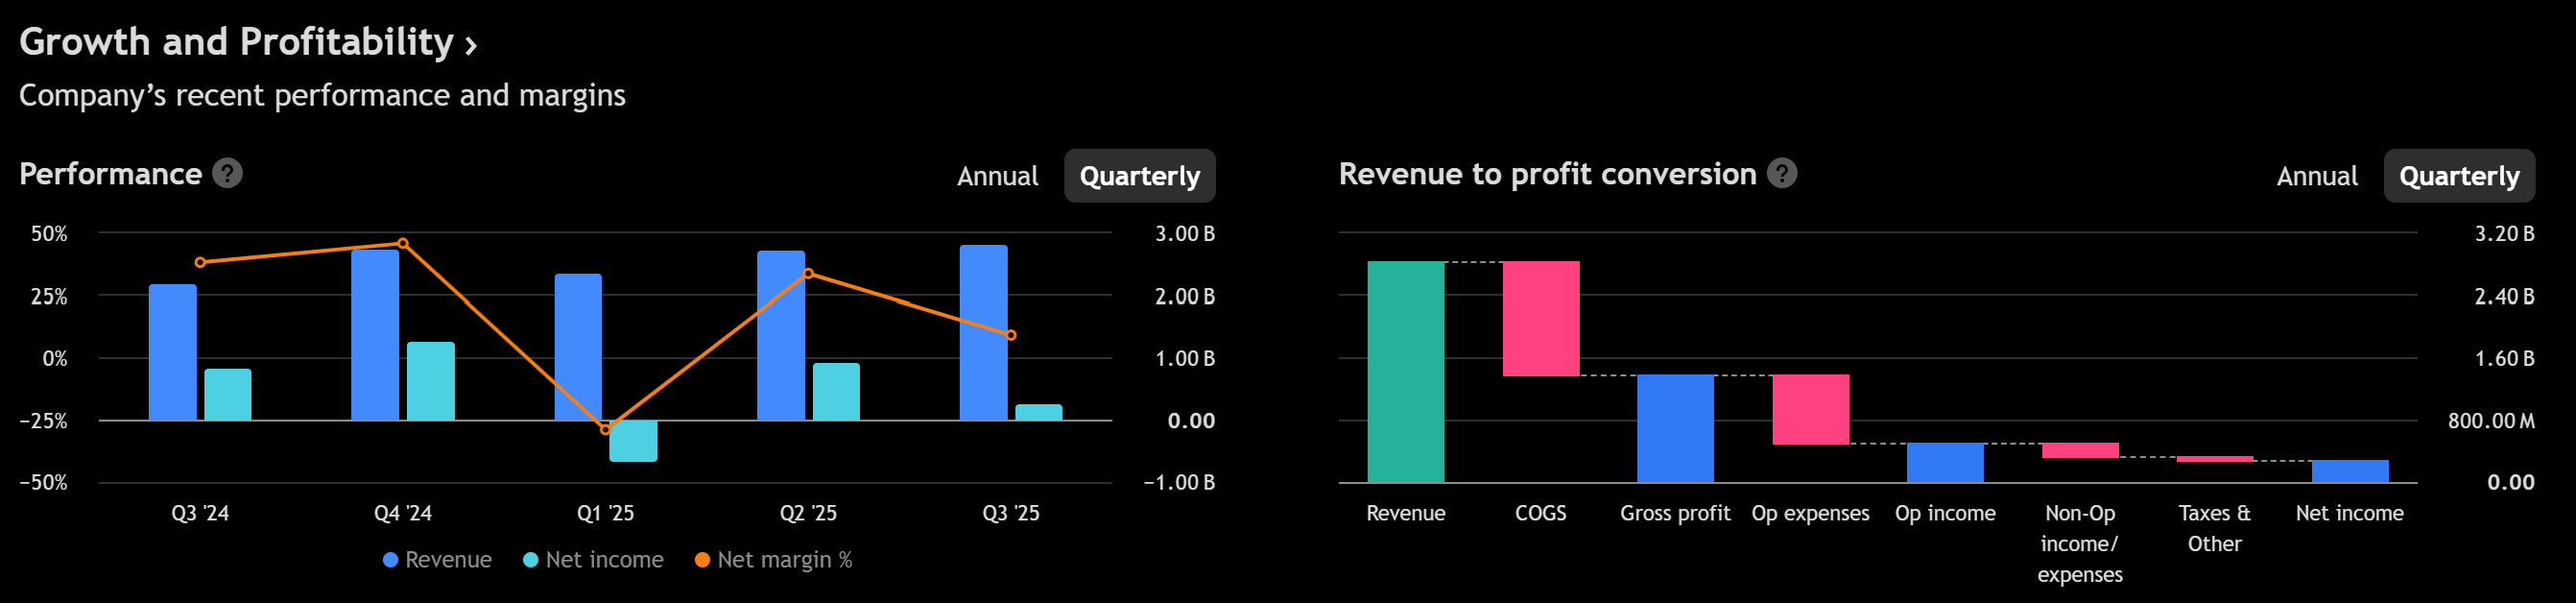
Revenue grew 31% YoY in Q4 to $3.67B, with GMV also up 31%.
FY revenue reached $11.56B with 17% free cash flow margin.
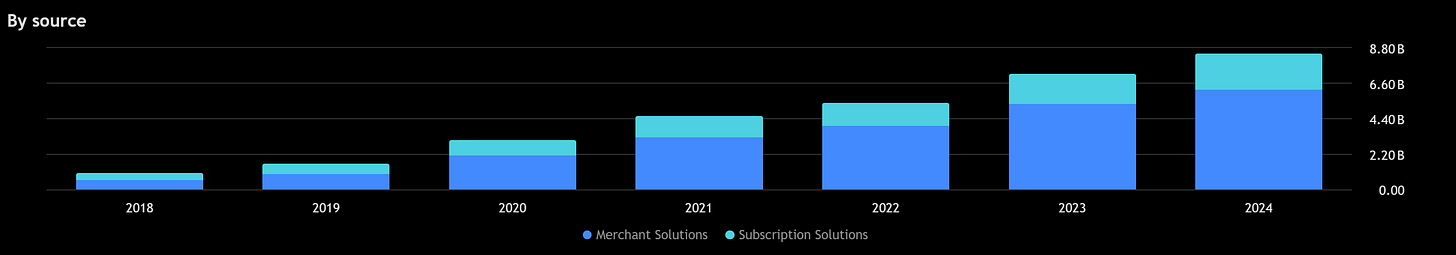
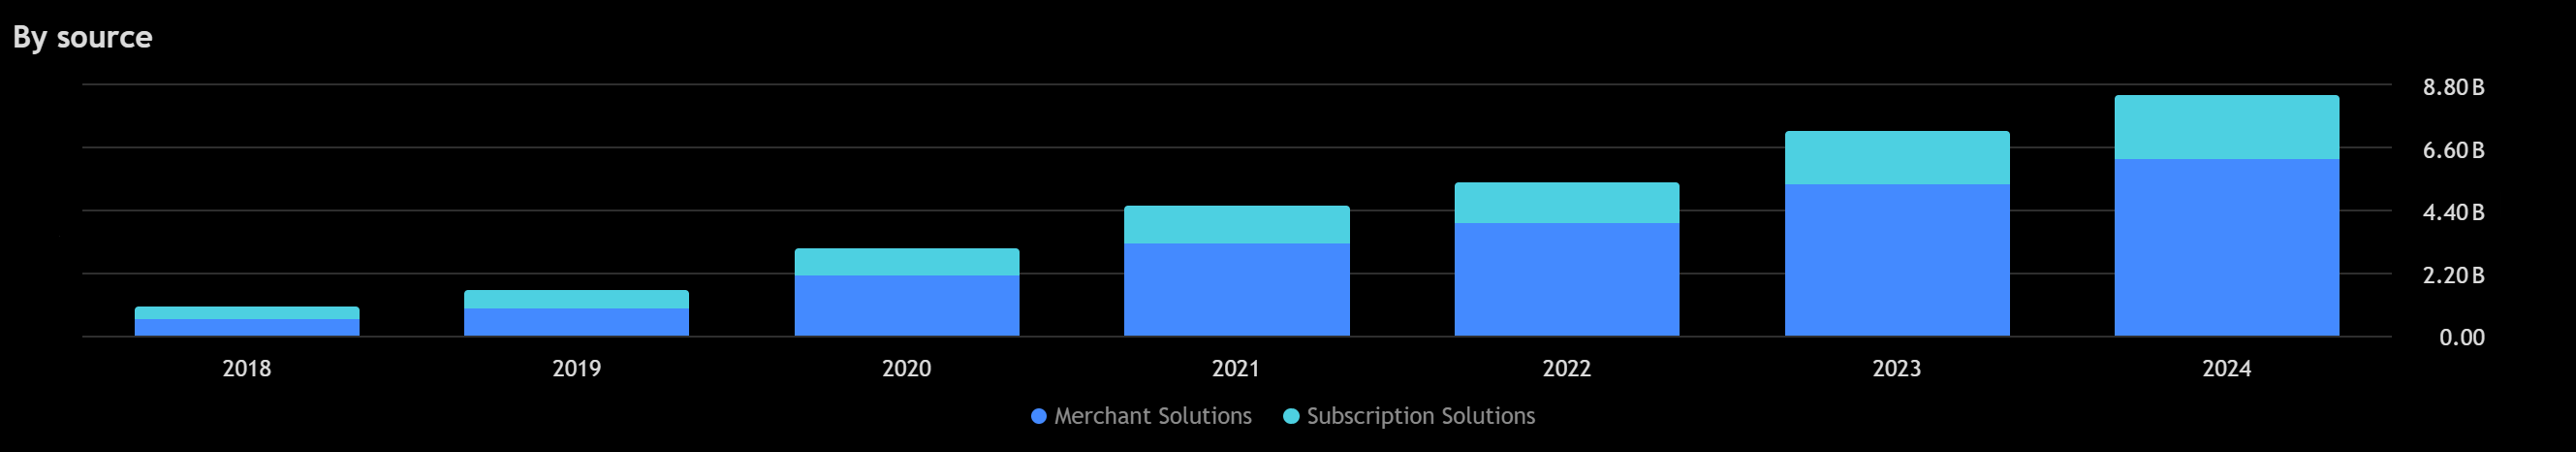
Revenue mix continues shifting toward Merchant Solutions, which compresses gross margin optics but strengthens ecosystem stickiness.
The stock broke below key daily structure and is now in a repair phase.
120.9 is the first pivot. 136 is the real repair line.
113 to 108 is the key support band. Below that opens 100 to 98.
The stock is actionable, but only with disciplined entries and defined risk.
Business and Latest Earnings
Shopify continues to scale its commerce ecosystem at an impressive pace.
Q4 revenue came in at $3.67B, up 31% YoY. Gross Merchandise Volume reached $123.8B, also up 31%. That symmetry matters. It shows demand strength and stable monetization.
For the full year:
Revenue: $11.56B, up 30% YoY
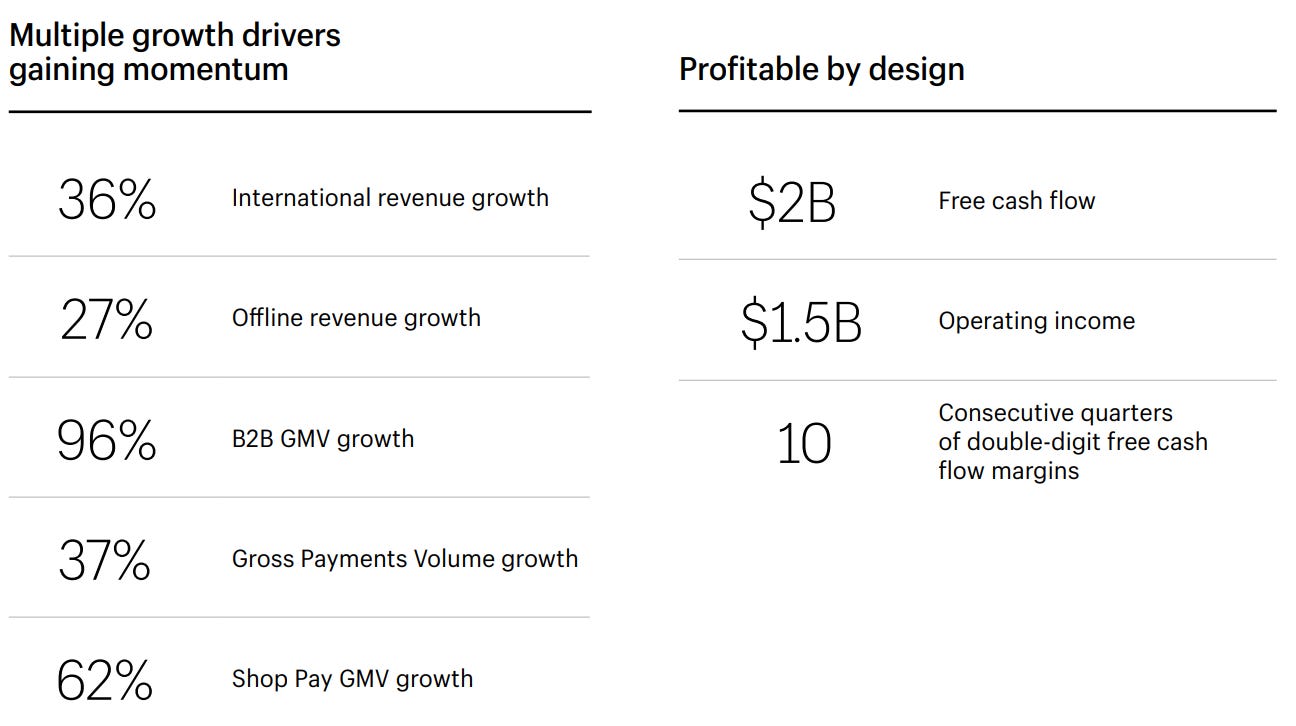
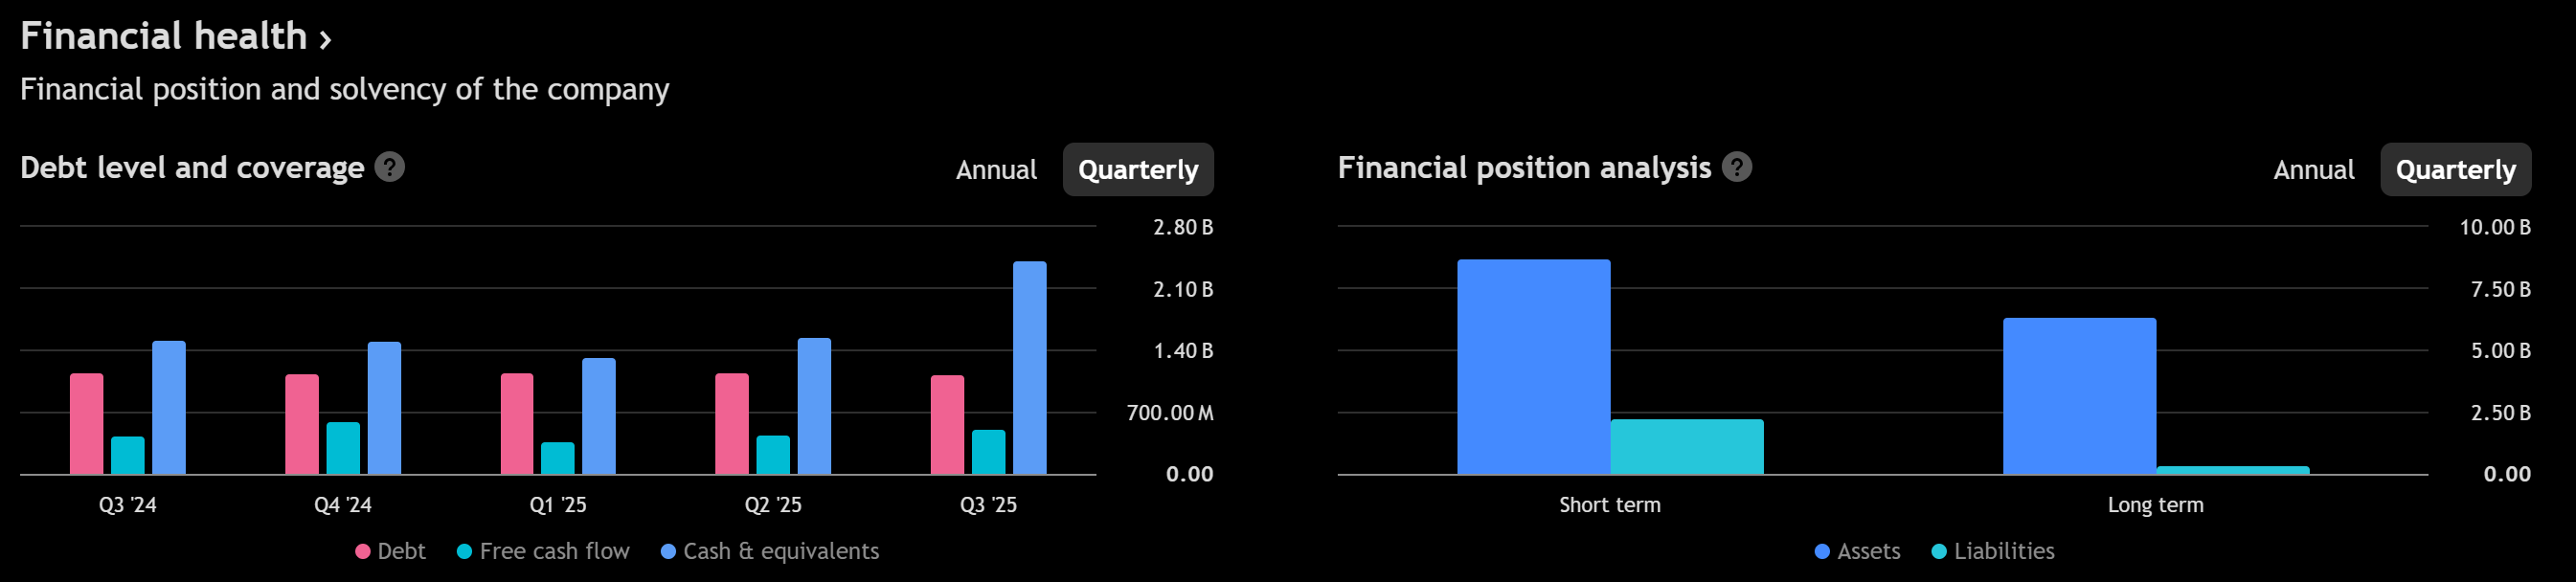
Free cash flow: $2.01B
Free cash flow margin: 17%

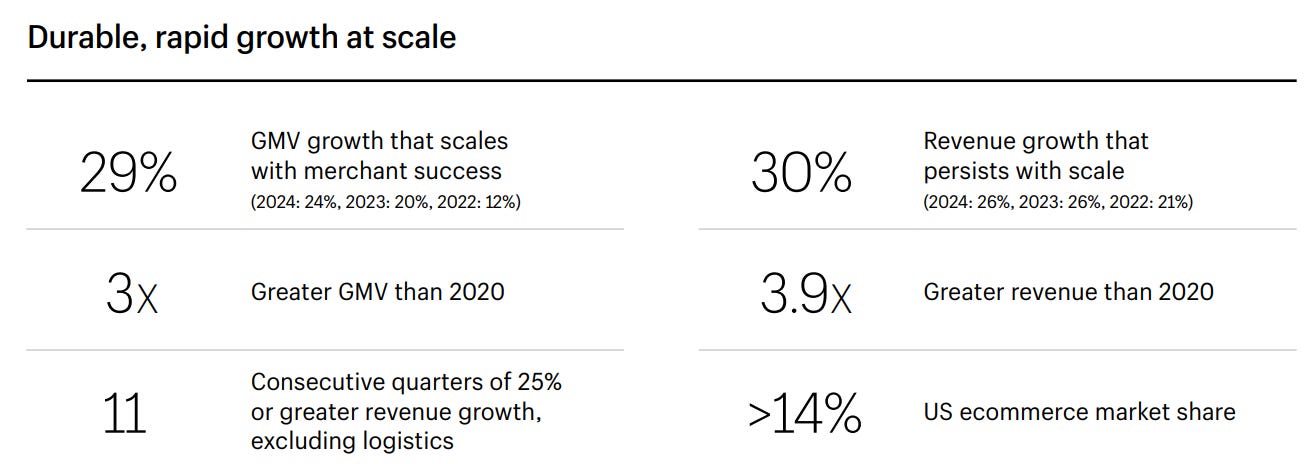
Merchant Solutions now accounts for roughly 75% of total revenue. Subscription Solutions represents about 25%.
This mix shift is important. Merchant Solutions scales with payment volume and GMV. It strengthens the ecosystem and increases retention. However, it carries lower gross margins than subscription revenue.
So even as the business strengthens, consolidated gross margin can appear to drift lower. That optical pressure often leads to short-term valuation resets.
Management guided for low-30% revenue growth next quarter and gross profit growth in the high-20% range. Operating expenses are expected around 37% to 38% of revenue, with free cash flow margin in the low-to-mid teens.
Translation: growth remains strong, but reinvestment is increasing.
The business is not slowing. Expectations are being recalibrated.
Fundamental Analysis
Shopify today is a high-growth, cash-generative platform with structural advantages.
Key numbers and what they imply:
Revenue growth: 30%+ sustained This is not early-stage growth. It is scaled growth above $10B revenue.
GMV growth: 31% Confirms healthy merchant demand and ecosystem strength.
Free cash flow margin: 17% Real cash generation at scale. This is not growth without profitability.
Cash and short-term investments: over $5.8B Net cash position. Strategic flexibility is strong.
Capex minimal relative to operating cash flow This is an asset-light model with operating leverage potential.

Stock-based compensation sits near 4% of revenue. That is manageable, especially with a $2B buyback authorization in place.
The fundamental question is not survival or demand. It is margin trajectory and duration assumptions. When a stock trades as a long-duration compounder, even small shifts in margin guidance can trigger sharp repricing.
Fundamentally, nothing in this quarter breaks the thesis. But valuation sensitivity explains the technical damage.
The business remains strong and scalable. Expectations have reset, not collapsed.
Technical Analysis
Now we shift from narrative to structure.
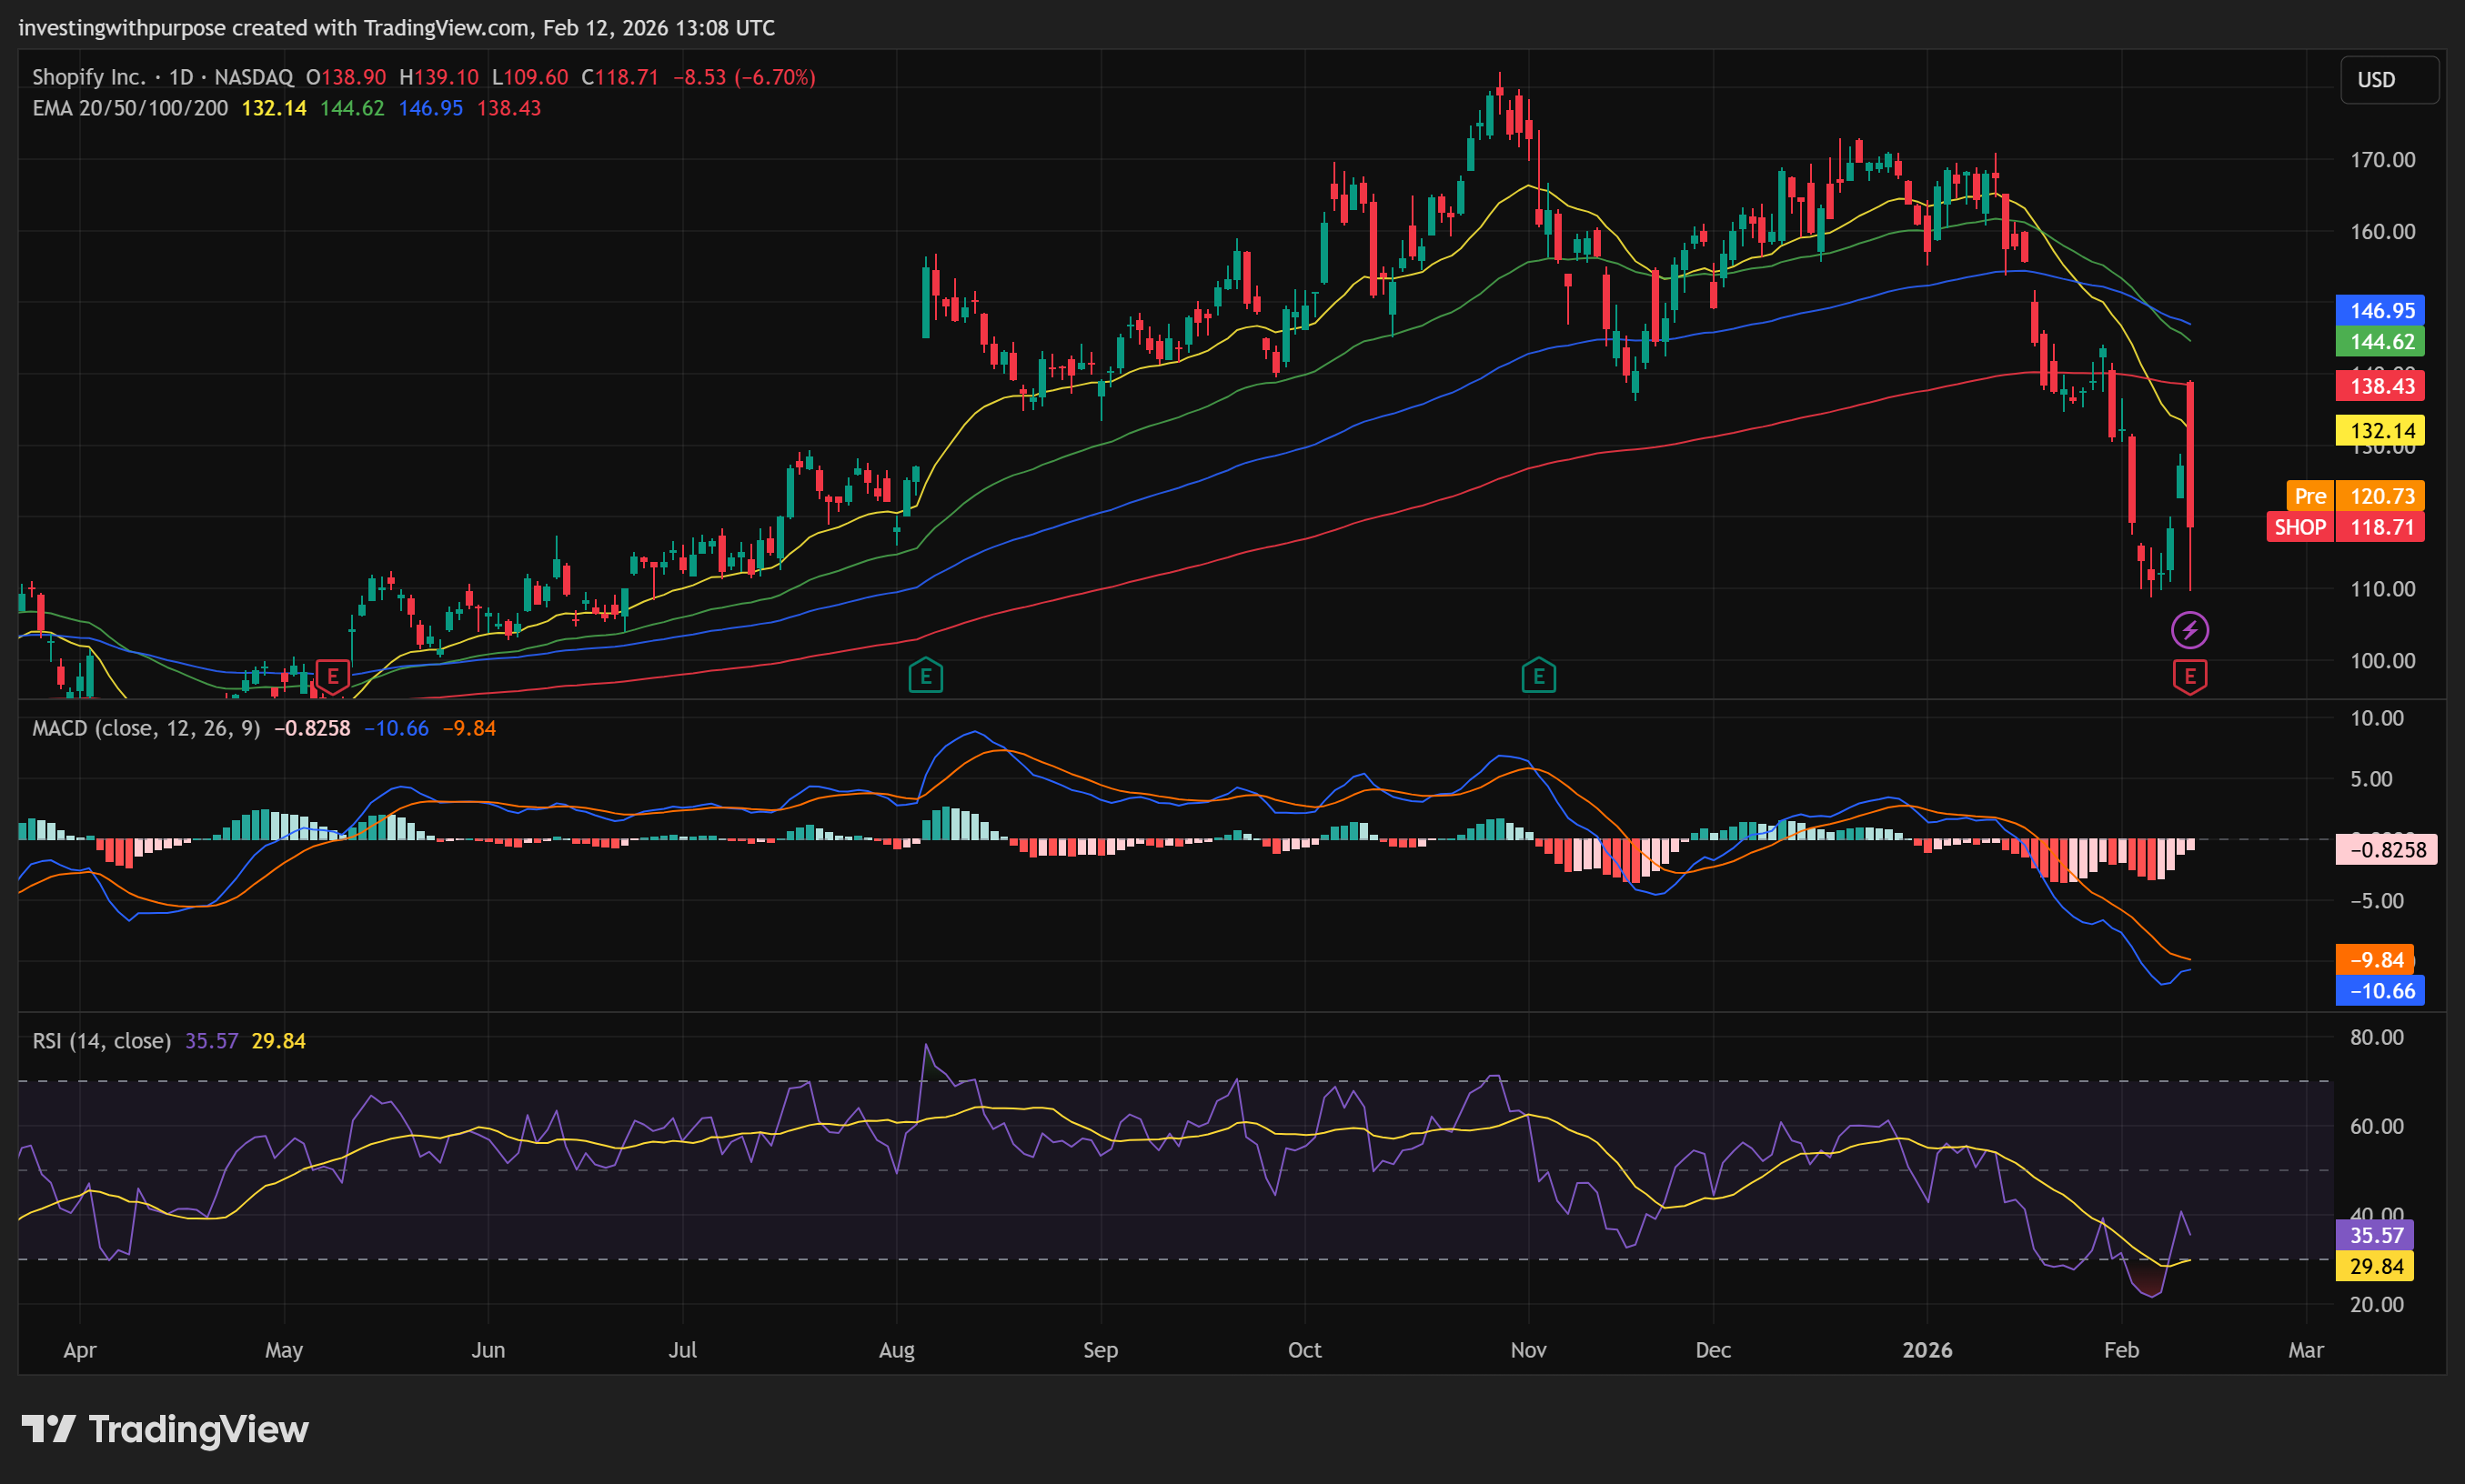
The weekly trend remains intact for now. Price is still above the weekly EMA200 near 97 and close to the weekly EMA100 around 115. That places Shopify in a medium-term correction inside a longer-term uptrend.
However, the daily structure is clearly damaged.
Price broke below the daily EMA cluster and accelerated lower on high volume. That is not noise. That is a structural break.
Key levels were derived from prior swing highs and lows and Fibonacci retracements from the recent advance.
The levels that matter:
113.4: 1.618 extension support from the recent decline
120.9: key pivot and 1.414 retracement
126.2: first reclaim shelf
136.2: breakdown origin and major repair line
100 to 98: major weekly support zone
Why 120.9 matters: it is the midpoint decision area. Acceptance above this level suggests stabilization. Rejection below it keeps the stock in repair mode.
Why 136 matters: this is where the breakdown began. A reclaim above 136 on a daily close would signal that supply has been absorbed and trend repair is underway.
Momentum context: Short term momentum is attempting to bounce from oversold conditions. That is typical after a volatility shock.
Medium term momentum remains bearish. Moving averages are sloping downward and trend strength expanded during the decline.
Long term momentum remains constructive above 100.
An Elliott Wave framework suggests the stock may be completing an ABC correction from the 180 high. If the recent low holds, the correction may be mature. If 108 breaks decisively, the next structural destination aligns near 98 to 100. Elliott scenarios are frameworks, not certainties. The levels decide.
The stock is in repair. 120.9 is the pivot. 136 is trend repair. 108 is the line in the sand.
Our Trade Plan
Simple. Structured. Risk-adjusted.
