

Why the Nasdaq 100 Got Hit So Much Harder Than the S&P 500
Same rate shock, different damage. Here’s what Friday revealed about growth, concentration, and risk.

SPY tracks the S&P 500. QQQ tracks the Nasdaq 100. Friday showed why those aren’t the same trade.
Same news, same market, almost twice the drawdown. That’s not noise, it’s index design.
Friday wasn’t just a selloff. It was a reminder of what investors actually own. A hotter-than-expected May jobs report sent Treasury yields higher, revived rate-hike fears, and hit stocks hard, but the damage wasn’t spread evenly. The S&P 500 fell about 2.6%. The Nasdaq 100 fell nearly 5%. SPY and QQQ, the tradable ETFs that track those indexes, showed it in real time.

This is really a lesson in the difference between the S&P 500 and the Nasdaq 100, the broad market and its growth engine, which don’t behave the same way when rates move. Here’s what each index is, why they split apart on days like Friday, and how to think about owning them now.
Key Takeaways
The Nasdaq 100 is roughly 100 of the largest non-financial companies, heavily tilted to technology, with about half the index in its 10 biggest names. The S&P 500 spans around 500 companies across all 11 sectors. SPY and QQQ are the ETFs that track them.
That concentration is a feature in rallies and a flaw in selloffs. On Friday the Nasdaq 100 fell nearly twice as much as the S&P 500, a clean live example of the trade-off.
The trigger was rates, not earnings. May payrolls came in at 172,000 against 80,000 expected, the odds of a rate hike by year-end jumped to about 73%, and the 10-year yield pushed above 4.5%.
You pay up for the Nasdaq 100’s growth. It trades around 32 times forward earnings against roughly 22 for the S&P 500, a premium that magnifies both the upside and the drawdowns.
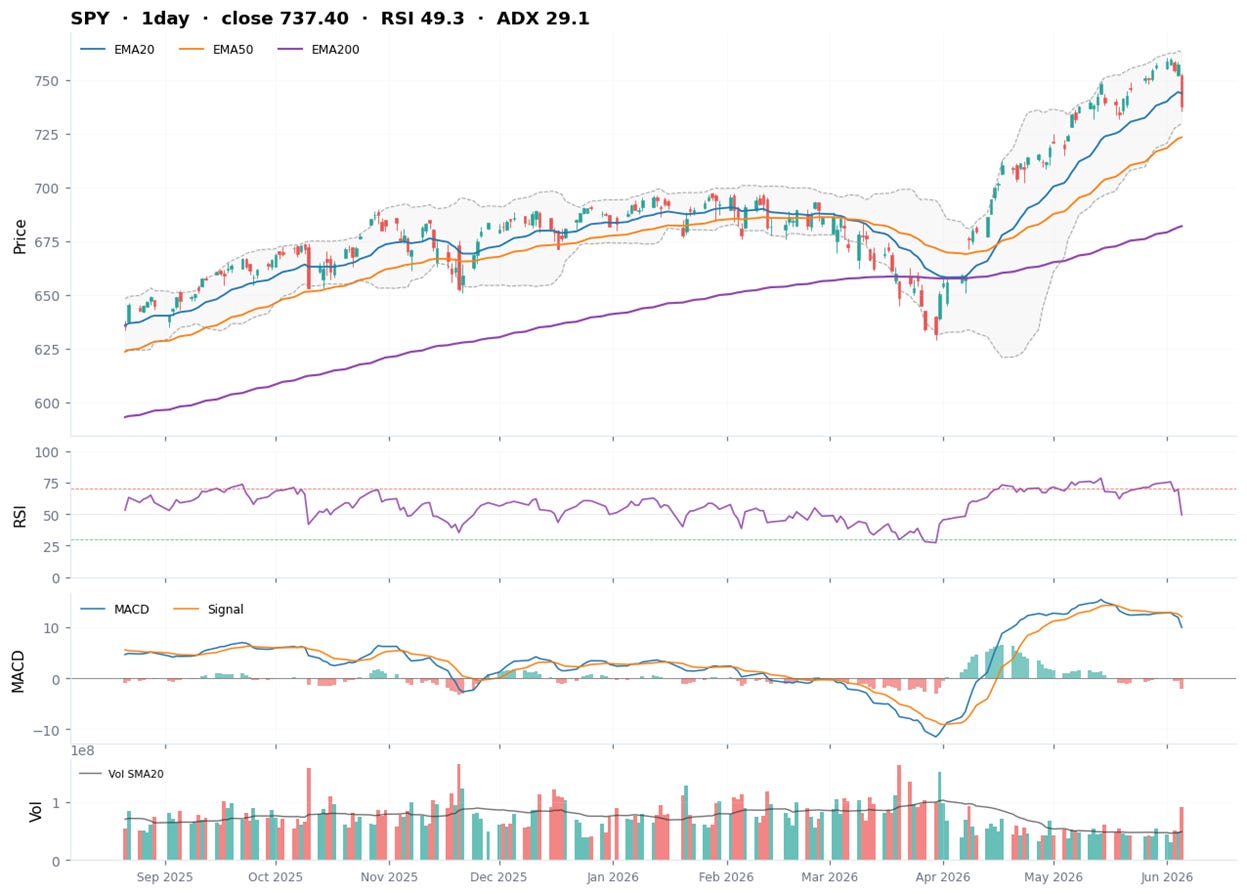
Neither broke. Both slipped below their 20-day lines but held well above the levels that would signal real damage. In ETF terms, SPY’s first support sits near $723, QQQ’s near $683.
Start with what each index actually holds.
What Each Index Actually Is
The Nasdaq 100, tracked by QQQ, holds around 100 of the largest non-financial companies listed on the Nasdaq. It is heavily tilted toward technology, communication services, and consumer growth companies. Because the index is concentrated, its largest holdings have a big influence on daily performance.
The S&P 500, tracked by SPY, holds about 500 large US companies across all 11 market sectors. Technology is still the largest sector, but the index also includes financials, healthcare, industrials, energy, staples, and other areas of the economy. That broader mix usually makes it more diversified than the Nasdaq 100.
SPY gives you broader US market exposure. QQQ gives you a more concentrated growth and technology tilt.
Why They Move Differently
The gap comes down to concentration, valuation, and sensitivity to rates.
The Nasdaq 100 is more concentrated in megacap growth and technology companies. When those names sell off, the whole index feels it quickly. The S&P 500 owns many of the same leaders, but it also has more exposure to financials, healthcare, industrials, energy, staples, and other sectors that can help soften the move.
Rates matter too. Growth companies are valued heavily on profits expected years into the future. When bond yields rise, those future profits become less valuable today, which usually pressures the Nasdaq 100 more than the broader S&P 500.
That extra sensitivity cuts both ways. In strong markets, the Nasdaq 100 can lead. In rate scares or growth selloffs, it can fall harder. That is the trade-off: more growth exposure, more upside potential, but also more volatility.
What Just Happened, and Why It Hit Growth Harder
Friday’s selloff was a rate story wearing an equity costume. The May jobs report showed 172,000 new positions against the 80,000 economists expected, strong enough to push the Federal Reserve away from cuts and toward the possibility of another hike. The market repriced fast: the probability of higher rates by year-end jumped to about 73% from roughly 51% a day earlier, the 10-year Treasury yield climbed above 4.5%, and the 30-year pushed up to 5%. The VIX, the market’s fear gauge, spiked about 40% into the low 20s.
Higher rates are kryptonite for long-duration growth, so the damage concentrated where the valuations are richest. Chip stocks led the decline, already shaky after Broadcom declined to raise its long-term AI forecast earlier in the week, and the Nasdaq 100 posted its worst day since April 2025. The S&P 500’s broader mix, with banks that like higher rates and defensives that hold up in a scare, did what it’s built to do. It fell less.
The Technical Picture
For tradable levels, I’m using SPY for the S&P 500 and QQQ for the Nasdaq 100, since those ETFs are what investors actually buy and sell. Despite the drop, neither broke. Both spent Friday slicing below their 20-day averages, the line that tracks the short-term trend, but both held comfortably above the levels that would signal something worse.
SPY, near $737 after the drop, has its first floor at the rising 50-day average around $723, then the $710 area where a measured pullback tends to find support, and below that the 200-day near $682. Momentum reset rather than collapsed: the daily relative strength index, a 0-to-100 gauge where under 30 is washed out and over 70 is overheated, sits right at 49, dead neutral, while the weekly trend is still healthy in the mid-60s.
QQQ, near $705, is the same shape but more stretched, because it fell further. The 20-day at $718 is now overhead resistance to win back. Support steps down to the 50-day around $683, then the $675 zone, then $652 if the selling deepens. Its daily momentum gauge also sits in the high 40s, neutral after a sharp single-day flush that left the very short-term readings deeply oversold.
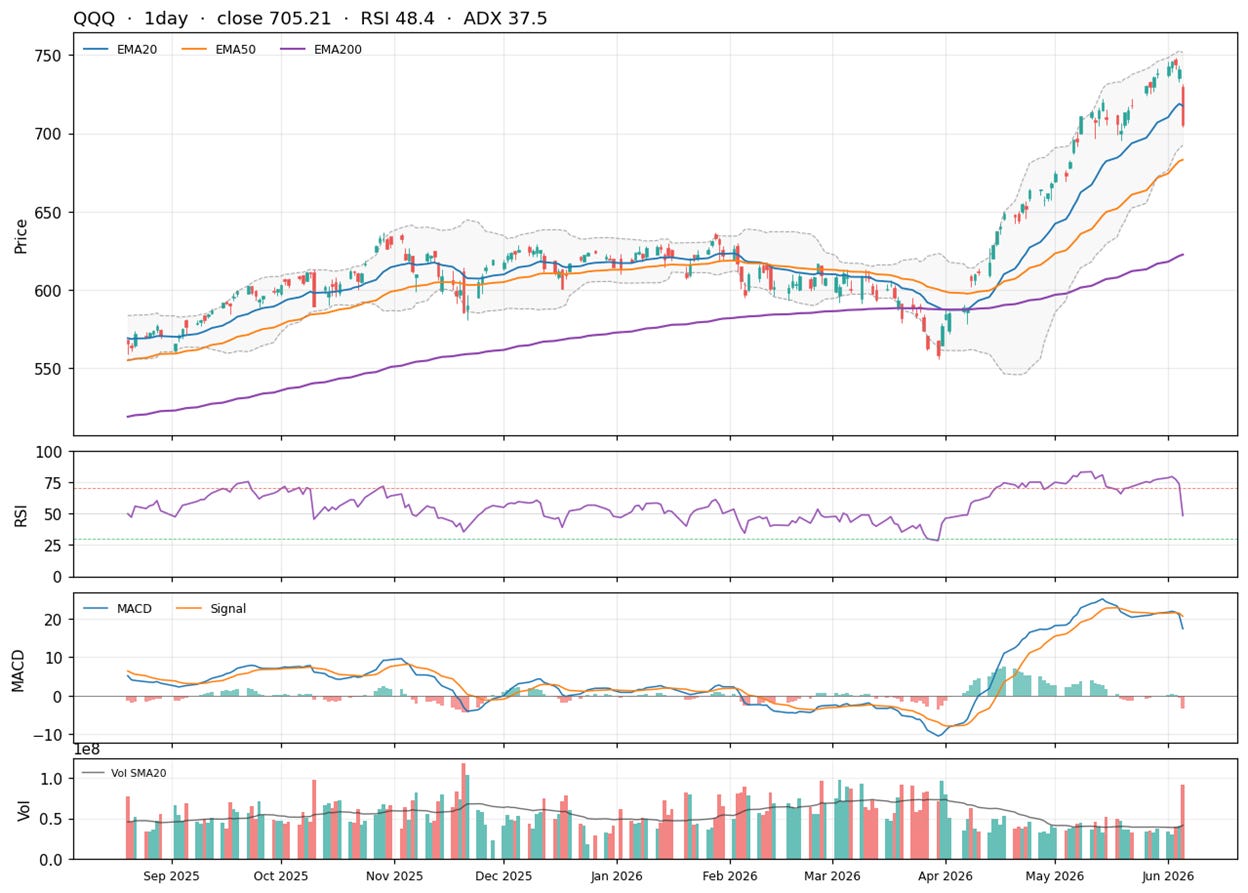
In plain terms: a sharp gut-check, not a trend change. The uptrends stay intact as long as the 50-day lines hold.
How to Position
These are levels to watch and zones to act around, not precise instructions, and the macro is the swing factor. If yields keep climbing, the pullback has further to run, so let price and rates settle before committing.
SPY: the core holding
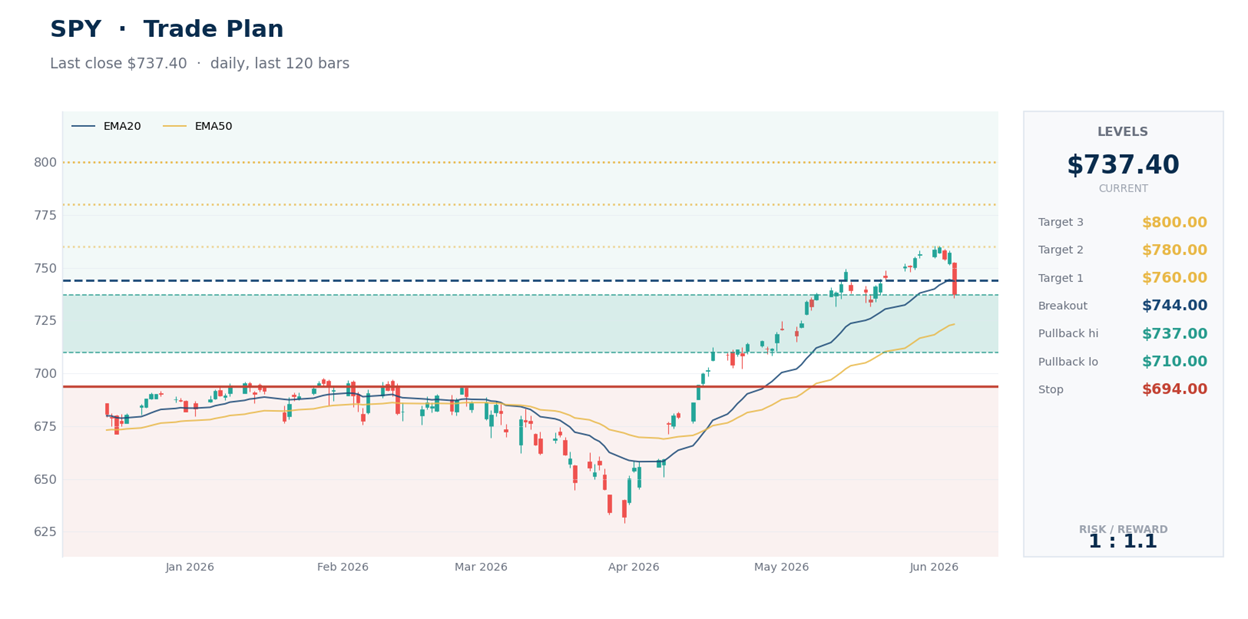
Accumulation zone: $710 to $737, from current back to the measured-pullback support. This is the broad, lower-volatility way to own the US market, and weakness toward the 50-day is usually where long-term buyers want it.
Confirmation: a reclaim of the $744 20-day line says the scare is unwinding.
Caution line: a close below $694, and especially the 200-day near $682, would point to a deeper correction rather than a dip.
QQQ: the growth tilt
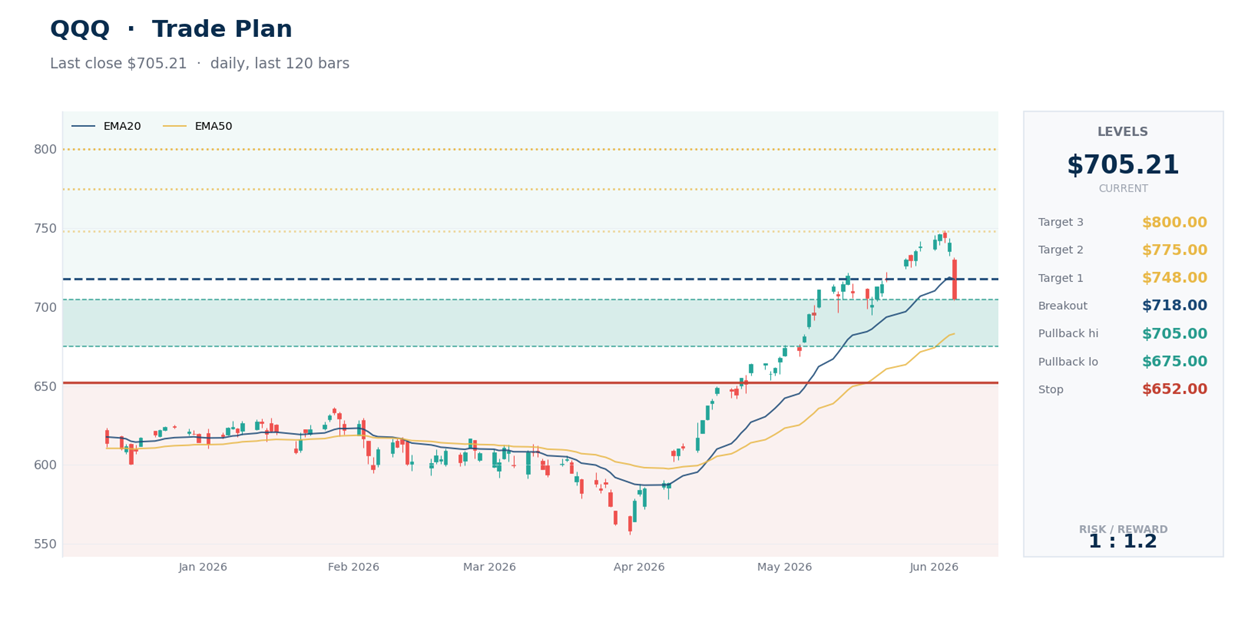
Accumulation zone: $675 to $705, into the 50-day and the first retracement shelf. Treat this as the higher-octane sleeve, not the whole portfolio, because it will move more in both directions.
Confirmation: a reclaim of $718 puts it back above its short-term trend.
Caution line: a close below $652 would say the rate scare has turned into something the growth complex can’t shrug off.
The allocation read
For most long-term investors the question isn’t the S&P 500 or the Nasdaq 100, it’s how much of each. The S&P 500 is the sensible core: the whole market, cheaper, more diversified, a smoother ride. The Nasdaq 100 is the accelerant: more growth, more tech, more reward when the cycle is kind and more pain when it isn’t. Friday was a live reminder that the growth index’s premium is rented, not owned, and the rent comes due on days like this. Size it accordingly.
Bottom Line
Friday didn’t change what either index is. It just reminded everyone, in a single session, what owning them feels like when rates bite. The S&P 500 is the market, and it fell like the market. The Nasdaq 100 is the market’s growth engine, and it fell like one, nearly twice as hard.
Neither broke, and the longer uptrends are intact above the 50-day lines. But the catalyst here is rates, not earnings, and that’s not in anyone’s control. So the discipline is simple: own the S&P 500 for the core, add the Nasdaq 100 for the tilt if you can stomach the swings, and let support levels, not headlines, decide when to step in.
Same news: the Nasdaq 100 fell 4.8% and the S&P 500 2.6%. That difference is the entire decision.
This is research and commentary, not personal investment advice. Levels are illustrative; size positions to your own risk tolerance and time horizon. The author may hold positions in the funds discussed.