
Zeta Global ($ZETA): Beneath the Noise Lies a Platform Beast
Cash-rich, high-growth, misunderstood. $ZETA is compressing under macro pessimism. But the setup rewards patience.

Zeta Global isn’t a household name, but it should be. Behind the curtain is a first-party data platform quietly onboarding brands and compounding revenues faster than most of Big Tech. The problem? GAAP losses, stock-based comp, and a chart that’s been taking a beating since November 2024.
But that’s the opportunity.
This is a case where both the technical roadmap and the fundamental trajectory align: the near-term may get uglier, but the longer-term setup is a coiled spring. Let’s break down why.
In a Nutshell
Revenue +36% YoY, FCF positive, net debt neutral, yet stock trades near lows
Wave (c) corrective structure likely not finished
Institutional support rising, but public sentiment is muted
Once corrective C-leg ends, look at targets of $20+
Accumulate near $13.50–$12.00 with stop below $11.50
Fundamental Analysis
Zeta Global is a marketing technology company that provides an AI-powered marketing cloud. It focuses on helping businesses acquire, grow, and retain customers through data-driven, omnichannel marketing solutions. Essentially, Zeta Global offers a platform that combines data, intelligence, and activation to create better customer experiences and marketing results.
Financial Strength
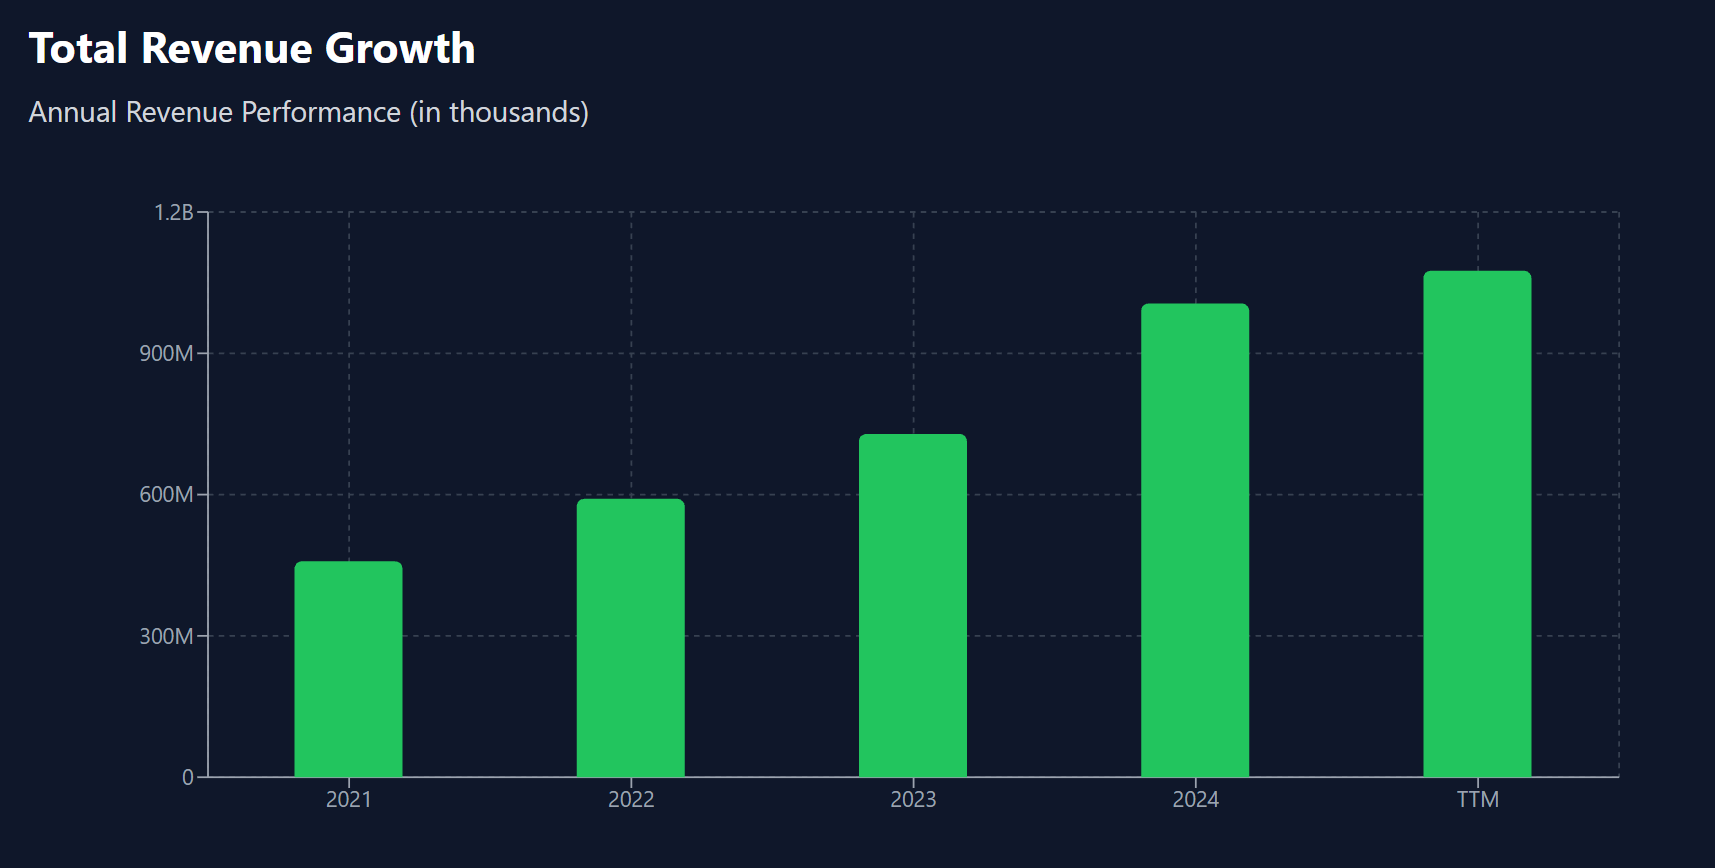
TTM Revenue: $1.075B (+30% YoY)
Gross Margin: ~60%
Free Cash Flow (TTM): $104.8M (positive 3 straight years)
Operating Cash Flow: $144M
Cash Position: $363M vs. $196M total debt
No net debt + growing working capital means liquidity is not a concern

Profitability Concerns
GAAP Net Loss (TTM): -$51.8M
EBITDA: Positive $9.1M
Normalized EBITDA: $20.5M
Diluted EPS: -$0.25, but improving from -$1.20 (2023) and -$2.95 (2021)
While still unprofitable on a GAAP basis, the trend is decisively upward. The key is scaling into operating leverage—and they’re almost there.
Valuation
Forward P/E: 23.98
Market Cap (@ $15): ~$3.55B
P/S (2025E): ~2.8x
For a 30% YoY grower with positive FCF, this is undervalued relative to SaaS peers
Analyst PTs: $25.33 avg, $44 high → potential 65–190% upside
Technical Analysis
Elliott Wave Structure
From the 2024 high ($38.20), Zeta is completing a textbook 5-wave down
On the 1-month chart, Wave (b) seems to have completed on Friday, and corrective Wave (c) likely to commence
Multiple charts show confluence between $13.30 and $12.20 as critical retracement zones
Fib + EMA Confluence
Strong EMA compression on 1h, 2h, 4h as price coils post-earnings
Daily EMA 20/50/100 all turning up, but price slipping below 20 and 50 EMA = short-term pressure
Fib extension projects possible bottoming between $13.30–11.50
Momentum Signals
MACD on daily = bear cross just occurred
Although overbought in the short term, RSI falling from overbought (60s–70s) back to neutral (50s), confirming pause/consolidation
Weekly MACD turning up but still early; RSI recovering off 30s → base-building


Conclusion
Fundamentals:
ZETA 0.00%↑ is one of the rare growth names posting consistent revenue acceleration, expanding margins, positive cash flow, and no net debt—yet trades at a steep discount to fair value due to past GAAP losses and low investor awareness.
It’s still in the “show-me” phase—but showing it is.
Rating: Fundamentally bullish
Technicals:
Wave structure and Fib zones suggest a final C-leg may be in play, which could drag price to $13.30–$12.20 before launching higher. However, if current levels hold, Zeta could be in early stages of a rebound.
Either way, technicals say accumulate into weakness with patience.
Rating: Technically cautious near-term, bullish mid-term
Trade Plan
Entry Zones
Tier 1: $14.20–13.50
Tier 2: $13.30–12.20
Close below $11.50 (structural invalidation)
Target Zones (2025–2026)
Minimum: $20.50
Full extension: $27.00 → $30.00
Analyst High Target: $44.00
Risk Management
Stop: Below $11.50
Position sizing: scale in 1/3 size each tier, stop on full size below invalidation
To Conclude
Zeta Global is a misunderstood compounder with a rapidly improving balance sheet, strong FCF, and sticky SaaS-like revenue model. While price action looks weak short term, it's forming a base that could fuel a breakout once the corrective structure completes.
Accumulate weakness. Prepare for strength.
The information in this post is for educational and informational purposes only. It reflects the author’s personal research and analysis, which may be subject to error or omission. This is not financial, investment, or trading advice. Always conduct your own due diligence and consult with a qualified financial advisor before making any investment or trading decisions.