


ZETA 0.00%↑ spent 2 weeks grinding out new highs and handed the whole move back in a session.
Tuesday it traded at $34.92, the best price in a year. Wednesday it closed at $32.27.
Nothing came out of the company in between. No filing, no rating change, no announcement of any kind.
It was the market, not the business. The Nasdaq fell 1.9% on Wednesday, the Russell 2000 did the same, technology closed the week down 3.7% as a sector, and Zeta carries a beta of 1.39 and swings about 4.6% on an ordinary day. A name built like that falls harder than the index whenever the market has a bad afternoon.
So far today, Zeta is down over 4% in pre-market, with no new information from the company itself.
The price now sits around support that has been building since late September, and it’s the first time since our Zeta piece in August that the price has come back to a level worth looking at.

Key Takeaways
The support that matters is $31.40 to $32.10, where the 20-day average, the Bollinger midline and the Kijun line all meet. Wednesday closed just above it. Today’s pre-market price is below all of it, so today is about whether that cluster gets reclaimed by the close.
Zeta hasn’t reported a number since 4 August. Everything that moved the stock from $29 to $34.92 and back was product news, 2 small acquisitions, a broker conviction list and 7 price target raises.
Reported growth of 39% this year becomes 25% once you strip out acquisitions and political money, and the acquisition doing most of the flattering closed on 24 November last year. It laps itself in 6 weeks.
Analysts covering the stock average a $36.79 target, 14% above here. At Tuesday’s high that gap had closed to under 9%, so one bad session restored most of the room.
Earnings land on Tuesday, November 3. The company has beaten and raised 20 quarters running, so a beat is already the base case rather than the surprise.
What Zeta Does
ZETA 0.00%↑ sells marketing software to large companies, built on top of an identity graph, which is a database of who people are and what they do across the internet. Its customers use that to find buyers, keep them and measure whether any of it worked.
Athena is the AI layer on top, and the appeal is that users can just ask it a question in plain English instead of waiting 3 days for someone to build a report.
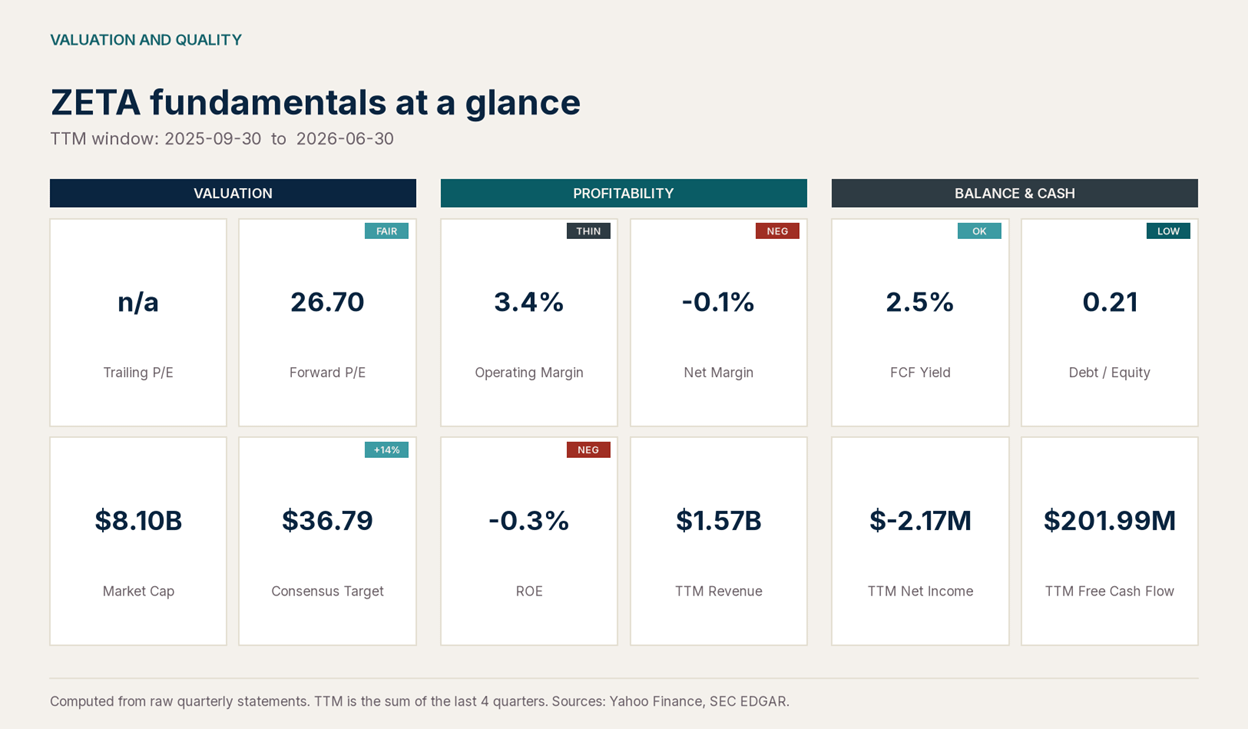
Trailing revenue is $1.57 billion, market cap is around $8.10 billion, and it has turned a GAAP profit in 2 of the last 3 quarters, which is newer than most people realise.
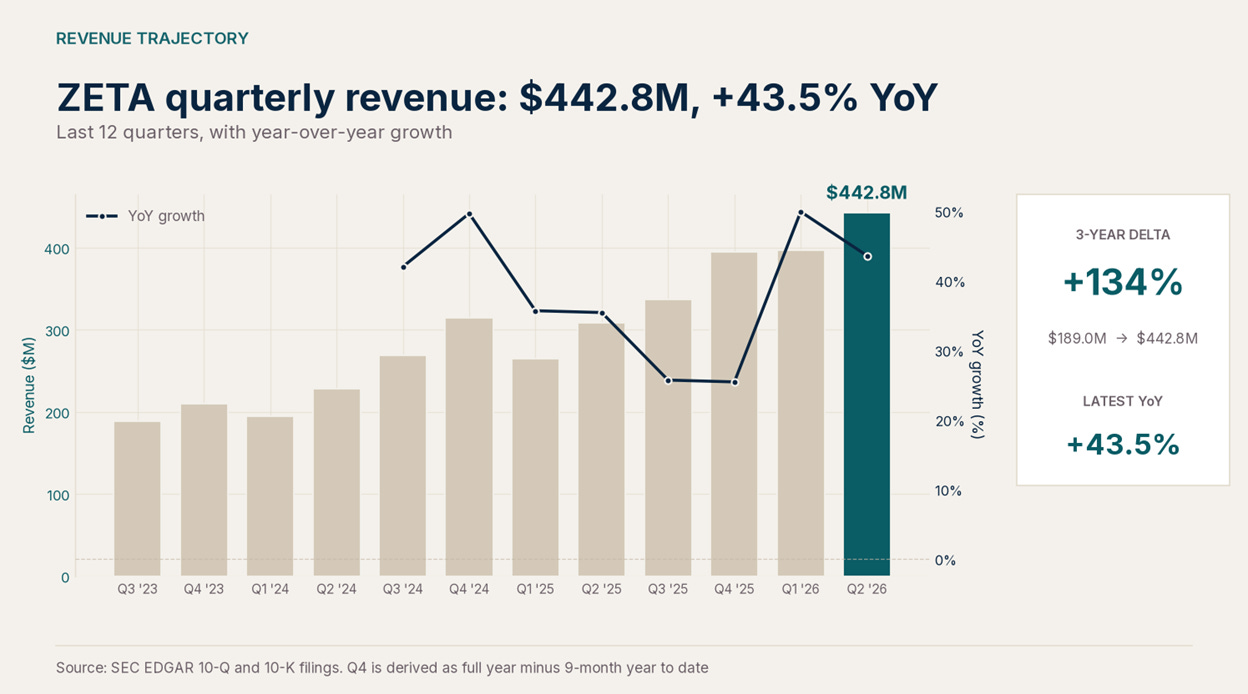
12 quarters ago Zeta was doing $189.0M a quarter. The June quarter came in at $442.8M, up 43.5% year on year. That’s a 134% increase in 3 years.
Our August Call
We published a plan on 21 August with the stock at $27.85, so here it is checked properly.
That entry band ran $26.20 to $27.20 and it filled the same session, low of $27.11. The breakout trigger at $29.90 closed above on 27 August. The $24.20 stop was never tested, and the lowest the stock traded in the whole stretch was that opening-day $27.11.
All 3 targets came in. The first at $29.90 on 27 August, the second at $32.30 on 3 September, and the third at $34.10 on 5 October.
From a $27.11 fill you’re up 19.0% after Wednesday’s drop, and you were up 24.7% at Tuesday’s high.
What Changed Since the Last Report
Not much.
Zeta last reported on 4 August. In the 10 weeks since, here’s the entire list of what the company itself has done:
On 5 October it agreed to buy Senso, a small Toronto engineering shop whose technology already runs inside Zeta’s search visibility product.
On 6 October it agreed to buy Digital Audience, which does identity and activation data and gives Zeta more of a footprint in Europe. Again, nothing disclosed on price or size.
On 8 October it showed off AthenaOS at its annual customer conference. It’s in limited internal beta now, public beta is promised later this year, and general availability is planned for Q1 2027.
The one genuinely large item is older than all of it. Back in June Zeta agreed to rebuild its data cloud on Palantir’s Foundry, and the chief executive has talked about more than $100M of extra annual revenue coming out of it. Back then, Zeta claimed that nothing from Palantir or OpenAI was included in its guidance.
Fundamentals and Company
Profit Breakdown
June was a good quarter by any measure. Revenue beat the midpoint of guidance by $23M, adjusted EBITDA came in at $91.7M for a 20.7% margin, FCF was $58.0M, and the super-scaled customer count reached 197, each spending an average of $1.8M in the quarter, both up 17%.
GAAP net income was $8.2M.
Most of the gap between EBITDA and net income is stock related. Zeta expensed $52.1M of share-based compensation in the quarter, 11.8% of revenue, and $105.1M across the first half. It’s a real cost paid in dilution rather than cash, and it’s why the trailing net margin on our own calculation is still fractionally negative at -0.1%.
Cash, on the other hand, is still in a solid position. Trailing FCF is around $202 M, they have $310.0M on the balance sheet, and debt runs at 0.21 times equity and the current ratio is 2.38. Whatever else you worry about here, this company isn’t going to need the capital markets.
Gross margin is the line we’d watch most closely. It’s 59.1% now against 62.1% a year ago, and management has been straightforward about why. Cost of revenue ran at 41%, up 3% on last year, because newer agency business tends to start in social channels that carry media cost with them. Direct revenue slipped from 75% of the mix to 72% in a single quarter.
Growing quickly through lower-margin channels is reasonable enough. It just isn’t infrastructure economics, and infrastructure economics is the story holding up the multiple.
Zeta is up 85.4% over the past year while the S&P 500 reached 15.7%. The harder comparison is its own sector, which has had a rough time.
Legal and Insider Filings
Two things to consider here:
The securities case that came out of the 2024 short seller report is still running. On 8 July the Southern District of New York denied Zeta’s motion to dismiss in full, and the matter went into discovery. The class period runs from 27 February 2024 to 10 March 2025. A denied motion decides nothing about who is right, it only means the case proceeds, but discovery in an argument about where consumer data came from tends to produce headlines on a timetable nobody controls.
On 13 August, 9 days after the quarter that started this run, a family trust holding the founder’s stock entered a variable prepaid forward on 1,000,000 Class B shares and took $22.7M in cash up front. The filing gives the purpose as tax, trust and estate planning. Settlement comes after August 2029, in shares or cash at the trust’s choosing, and the contract carries a floor of $26.11 and a ceiling of $47.29.
No shares were sold and the votes stay where they were. What the trust has done is take money now and cap its own upside on that block at $47.29, which is 47% above Wednesday’s close.
Valuation
At $32.27 you’re paying 5.2 times trailing sales and 26.7 times next year’s consensus earnings, for a free cash flow yield of 2.5%.
Analysts covering the stock average a $36.79 target with a median of $38.00, and the ratings split 12 buys, 3 holds and no sells. At Tuesday’s high that average sat under 9% above the price, which is the kind of gap that tells you the buyers have run out of road. After one bad session it’s 14%, which shows how little it takes to change a valuation argument built on somebody’s target.
Our own read is simpler.
Zeta is a 23% to 25% organic grower with real cash generation and a share count that keeps creeping up, the acquisition tailwind runs out next month, and at 26.7 times forward earnings you’re buying the 2027 story before AthenaOS has shipped to a single paying customer.
Technical Analysis
Weekly Chart
Nothing in the longer-term picture broke on Wednesday.
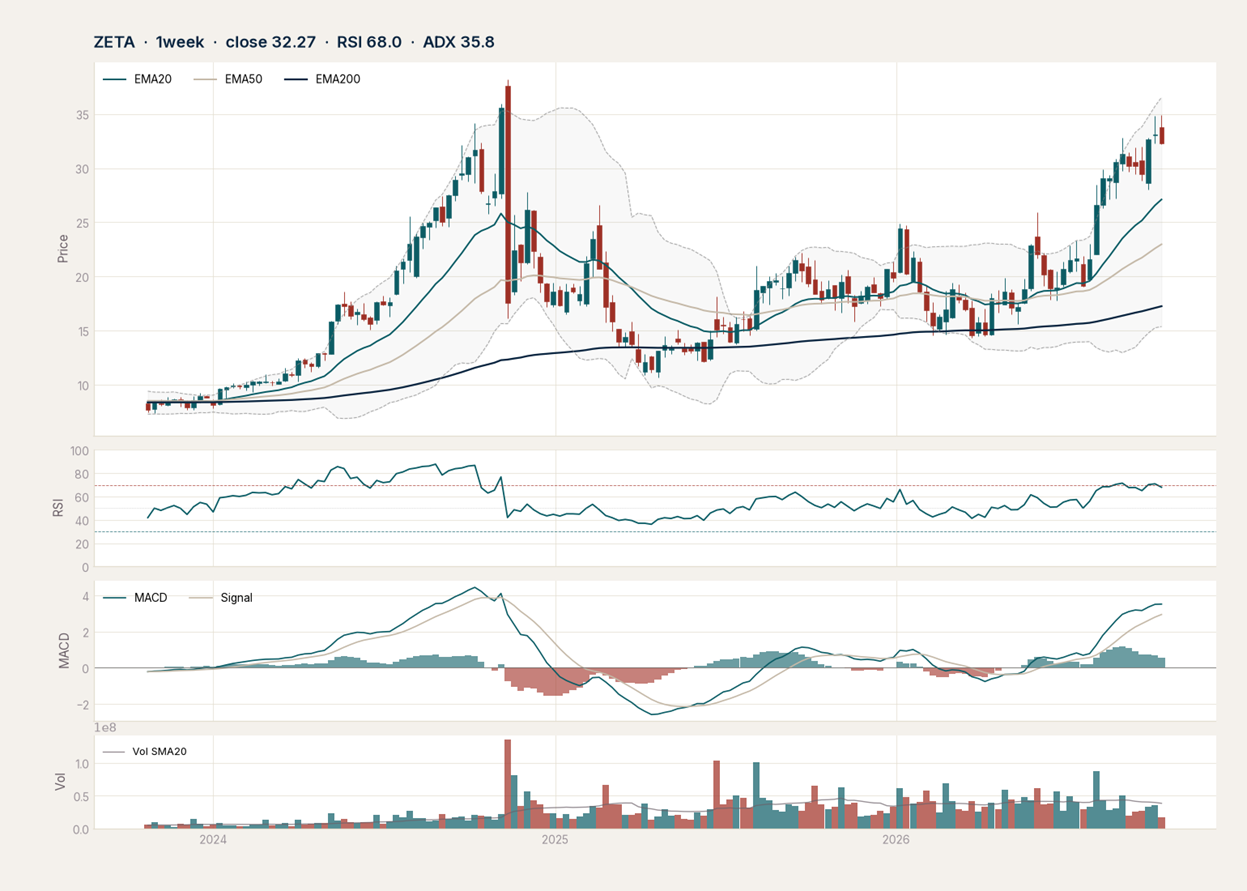
Price sits above the 20-week average at $27.11, the 50-week at $22.97 and the 200-week at $17.25. Those are averages of the last 20, 50 and 200 weekly closes, so roughly 5 months, a year and 4 years of trading. Having all 3 underneath you, in that order, is what a healthy long-term trend looks like, and one bad day doesn’t touch it.
Weekly ADX is 35.8, which measures how strong a trend is rather than which way it’s going, and a reading in the mid-30s says this one is established. Directional movement sits at +DI 29.0 against -DI 9.8, meaning buyers still hold clear control and sellers are barely showing up.
Weekly RSI came down from 72.0 to 68.0, which is the useful part. It’s out of the overbought zone without doing any damage, and the StochRSI, a faster version that resets sooner, dropped from 97 to 91.6. Momentum cooled rather than cracked.
Above here, the level that matters is $38.20, the all-time high, set in the week of 11 November 2024. That was the same week a short seller accused the company of sourcing consumer consent improperly and the stock fell 37.1% in a session to $17.76. Price today sits 15.5% below that high, with stock still trapped between here and there from people who bought on the way down.
So the weekly picture suggests you should own this.
Daily Chart
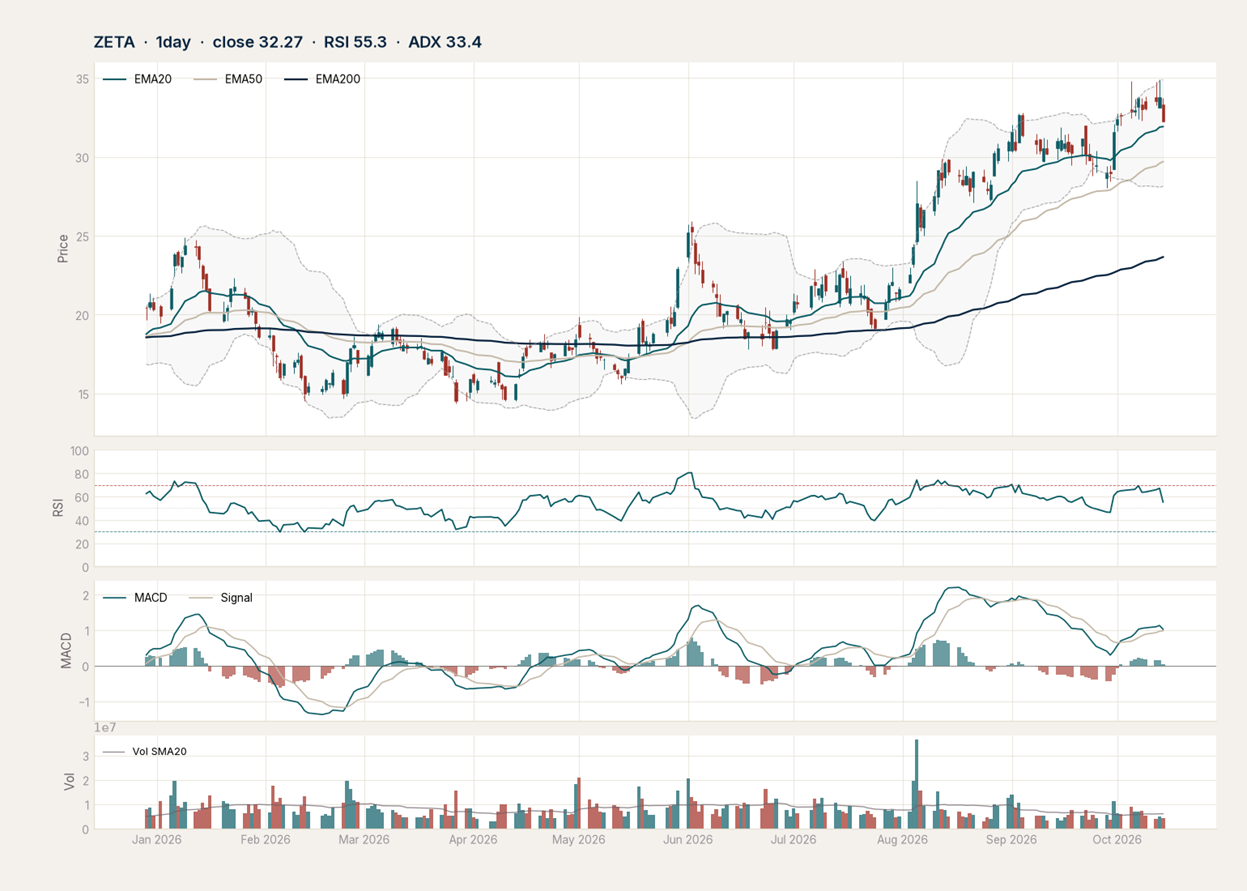
Price at $32.27 is still above every daily average: the 20-day at $31.92, the 50-day at $29.70, the 100-day at $26.70 and the 200-day at $23.65. The full stack is intact, which is the single most useful structural fact on the board, and Wednesday’s close landed just 0.35 above the 20-day.
Momentum took the damage. Daily RSI fell from 67.1 to 55.3 in one session, which is a big move for a single day and leaves it dead centre. The MACD line at 1.025 is still above its signal at 0.981, so momentum is positive and the trend hasn’t flipped, but the histogram has shrunk from 0.162 to 0.044 and another session like Wednesday rolls it over.
Average true range is $1.48, about 4.6% of the price, so this stock covers more ground in a day than most large companies manage in a fortnight. Worth remembering before deciding Wednesday meant anything.
Two details from the price action are worth noting:
Zeta reached $34.80, $34.75 and $34.92 on 5, 12 and 13 October and closed below each time, then spent Wednesday unwinding the lot. That’s 3 failures inside a 17-cent band followed by a drop, which is a supply zone doing its job.
Wednesday’s selling came on 4.4M shares against a 20-day average of 6.1M, and Tuesday’s high was made on 4.9M. Neither move brought real volume with it, which argues positioning rather than conviction either way.
Support underneath is tight, and it’s about to be tested properly. The 20-day at $31.92, the Bollinger midline at $31.53 and the daily Kijun line at $31.48, which is just the midpoint of the last 26 sessions, all sit within half a dollar of each other. Pre-market price is underneath all 3. Below them, the August breakout shelf at $29.90 and the 50-day at $29.70 are the floor of the whole advance, and there’s not much between those and the stop.
Trade Plan
Earnings land on Tuesday, November 3, which is 19 days away and governs everything below.
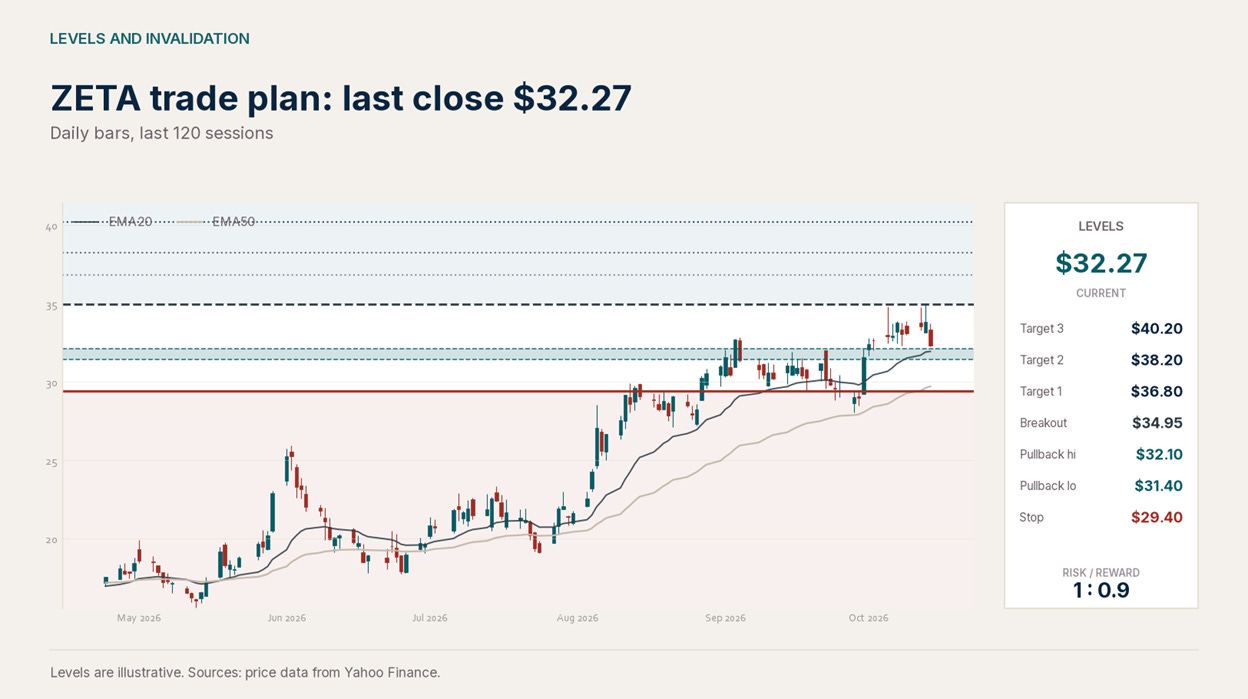
Wednesday’s drop brought the price down to the support. Thursday’s indication takes it through. That changes how you use the levels, so read the trigger before the zone.
Entry Zone: $31.40 to $32.10
Where the 20-day average at $31.92, the Bollinger midline at $31.53 and the Kijun line at $31.48 all bunch together.
Pre-market price is below entry level, so the stock is gapping through that zone rather than drifting into it. Don't buy the opening. The buy is a daily close back above $31.40, which tells you the cluster held and the gap was noise.
If it doesn’t reclaim, the next real support is $29.90 to $30.20, the August shelf sitting on the 50-day at $29.70. Buying there leaves barely 2% to the stop, which is less than half a day’s range in this name, so that’s a starter position or nothing.
Breakout Entry: Above $34.95
This is the resistance point that turned it back 3 times. If it clears this point and sustains, you can consider a position there.
Stop Loss: Daily close below $29.40
Which sits under both the 50-day at $29.70 and the August breakout shelf at $29.90
Losing both of those means the advance that started in August has failed, and that’s a clean break rather than ordinary noise.
Risk from the middle of the zone at $31.75 down to that stop is 7.4%, about 1.6 average daily ranges. Anything tighter gets shaken out.
Targets:
T1: $36.80, where the upper weekly volatility band at $36.54 runs into the $36.79 average analyst target. That’s 15.9% up from the zone, or 2.1 times what you’re risking.
T2: $38.20, the all-time high, 20.3% from the zone and 2.7 times the risk.
T3: $40.20, the standard 1.272 extension of the move that began at $15.60 in May, 26.6% up and 3.6 times the risk.
If the first target hits, we’d move the stop up to a close below $32.20, which sits under every session low since 5 October and roughly where you bought.
If $38.20 hits, move it again to a close below $34.70, because an old ceiling that starts holding as support is about as good a confirmation as this stock offers.
Earnings are the live risk to all of it. Filled before the week of 3 November and you’re carrying defined risk into a known event, which is normal enough. Not filled by then and we’d let the print happen first. Zeta moved 11.6% on the session after its August report, and a drop of that size from here opens at $28.50, straight through a stop that sits 8.9% below the current price.
Bottom Line
For most of October the problem here was never the business, it was the price. Wednesday fixed a chunk of that in a single session, and it seems to be continuing today.
ZETA 0.00%↑ grows organically in the low-to-mid 20s, converts that into real cash, and the next genuine catalyst is a product landing in early 2027. Against that, the acquisition tailwind runs out in November, a securities case is in discovery, and the stock has already run 85% in a year.
None of it makes the stock a sell. It makes the price the entire question, and Wednesday improved the price.
Everything turns on $29.40. Above that you own a working uptrend in a company generating cash. Below it the August advance is gone and you’re holding a 25% grower at 5 times sales with a growth comparison that gets harder in 6 weeks.
If you’re already in from August, you’re up 19.0% and nothing has broken. Trail it and leave it alone.
We don’t predict. We prepare.
All content provided is for informational and educational purposes only and does not constitute investment advice, a recommendation, or an offer to buy or sell any security. The trade plans, levels, and scenarios discussed are illustrative frameworks based on market structure and are not guarantees of performance. Markets involve risk, and losses are possible. Past performance is not indicative of future results. Each reader is responsible for their own investment decisions, position sizing, and risk management.