


Zeta Global wants you to change your mind about what it is.
The market has priced it as marketing software for years. Management now says it’s AI infrastructure, and it put that case in writing this month, closing on the line that the gap between those 2 views is “the entire repositioning opportunity.”
There’s real support for the claim. OpenAI, Palantir, Snowflake and Gap all signed on inside 6 months, and retention is the best the company has ever posted.
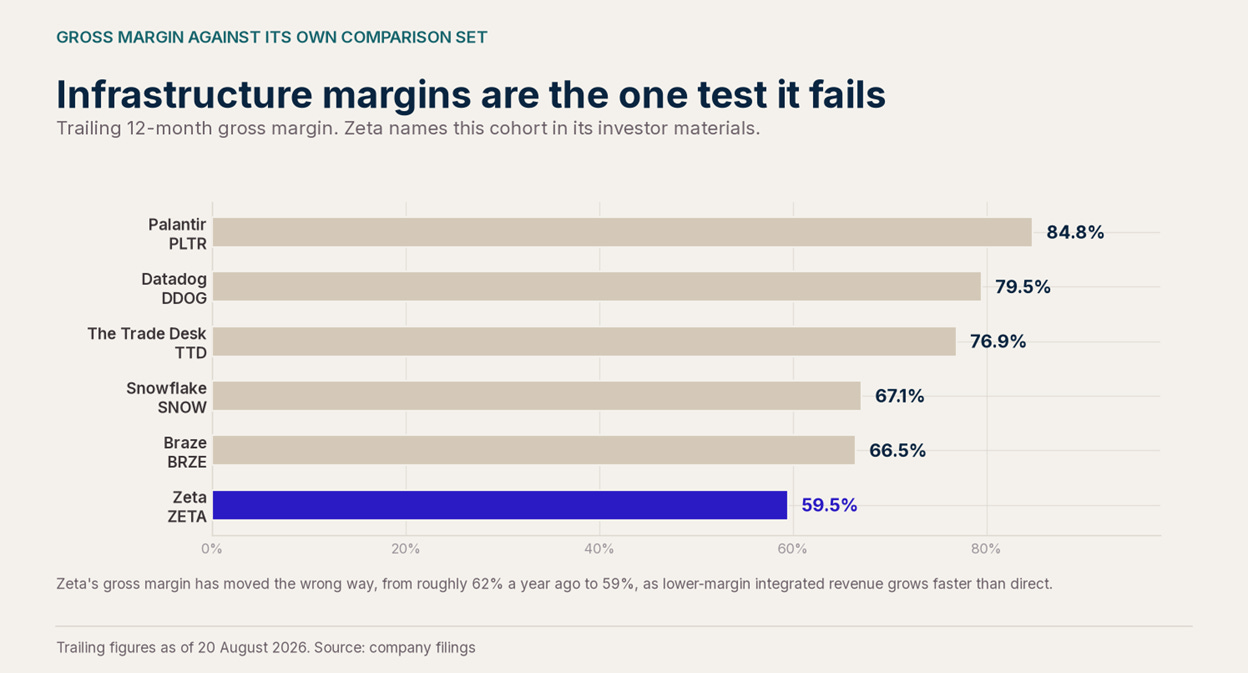
There’s also a test it hasn’t passed. Infrastructure businesses earn infrastructure margins, and Zeta’s gross margin is 59.5%, and it’s falling, not rising.
The harder problem is that the market has already granted most of the rerating anyway. At $27.85 the stock trades 37% above what Zeta’s own valuation slide said it was worth 3 weeks ago.
You’re not early to this one. You’re paying for the part that hasn’t happened yet.

Key Takeaways
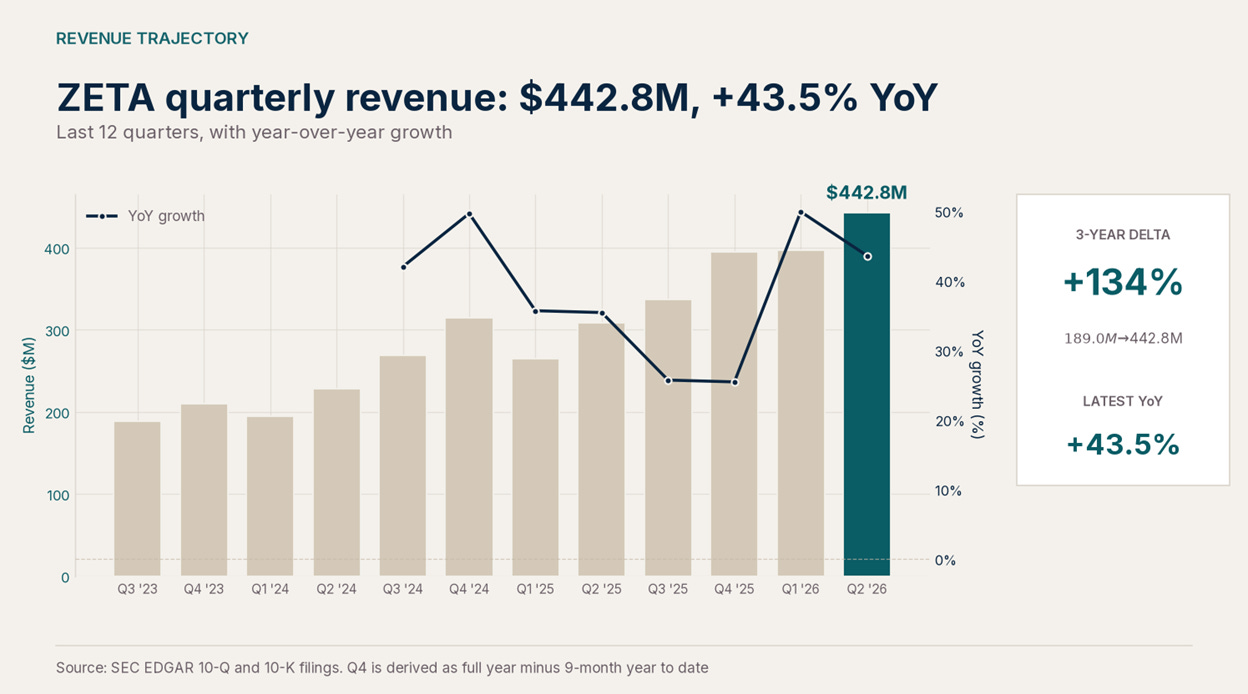
The quarter was strong on every headline. Revenue of $442.8M grew 43.5%. Adjusted EBITDA of $91.7M grew 56%. Free cash flow of $58.0M grew 73%. It was the 20th consecutive beat-and-raise.
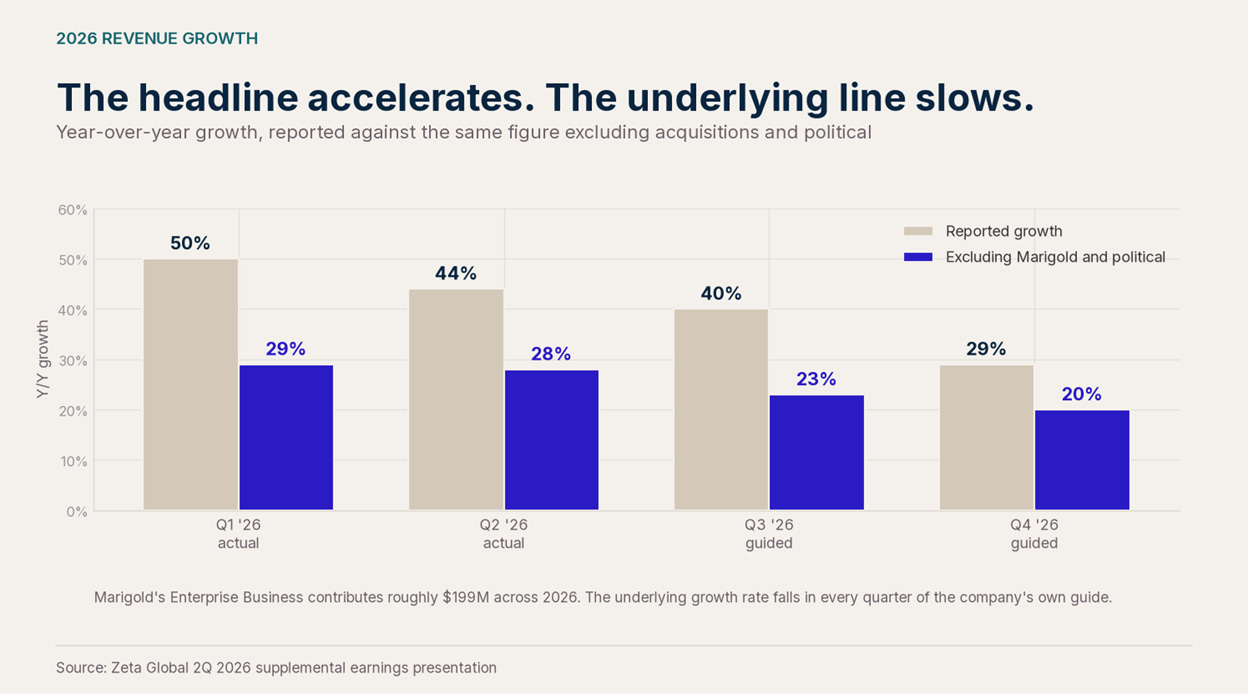
The underlying growth rate is slowing. Strip out the Marigold acquisition and political money and growth runs 29%, 28%, 23%, then 20% across 2026, on management’s own guide. The 39% headline is acquisition math.
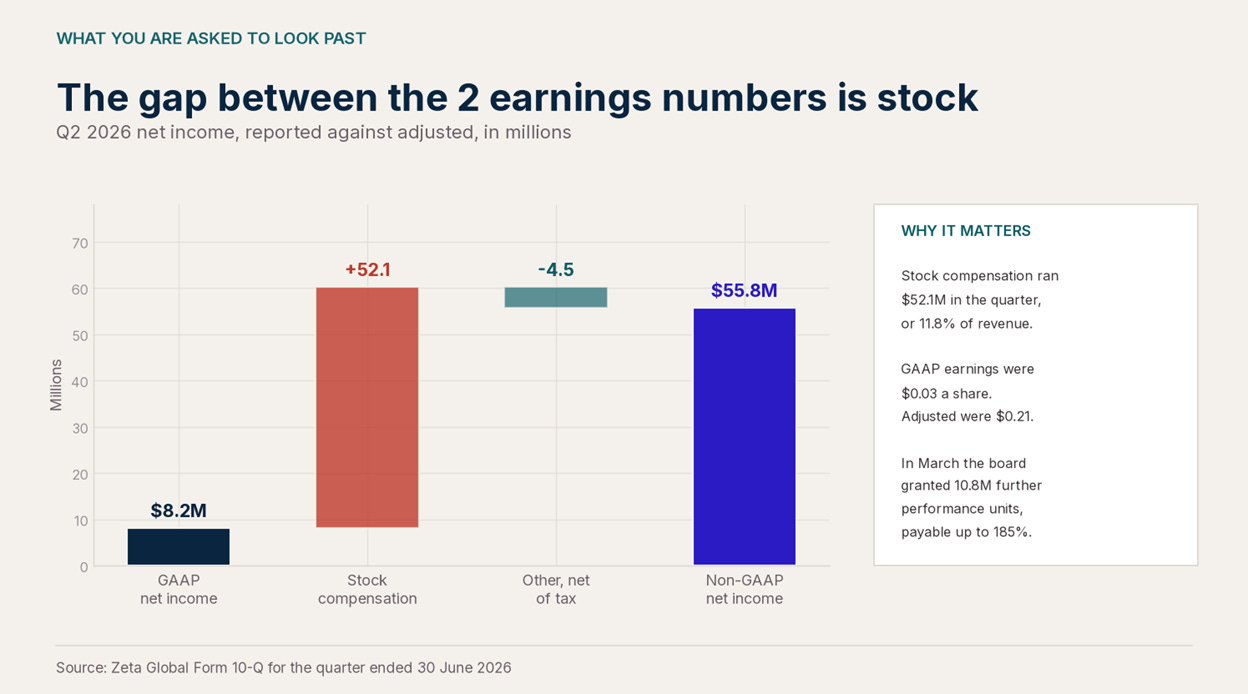
The gap between the 2 earnings figures is stock. GAAP earnings were $0.03 a share. Adjusted were $0.21. The difference is $52.1M of stock compensation, which is 11.8% of revenue.
Gross margin is the weak point in the infrastructure claim. At 59.5% it sits below every company in the cohort Zeta names, and it’s fallen from roughly 62% a year ago.
The company’s own valuation argument is largely spent. Its slide showing a 5% free-cash-flow yield against a 2% cohort implied about $20.34 a share. The stock is 37% above that.
A securities case just cleared its first hurdle. On July 8 a federal court denied the motion to dismiss, so the matter proceeds to discovery.
About the company
ZETA 0.00%↑ sells enterprises a single system for finding customers, keeping them, and measuring both. The asset underneath is an identity graph covering 535M individuals, built over 20 years from its own email infrastructure, its ad exchanges, and the Disqus and LiveIntent publisher networks. Athena is the layer on top, generally available since Q1, and it lets customers query that graph by asking rather than by building reports.
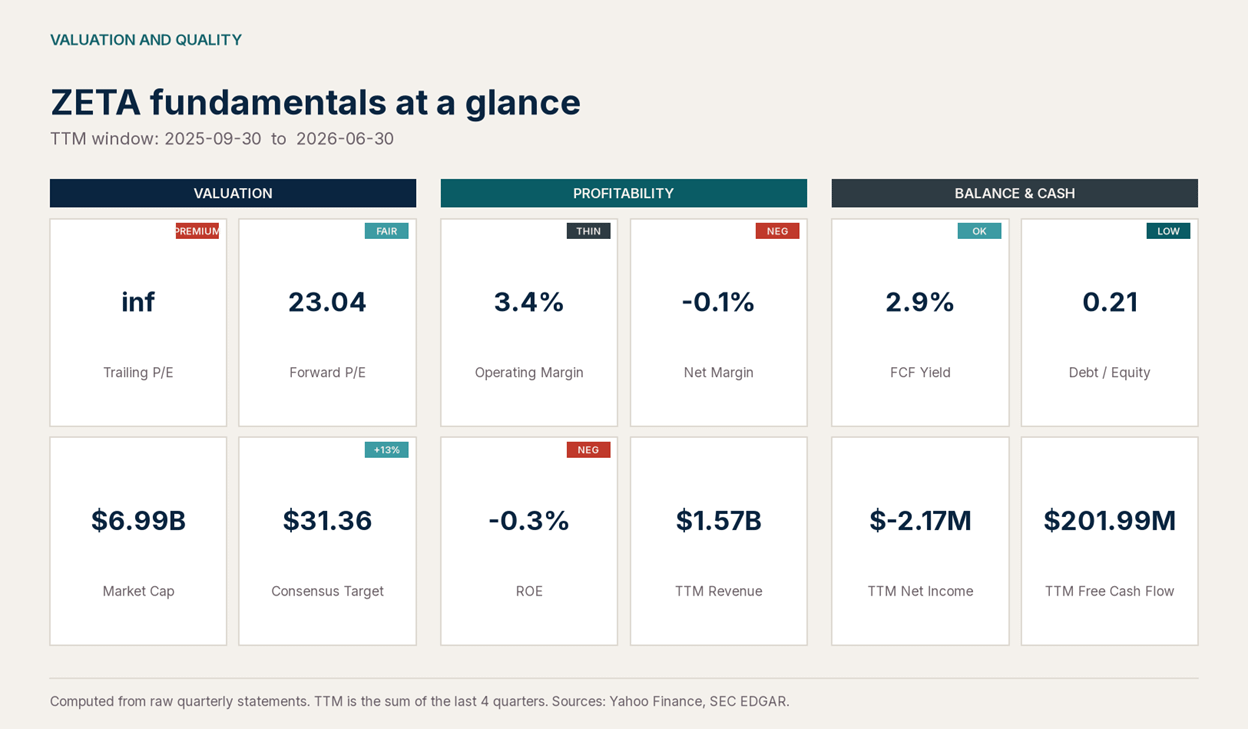
Trailing revenue is $1.57B and the market values the business at $6.99B. It recorded its first GAAP profit in June 2026 and still carries an accumulated deficit of $1.06B.
Q2 2026 overview
The AI adoption data is the real news
Most companies claim AI traction. Zeta put numbers on it.
More than 40% of super-scaled customers were monthly active on Athena within roughly 130 days of its enterprise launch.
Customers who’ve adopted broadly across the product are about 20% of the base and roughly 70% of revenue.
Those same customers grow about 4x faster than customers early in adoption, and their retention is 4% above the company average.
Average super-scaled tenure has stretched to 56 months from 48.
Cross-selling backs it up. Customers using more than 1 use case rose 90%, those using 5 or more channels rose 50%, and cross-sell deals won rose 43%.
Here’s the operating leverage: quota-carrying salespeople increased by around 0.5% (1 person), while pipeline rose more than 60%. Management also said 89.6% of new code was machine-generated in the quarter, up from 75% in Q1, with internal AI costs under 1% of revenue.
Partnerships
Four new partnerships happened within 6 months:
OpenAI models power Athena’s voice and Zeta now works with OpenAI’s advertising operations, which management called the most instrumental partnership in its history.
Snowflake SNOW 0.00%↑ put the Zeta platform inside more than 100 customer environments.
Palantir PLTR 0.00%↑ rebuilt Zeta’s Data Cloud on Foundry under a 7-year agreement.
GAP 0.00%↑ named Zeta its system of record.
That’s real validation, but very much forward-looking. Very little of it sits in the $1.57B of trailing revenue, which is where the narrative is still unsubstantiated.
Adjustments to consider
Reported growth of 43.5% is flattered by Marigold’s Enterprise Business, which added $48.1M in the quarter and roughly $199M across the year. Take it out, along with political money, and the picture inverts: 29% in Q1, 28% in Q2, a guided 23% for Q3 and 20% for Q4.
That’s a business decelerating to 20% while the headline says 39%. Although both numbers are true, only one describes the operational engine.
Fundamental Overview
Revenue Segmentation
Reportedly, revenue is broken down as follows:
Channel:
Direct platform revenue, meaning work that runs entirely on channels Zeta owns, was 72% of the mix, down from 75% a year ago. Integrated revenue, which leans on third-party channels and carries thinner economics, took the other 28%.
Geography:
The US brought in $402.6M, up 34.9%. International did $40.2M versus previous $10.0M, and that near-quadrupling is almost entirely Marigold, which brought offices across the UK, Denmark, the Netherlands, France and Germany. International is now 9.1% of revenue (previously 3.2%). Zeta became a multinational business in 2 quarters, by purchase rather than by build.
Source of increase:
Of the $134.3M of added revenue, $75.9M came from new customers and $58.4M from existing ones.
Vertical:
Clients spread across 15 industries, with Consumer and Retail largest at 24% of 2025 revenue, then Travel and Hospitality and Insurance at 11% each and Telecom at 10%.
8 of the top 10 grew more than 20% this quarter.
Concentration risk sits at the customer level rather than the sector level: 1 customer is more than 10% of revenue and of receivables.
Margin Breakdown
Cost of revenues rose 54.7%. Gross profit came in at $261.8M for a 59.1% margin, down from 62.1% a year ago, a fall of almost 3%.
The driver? $54.2M of incremental media costs, plus $5.9M more in people and $3.9M in technology. Media cost is what you pay to reach an audience through somebody else’s inventory, and it scales with the integrated business.
Below the gross, the things look better:
Selling and marketing grew 20.4% to $104.0M, less than half the rate of revenue.
General and administrative grew 22.1% to $75.9M, driven mostly by $14.5M more in technology and infrastructure.
Research and development grew 38.1% to $42.2M, which is the right place to be spending.
Depreciation and amortisation grew 30.2% to $22.7M on the acquired intangibles.
Total OPEX grew 35.8% against revenue growth of 43.5%, and that spread is the operating leverage. It carried operating income to a positive $16.9M against a $5.1M loss a year ago.
So these two forces run against each other: gross margin erodes on mix, operating margin expands because the cost base below it grows slower than sales.
Cash Utilization
Adjusted EBITDA reached $91.7M at a 20.7% margin, up 170 basis points. Free cash flow hit $58.0M at a 13.1% margin, up 220 basis points, converting 63% of EBITDA into cash.
Across the first half, operating cash flow was $118.9M against $76.8M, and note how it was produced: a net loss of $5.1M more than offset by $152.6M of non-cash addbacks, of which $105.1M is stock compensation. That’s real cash in the door. It’s also cash that exists because a large slice of pay is settled in shares rather than dollars.
Investing used $70.9M, mostly $50.8M of acquisition payments plus $12.3M of software development and $7.8M of capital spending. Financing used $58.6M, almost all of it $55.6M of share repurchases.
Net revenue retention reached 120% in 2025, its best on record, meaning existing customers spent 20% more than the year before. Management raised the full year across the board, to $1.818B of revenue, $405.2M of EBITDA and $255.3M of free cash flow. The cash flow raise outran the revenue raise, $20.3M against $33M.
Stock Compensation
Stock compensation ran $52.1M in the quarter, 11.8% of revenue, and $105.1M across 6 months. That single line is why GAAP earnings were $0.03 and adjusted were $0.21.
It isn’t spread evenly. Stock is 22.5% of the selling and marketing line and 29.4% of research and development. Those are the 2 functions the growth story depends on, and roughly a quarter of what they cost is paid in equity rather than cash.
The forward load is heavier: $381.4M still unrecognised over about 1.8 years, front-weighted at $95.0M for the rest of 2026 and $116.9M in 2027. And in March the board granted a further nearly 11 million performance units, payable up to 185% on full achievement, against revenue targets running from $2.0B to $3.0B through 2030.
Add it up. Unvested restricted stock, options and performance units total roughly 42.7M shares against 251.0M outstanding, about 17%, before that 185% multiplier. There’s a further $50M of Class A stock committed under a long-term partnership agreement sitting in the purchase obligations note.
The buyback runs in parallel. Zeta repurchased 3.2M shares for $55.6M in the first half at an average of about $17.40, including some at $14.59 in April.
Balance Sheet
Cash is $310.0M against $197.5M of borrowings, a net cash position of about $112.5M. The current ratio is 2.38 and working capital is $393.2M. In July it refinanced into a $1.0B facility, a $250M term loan and a $750M revolver that sits entirely undrawn.
Two things to note on the assets:
Goodwill and intangibles total $710.1M, or 48% of total assets. That’s the accumulated price of buying growth. Intangibles amortise on a 4.55-year life, so $29.5M more hits GAAP earnings this year and $50.3M in 2027 whether the acquired business performs or not.
Remaining performance obligations are $218.7M for the next 12 months. Set that against $1.818B of guided 2026 revenue and only about 12% of next year’s revenue is under contract today. Deferred revenue is $33.9M, under 2% of the annual run rate.
That’s the number that argues hardest against the infrastructure framing.
Infrastructure companies book long contracts and carry large backlogs.
Zeta’s revenue is consumption-based and re-earned every quarter. It has been re-earned 20 quarters running, which is a real achievement, but earned is not owed.
Relative valuation
At $6.99B you’re paying 3.85x guided 2026 sales, 17.3x guided EBITDA, and a 3.65% forward free-cash-flow yield. Against Palantir at 153x EBITDA or Datadog at 78x forward earnings, that’s cheap. Against The Trade Desk, which now trades at 7.5x EBITDA after its growth stalled, it isn’t.
Fundamental conclusion: the operating business is inflecting and the proof is in the adoption data. First GAAP profit, 120% retention, 63% cash conversion, operating costs growing 8% slower than revenue, and a sales force that isn’t growing are all real. On the flipside, underlying growth falling to 20%, gross margin below every named peer and still sliding on media mix, 11.8% of revenue paid in stock, only 12% of next year’s revenue under contract, and a valuation that has already absorbed most of the rerating. At 3.85x sales you aren’t overpaying for a 25% grower. You’re paying in full for the infrastructure story to work.
Technical Overview
Weekly chart
The long-term picture is a repair that has completed.
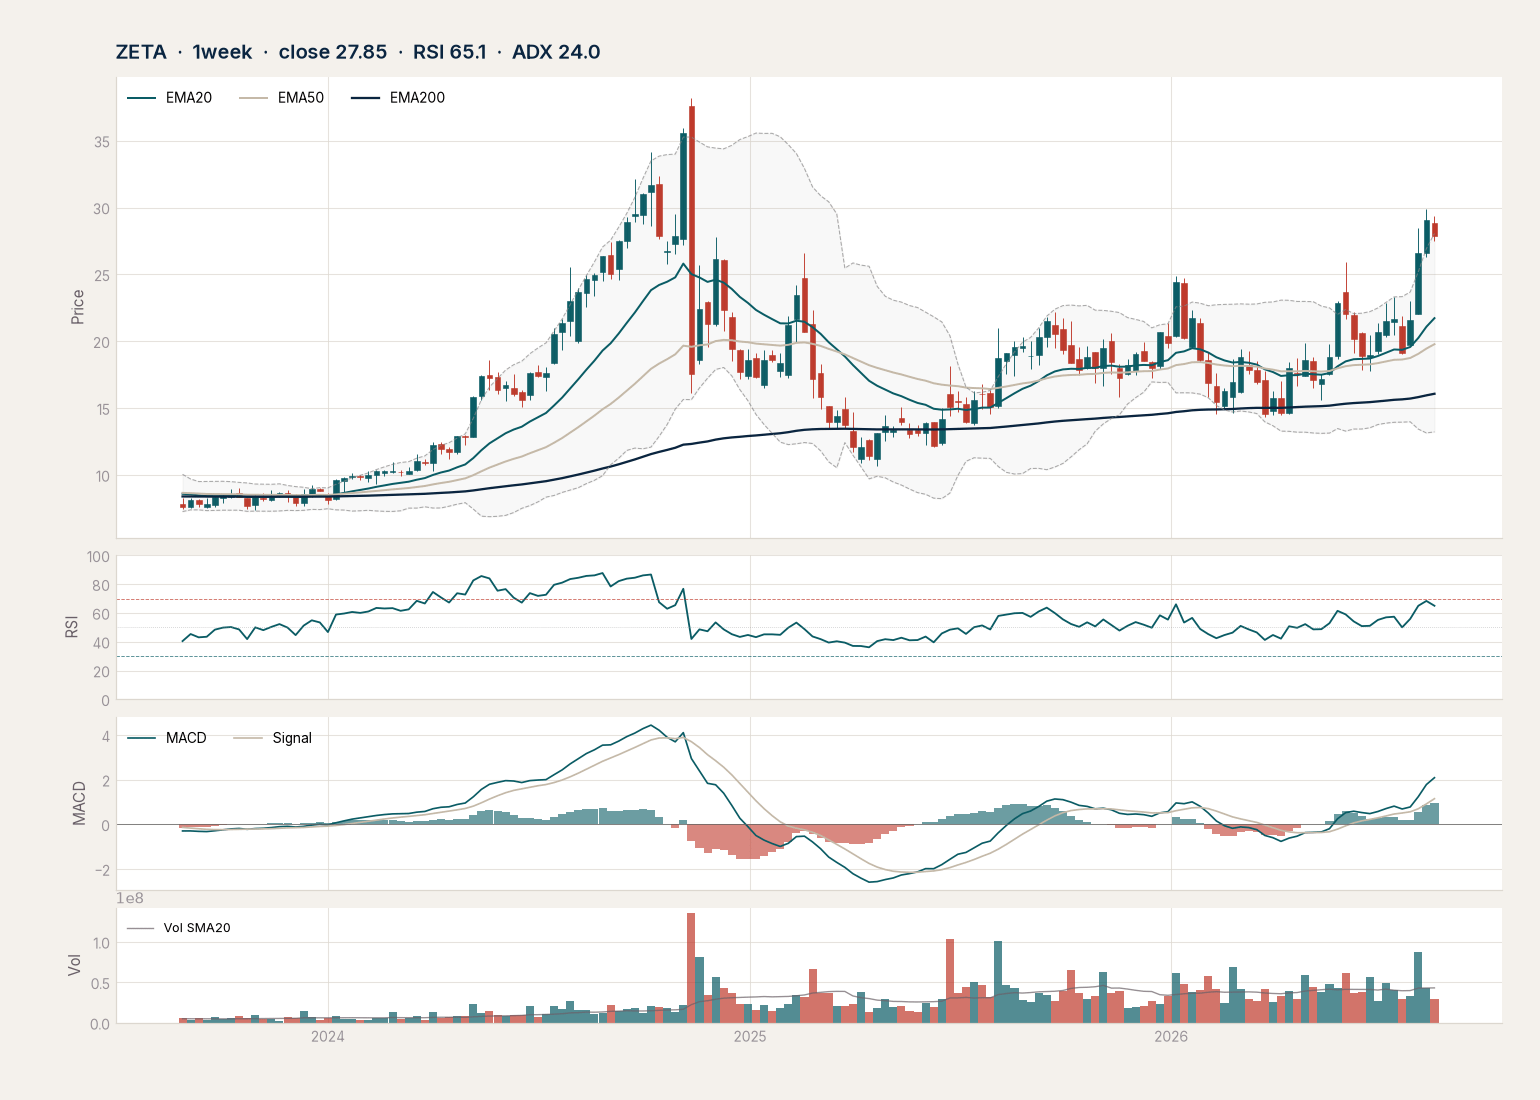
Price sits above the 20-week EMA at $21.73, the 50-week at $19.78 and the 200-week at $16.08. Those are averages of 20, 50 and 200 weekly closes, so roughly 5 months, 1 year and 4 years of price. Having all 3 beneath you in that order is what a restored uptrend looks like.
Weekly RSI is 65.1, firm and not yet stretched. Weekly ADX is 24.0, which measures how strong a trend is rather than its direction, and a reading in the mid-20s says the weekly trend is real but still building rather than exhausted.
The context matters. This stock hit an all-time high of $38.20 in November 2024, spent 16 months breaking down, bottomed at $14.36 in March and has doubled since. The weekly Kijun, a midpoint of the last 26 weeks that often acts as the trend’s floor, sits at $22.13.
So the weekly says the 2024 damage is undone and the primary trend is up. It also says the old high is still 37% above here, which is a lot of trapped supply to clear.

Daily chart
The daily is key for timing, and it’s cleaner than the weekly. Price at $27.85 sits above every daily moving average: the 20-day at $26.23, the 50-day at $23.51, the 100-day at $21.58 and the 200-day at $20.16. Bullishly stacked.
ADX at 38.0 confirms a strong trend, meaning buyers hold clear control and sellers are barely pushing back.
RSI is 61.4, which is firm, but still has room before it’s overbought.
MACD is flattening, at 1.99 against a 1.88 signal line. Momentum is still positive but no longer accelerating, which usually means consolidation rather than reversal.
ATR is $1.47, about 5.3% of price. ZETA 0.00%↑ moves more in a day than most move in a week.
Since mid-April, 39% of sessions have traded down to the 20-day at some point. This is a trending stock that still offers entries.
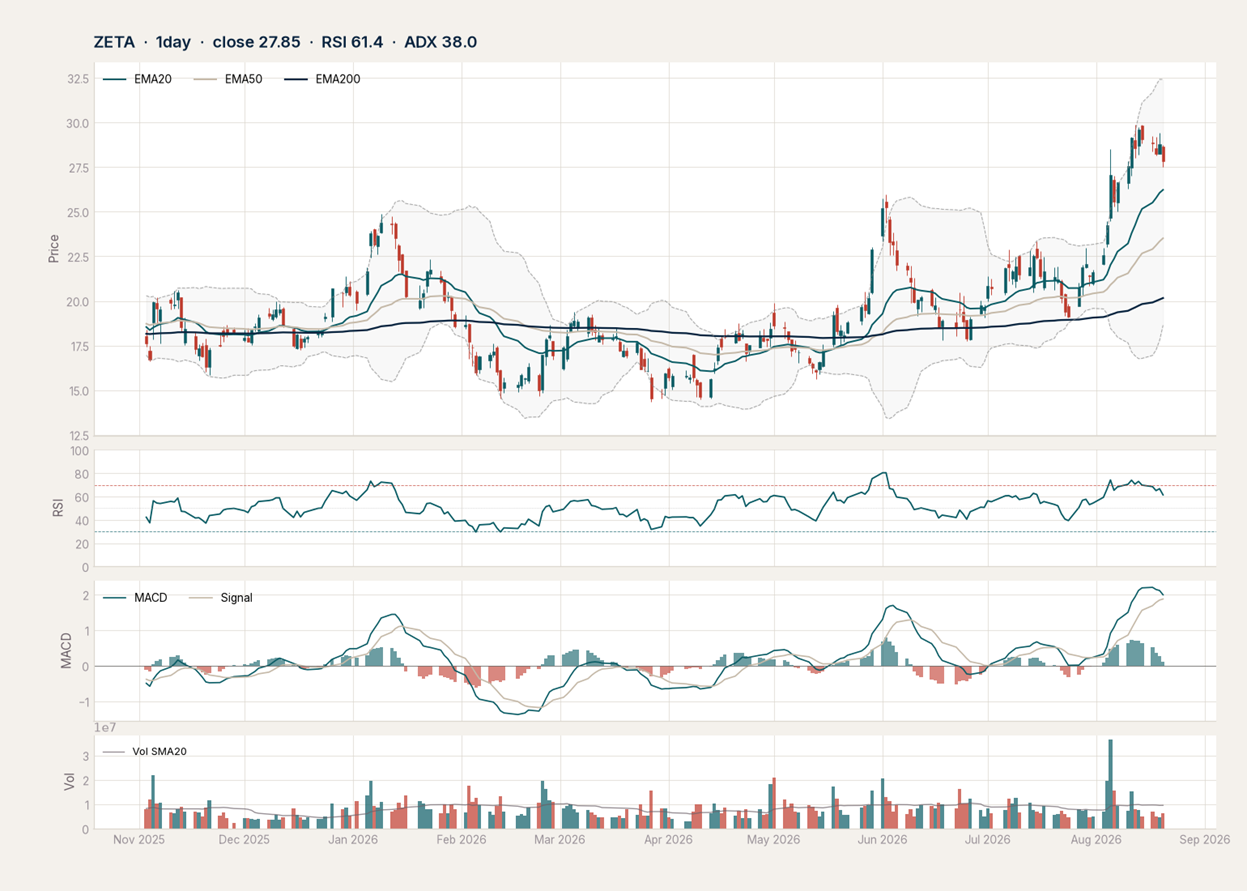
Technical conclusion: a clean Trend-Hold on both timeframes, and nothing in the price action argues against it. The weekly gives you permission to own it, the daily gives you a defined place to buy. The risk isn’t the chart, it’s the entry. Price sits 6.8% under a high set 9 days ago after a 94% run, so paying up here means buying the top of a 7-session range with no catalyst to break it until November.
The Trade Plan
Zeta is consolidating and currently sits above every moving average that matters.
That makes this a trend-continuation setup rather than a catalyst trade. It also means the honest advice is that you’re being paid to be patient. The 20-day is rising toward price at the same time price is resting, and those 2 lines converge somewhere around $26.50 within a couple of weeks.
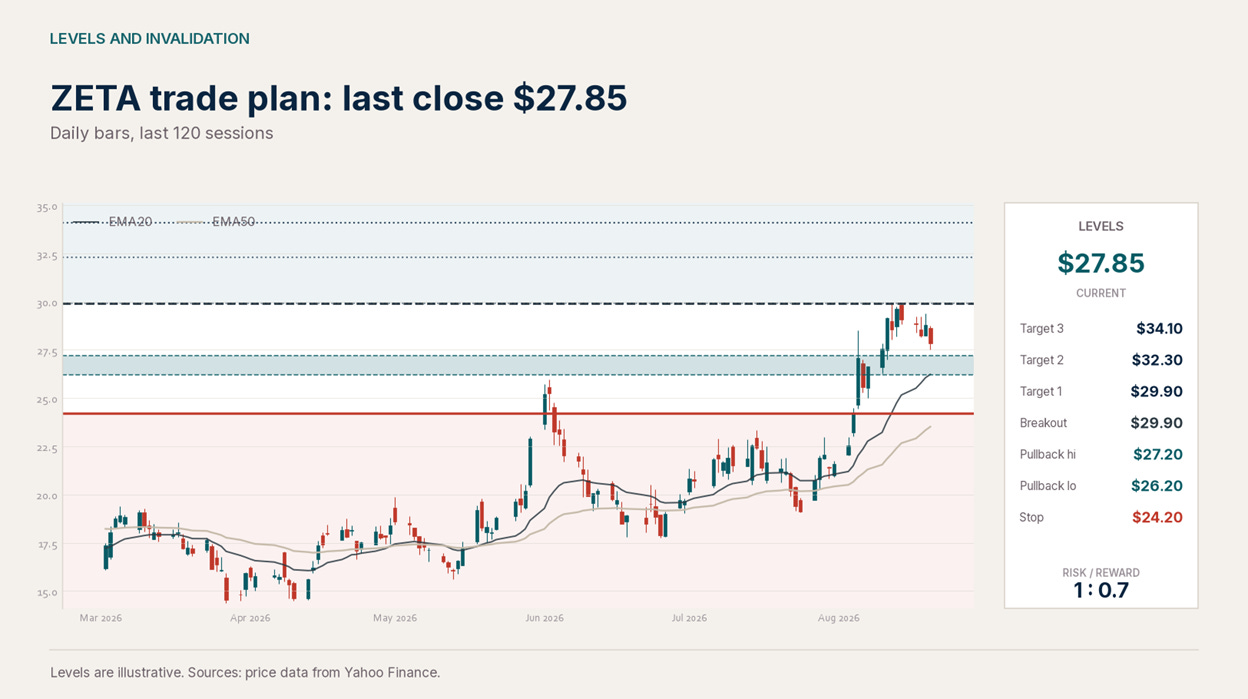
Entry zone: $26.20 to $27.
This is the rising 20-day at $26.23 and the lower half of the post-earnings range.
Stop: a daily close below $24.20.
That sits just under the pre-gap close of $24.26 and the daily Kijun at $24.48. Losing it means the entire earnings move has been given back, which is a clean thesis break rather than noise.
Targets:
T1 is $29.90, the August 12 high and the 52-week high.
T2 is $32.30, where the September 2024 shelf at $32.11 meets the upper Bollinger band at $32.41.
T3 is $34.10, the October 2024 high. 27.7% from entry, or 3.0 to 1.
What the valuation changes about this trade.
This stock may be fully priced objectively, but that isn’t necessarily a reason to avoid it. It is, however, a reason to know which trade you’re in.
Size smaller than usual. There’s no valuation cushion underneath. A stock at 4x sales that disappoints re-rates to 3x, and that’s 22% lower before any support level gets a say.
The stop carries more weight here. $24.20 isn’t a suggestion, it’s the entire risk framework. In a cheap stock you can average down. In this one you can’t, and 3x sales sits at $21.73 which is also the 20-week EMA.
Take the targets as they come. T2 at $32.30 is 4.46x sales and 20x EBITDA for a business guiding 25% underlying growth. If you get there, take something off rather than holding out for $38.20 on the story.
If you’re buying to hold for years rather than to trade the trend, the honest answer is different. You’d be paying today for a repositioning the margins haven’t earned yet, and your entry is nearer $24 than $27.
If it breaks out instead of pulling back, a daily close above $29.90 clears the range and puts T2 in play directly. Don’t buy the first day through. Let it retest $29.90 and hold, because failed breakouts from tight ranges are common and the retest costs you almost nothing.
Bottom line
Zeta is doing the hard part. The adoption data is specific and checkable, retention is the best it has posted, and it’s generating 60% more pipeline without adding salespeople.
What it hasn’t done is earn infrastructure economics. Gross margin is the lowest in the cohort it chose for itself and it’s falling on media mix, underlying growth goes to 20% by Q4, only 12% of next year’s revenue is under contract, and 11.8% of every revenue dollar goes out as stock.
The market has already granted most of the rerating the company asked for. Its own fair-value math pointed at $20 and the stock is at $27.85. That doesn’t make it expensive. It makes the easy money gone.
One number decides it: $24.20. Above it this is a strong uptrend with a real business behind it and a defined place to buy. Below it the earnings move is fully retraced, and you’re holding a 25% grower at 4x sales.
All content provided is for informational and educational purposes only and does not constitute investment advice, a recommendation, or an offer to buy or sell any security. The trade plans, levels, and scenarios discussed are illustrative frameworks based on market structure and are not guarantees of performance. Markets involve risk, and losses are possible. Past performance is not indicative of future results. Each reader is responsible for their own investment decisions, position sizing, and risk management.
Zeta’s margin pressure is a good reminder that calling yourself AI infrastructure does not automatically justify the multiple.