

Copper’s Correction, Bigger Opportunity?
Copper still looks like one of the most important long-term themes in markets, but the recent drop is a reminder that even the best secular stories can correct hard when price gets ahead of reality.

Copper matters because it sits at the center of both the old economy and the new one. It is essential for construction, machinery, autos, and industrial production. It is also critical for electrification, grid expansion, EVs, renewables, transformers, and data-center power demand.
That is why the long-term case remains compelling. But markets do not move on long-term logic alone. The rally into early 2026 was driven not just by structural demand optimism, but also by supply fears, speculative flows, a weaker dollar, and tariff-related distortions. The pullback that followed was the market correcting that excess.
So the real question is not whether copper still has a future. It clearly does. The question is whether this is the right time to press aggressively, or whether patience is still the better position.

Key Takeaways
Copper remains one of the clearest long-term beneficiaries of electrification and power infrastructure.
The recent drop came after prices ran ahead of near-term physical demand.
Inventories rebuilt, China demand signals softened, and the market started repricing the short-term imbalance.
The long-term bull case is still intact, but the medium-term setup is less clean than it was.
This is a market to map carefully, not chase emotionally.
Good stories still need good timing.
Gold’s Bull Market Isn’t Over. The $6K Question Starts Here

In this article, we analyze both the price of , the SPDR Gold Shares ETF, and the underlying price of gold to provide a complete view of the market.
Copper Market Setup
The long-term demand case for copper is easy to understand. The world needs more electricity, more grid investment, more transmission, more charging infrastructure, and more industrial upgrading. Copper sits inside all of it.

The problem is that the market moved too far, too fast. Prices began acting as if scarcity was immediate, while the physical market was showing more nuance. Metal was pulled into the U.S. because of tariff fears and price dislocations, inventories rose sharply, and spot demand, especially out of China, did not fully confirm the excitement.
That is usually how commodity pullbacks happen. First, the market prices the future. Then it gets forced to confront the present.
The supply side still matters. Copper supply is difficult to grow quickly. Projects are expensive, permitting takes time, grades are under pressure, and large producers continue to face operational setbacks. That keeps the long-term floor under the copper story.

But near term, the environment is mixed. Structural demand is strong. Cyclical demand is less convincing. That creates a market where the long-term trend can remain attractive while the short-term path stays volatile.
Copper still has one of the strongest secular demand profiles in the commodity complex. But the recent pullback makes sense because the rally outran real demand and near-term market conditions became too stretched. The future still looks constructive. The present looks more selective.
Secular strength does not prevent cyclical corrections.
Technical Analysis
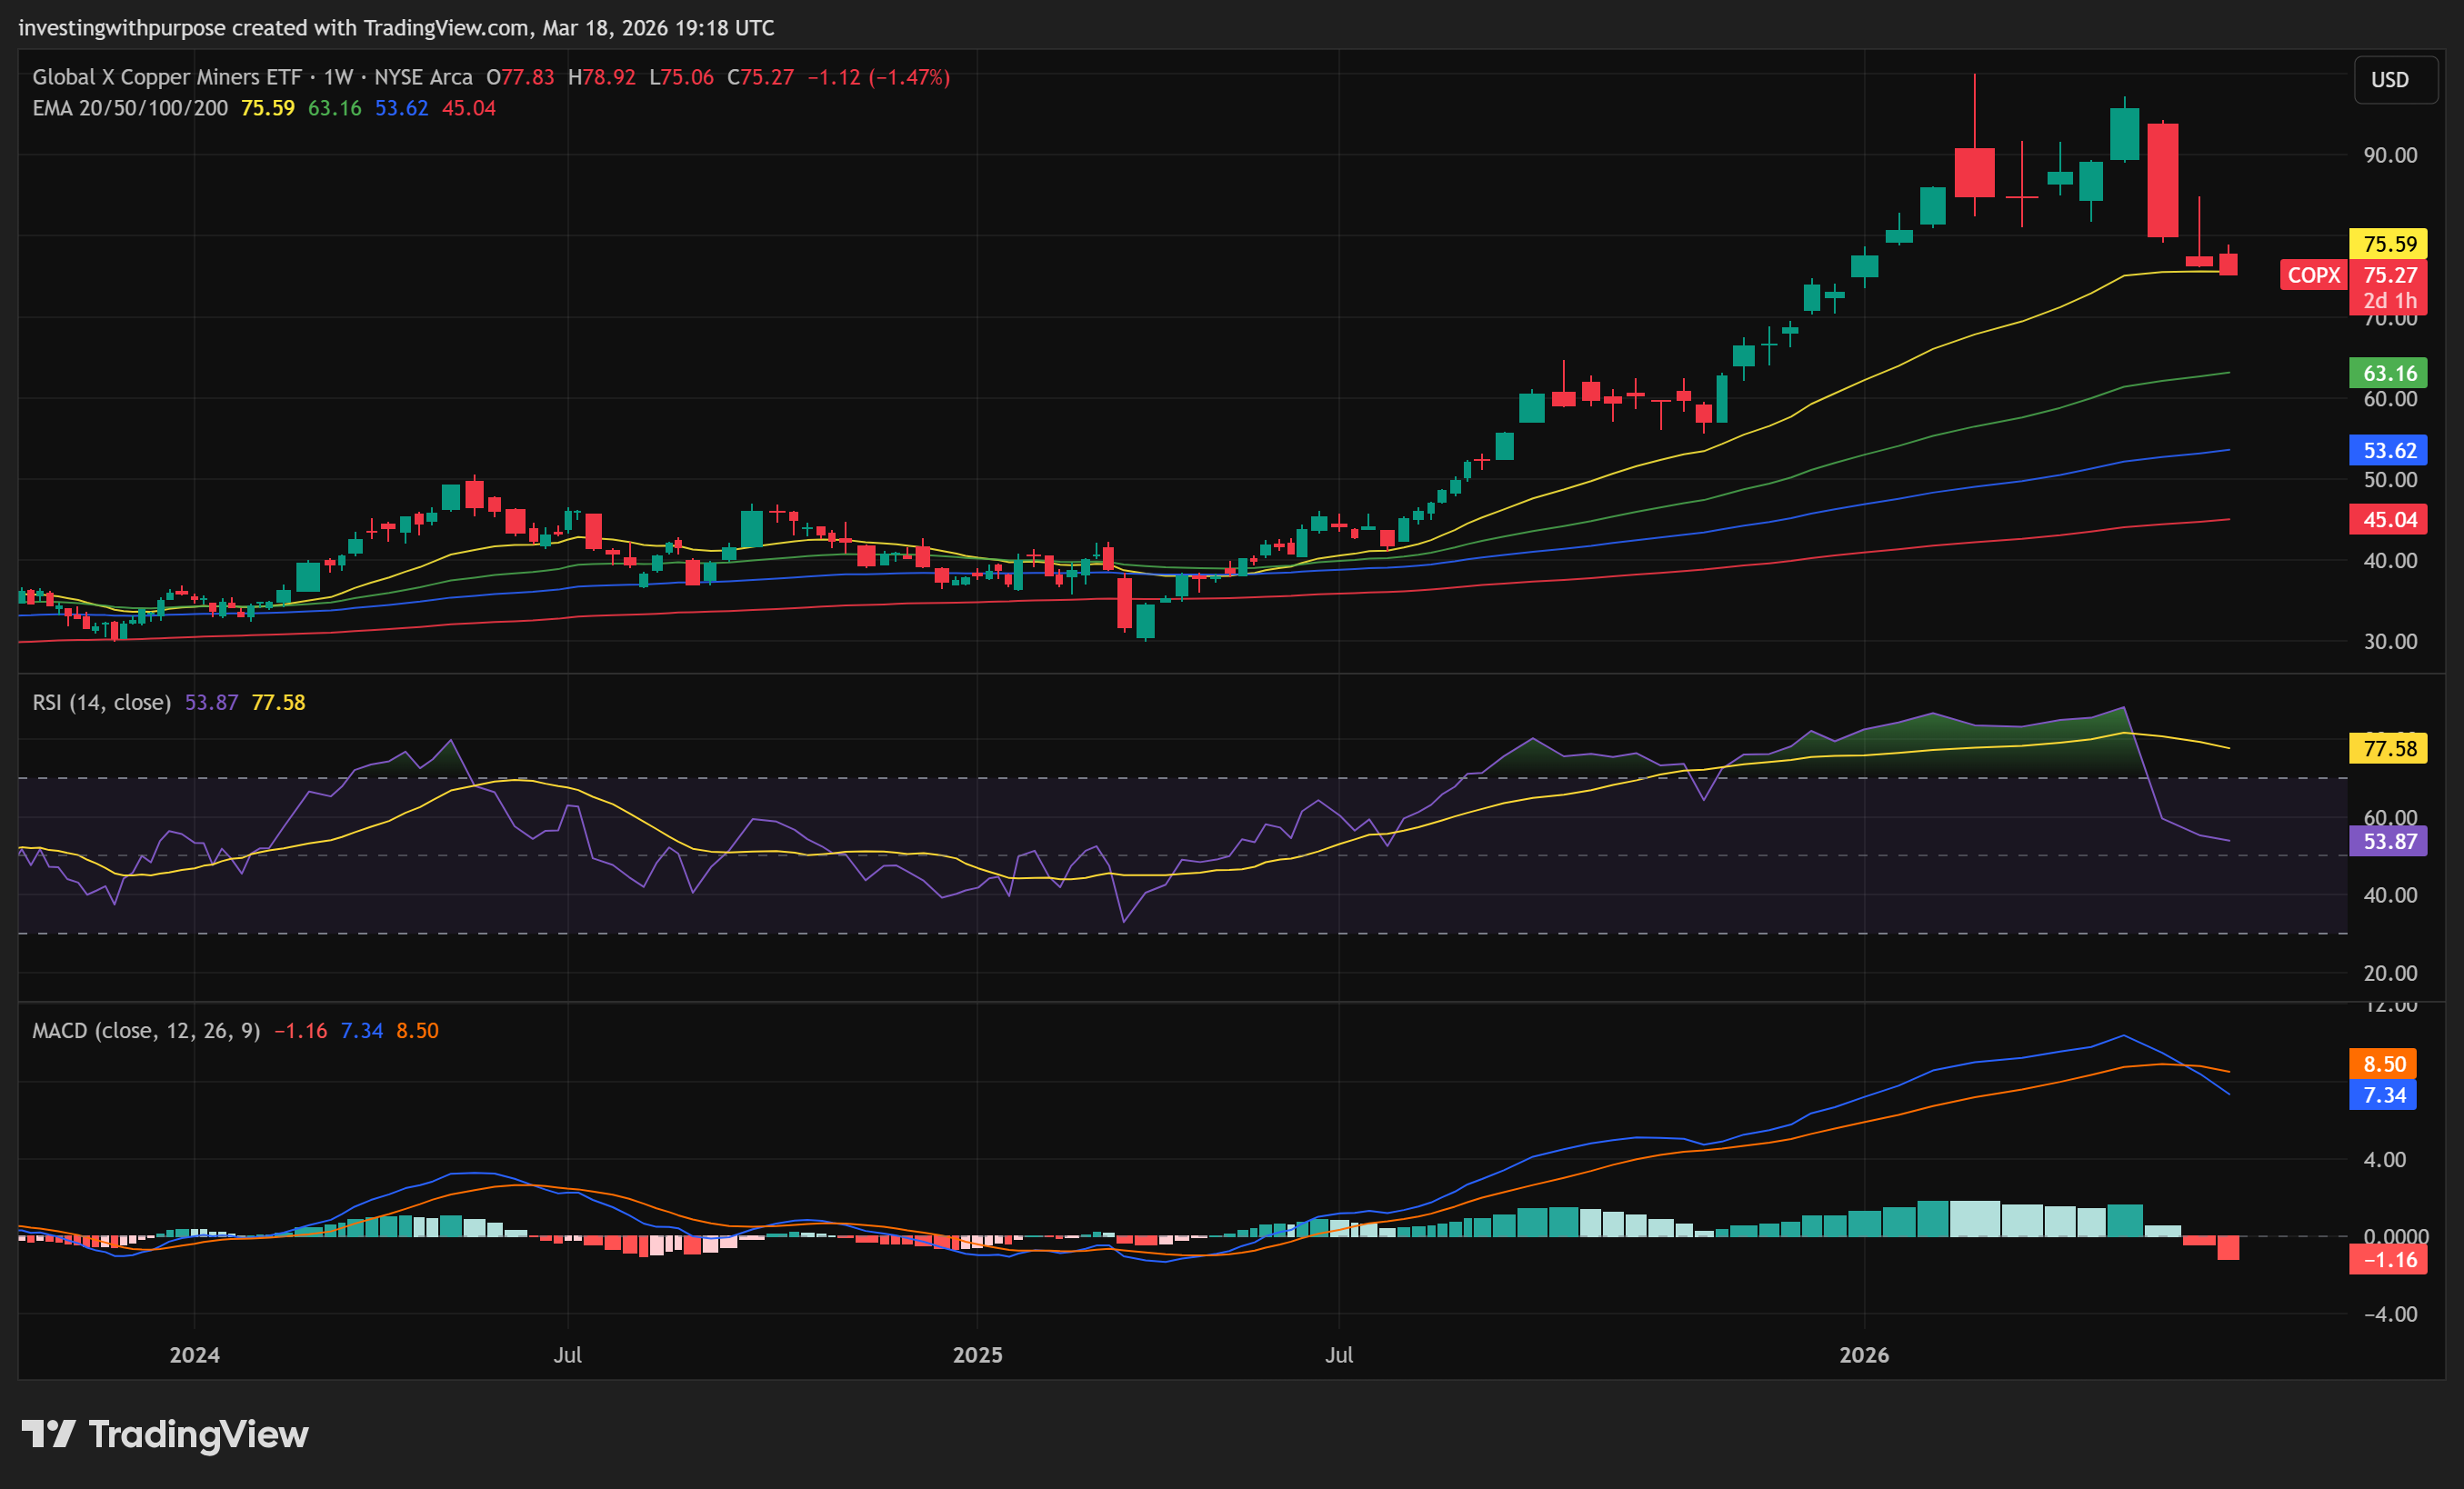
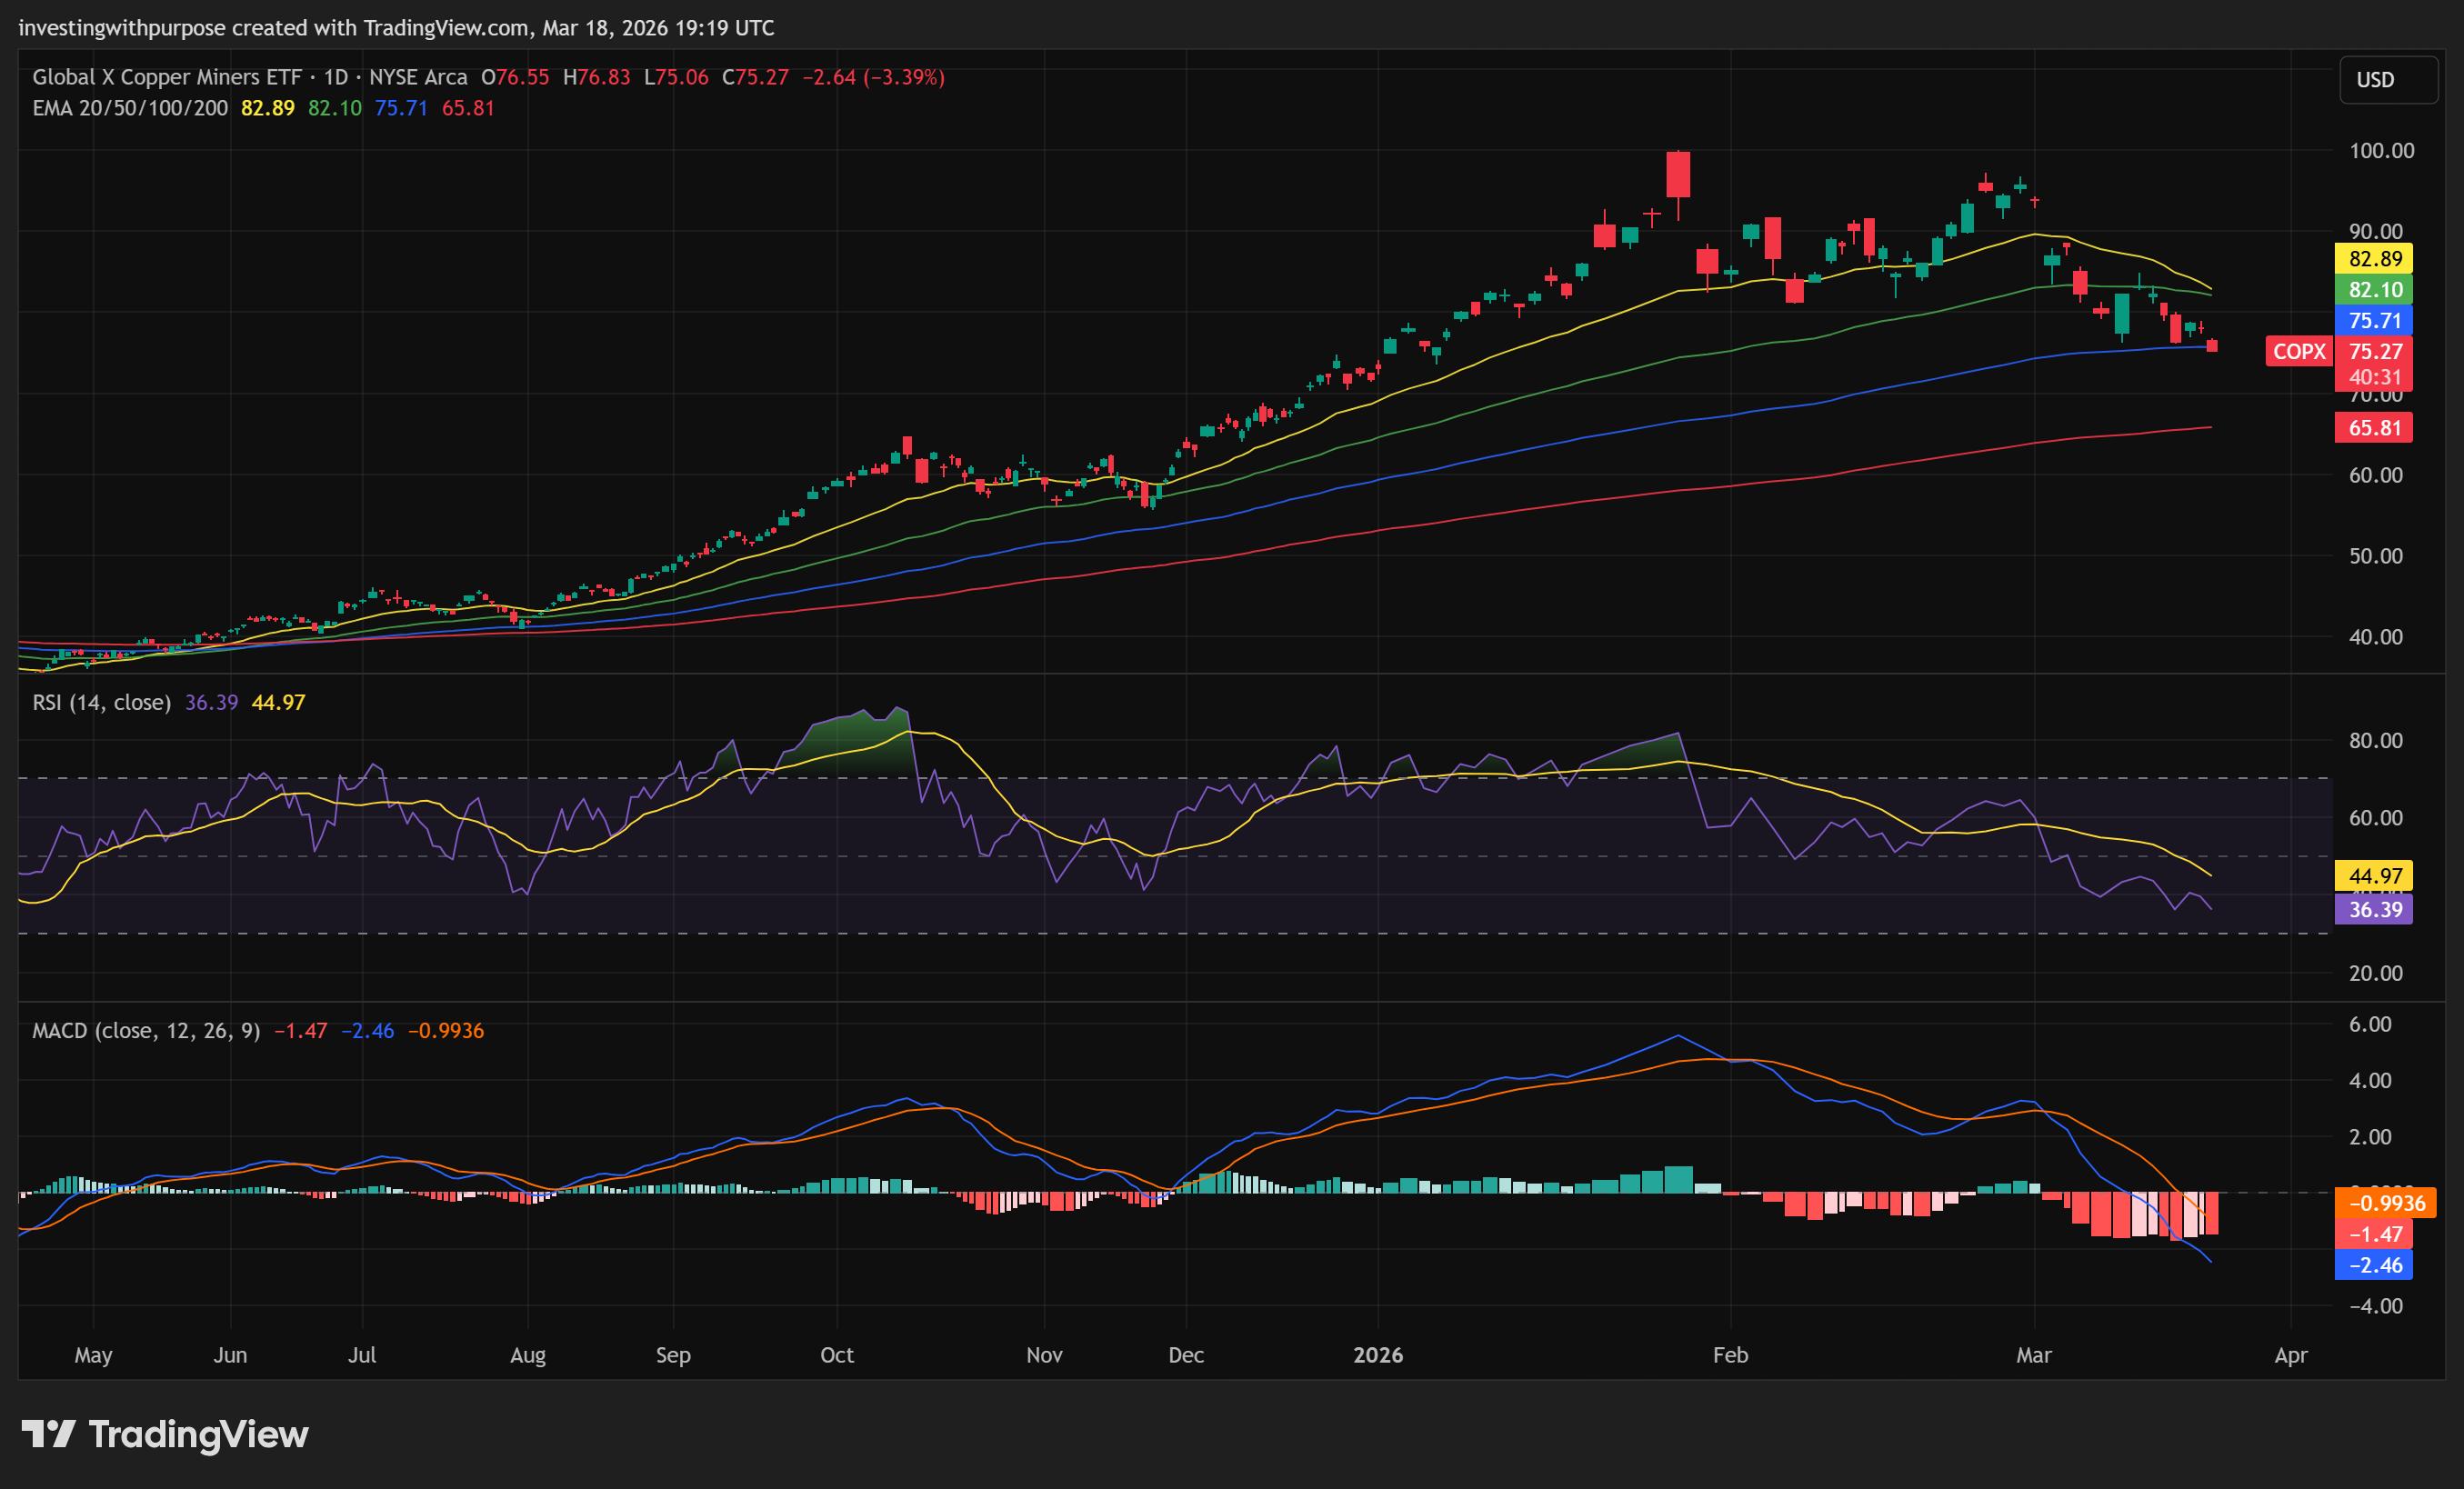
For investors using COPX as a practical copper proxy, the bigger trend is still broadly constructive, but the medium-term chart has clearly weakened.
The key support zone sits in the $75 to $76.5 area. That matters because several forms of support begin to overlap there. It is where the market is testing an important retracement area from the larger advance, while also sitting near longer-term trend support. In strong trends, this is often where buyers try to regain control.
Below that, $73.2 is the next major support. If price loses the mid-70s decisively, that level becomes critical. A break there would increase the odds that the correction is still unfolding and could open the way toward $71.1, $68.9, and potentially $64.9.
On the upside, the first resistance sits around $78.0 to $78.3. Then comes $79.5 to $80.3, which is the first real reclaim zone. If price can recover that area, the setup starts to improve. Above that, $81.5 to $82.8 is heavier resistance, while $83.4 to $84.9 is the key repair zone. That is the level range bulls would need to reclaim to argue that the correction is largely complete.
Momentum tells a similar story across timeframes. Short-term momentum is still weak. Medium-term momentum has clearly rolled over. Longer-term momentum is softer, but not fully broken. That combination usually means one of 2 things: either the market needs more time to build a base, or it needs one more downside probe before the next durable move higher.
From an Elliott Wave perspective, the current move still fits best as a corrective phase after a mature advance, rather than a complete breakdown of the long-term trend. That is useful as a framework, but not as certainty. The main takeaway is simple: the bigger bull case is still alive, but the correction has not clearly finished yet.
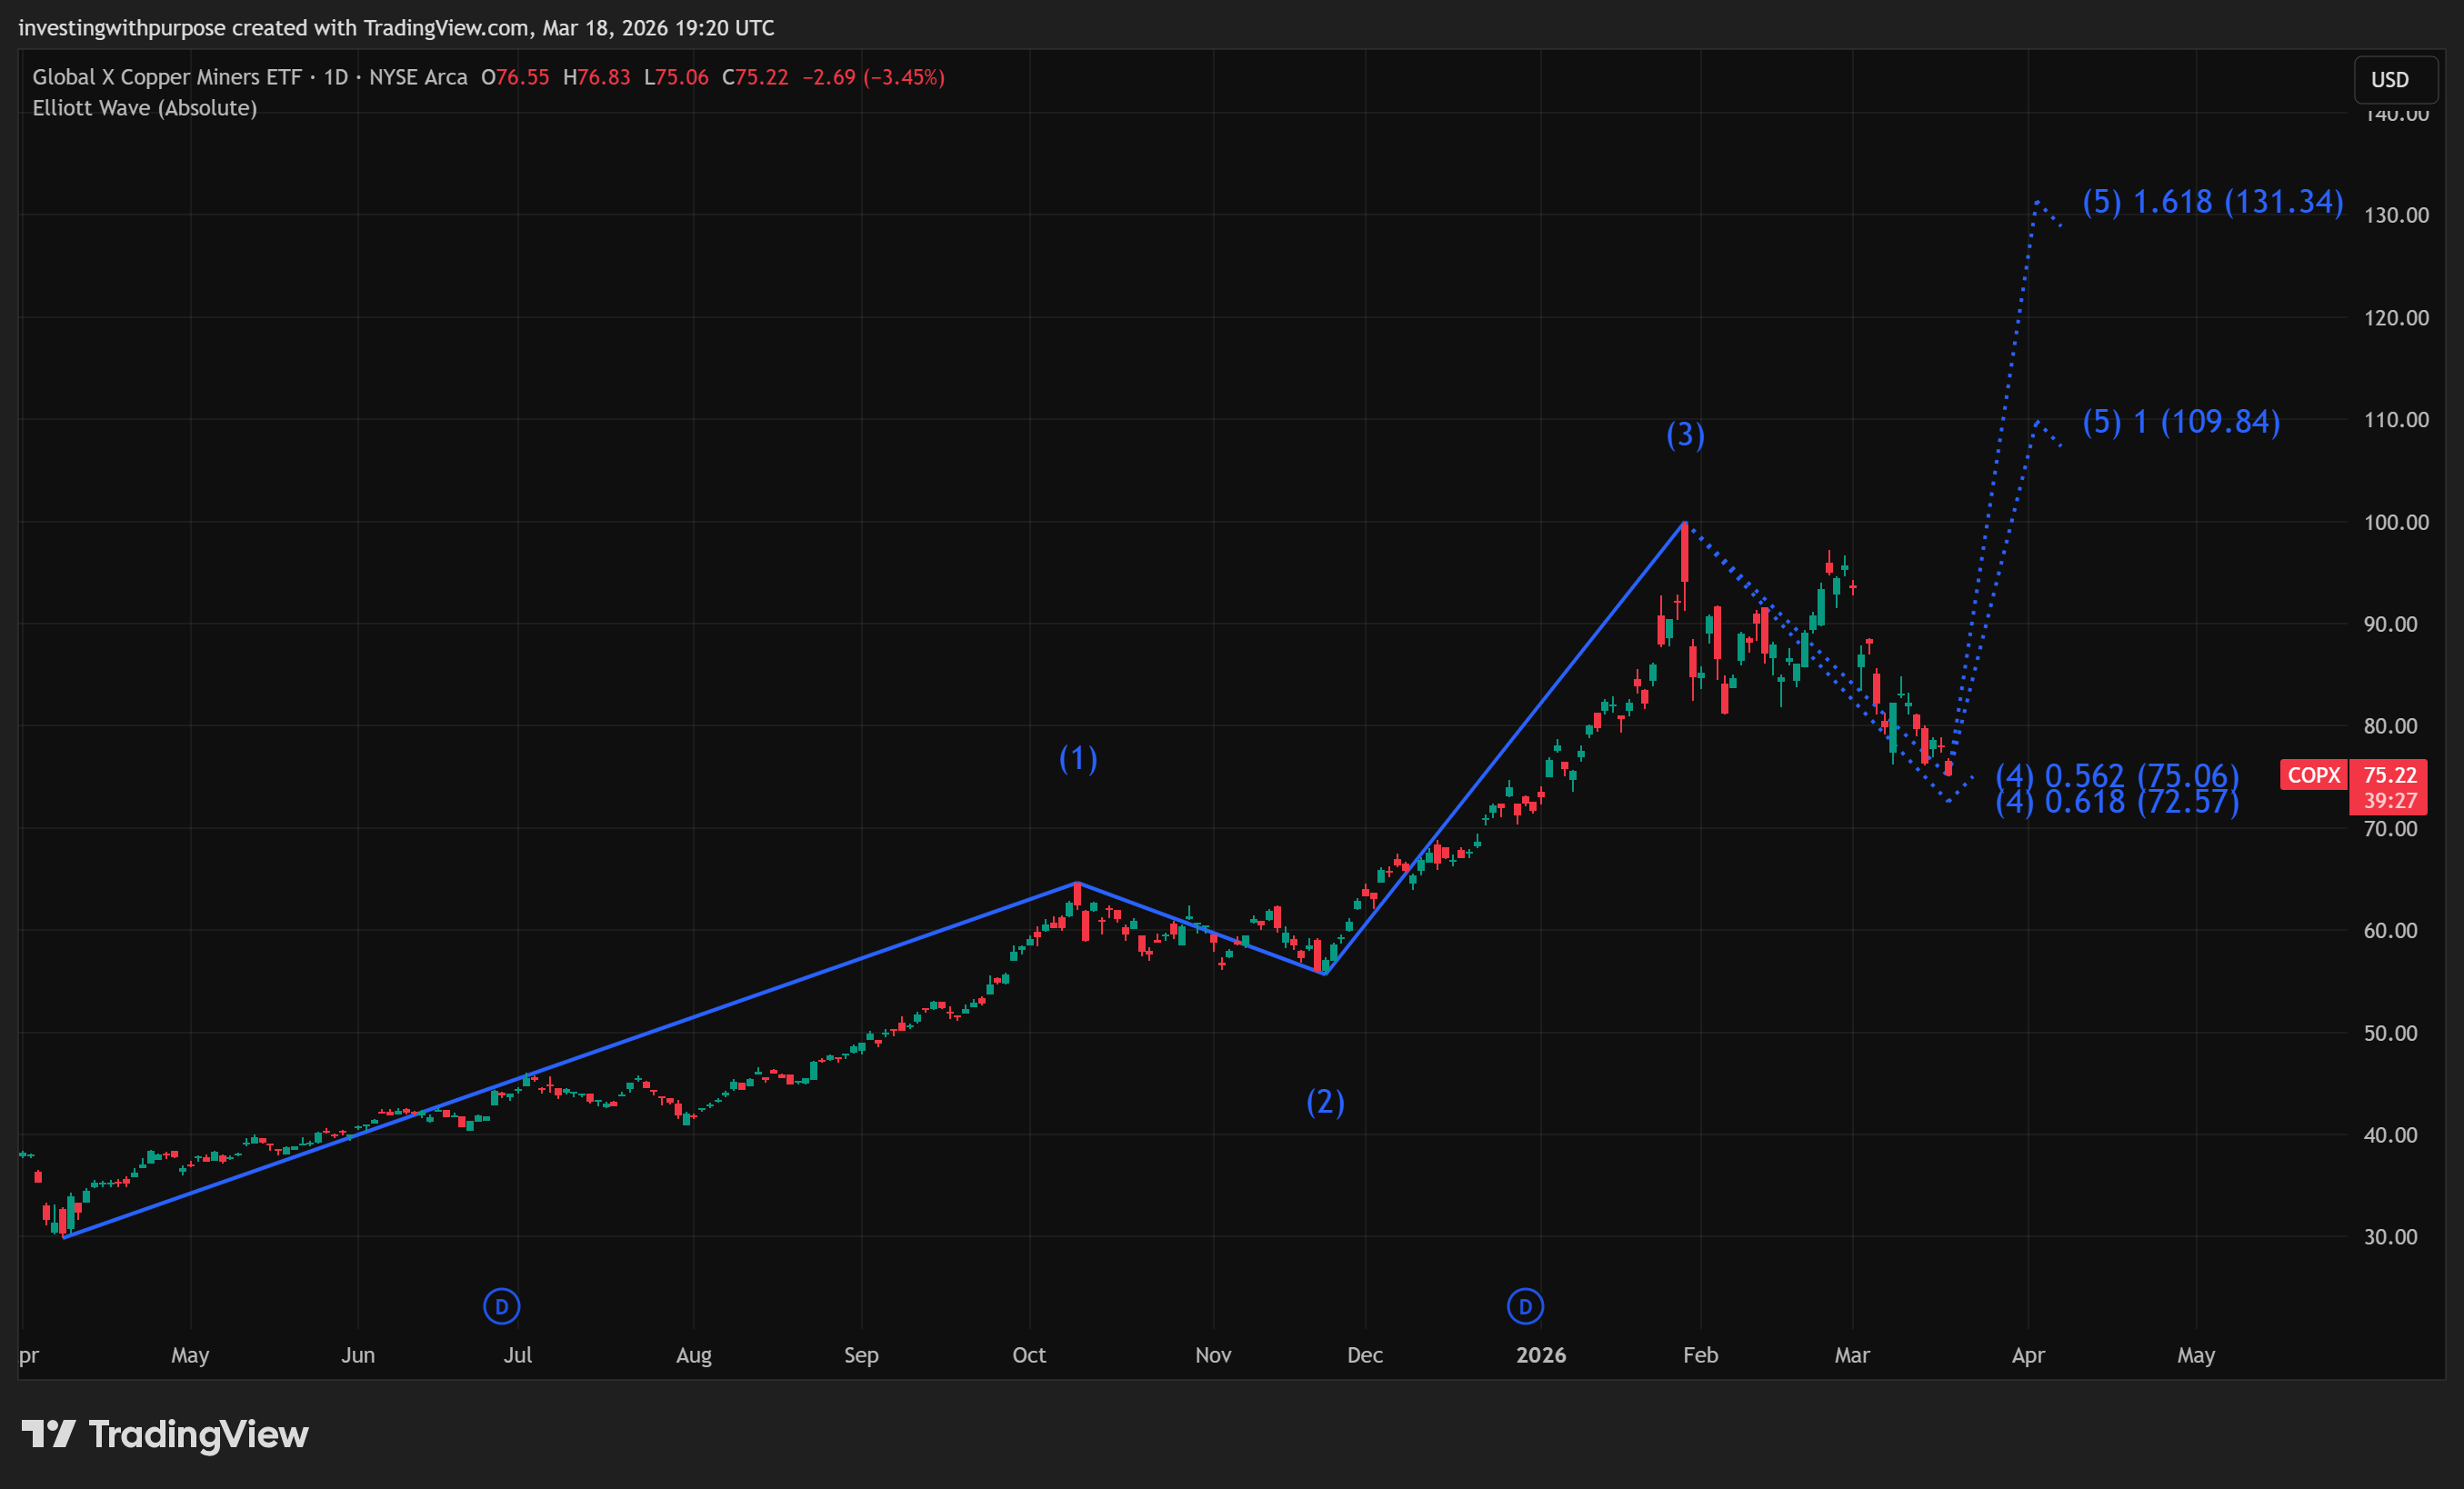
COPX is near an important support cluster, which makes a bounce possible. But a bounce alone is not enough. The market still needs to reclaim lost levels and rebuild momentum before the correction can be considered repaired.
Support can stop a decline. Only reclaiming resistance can restart a trend.
Trade Plan
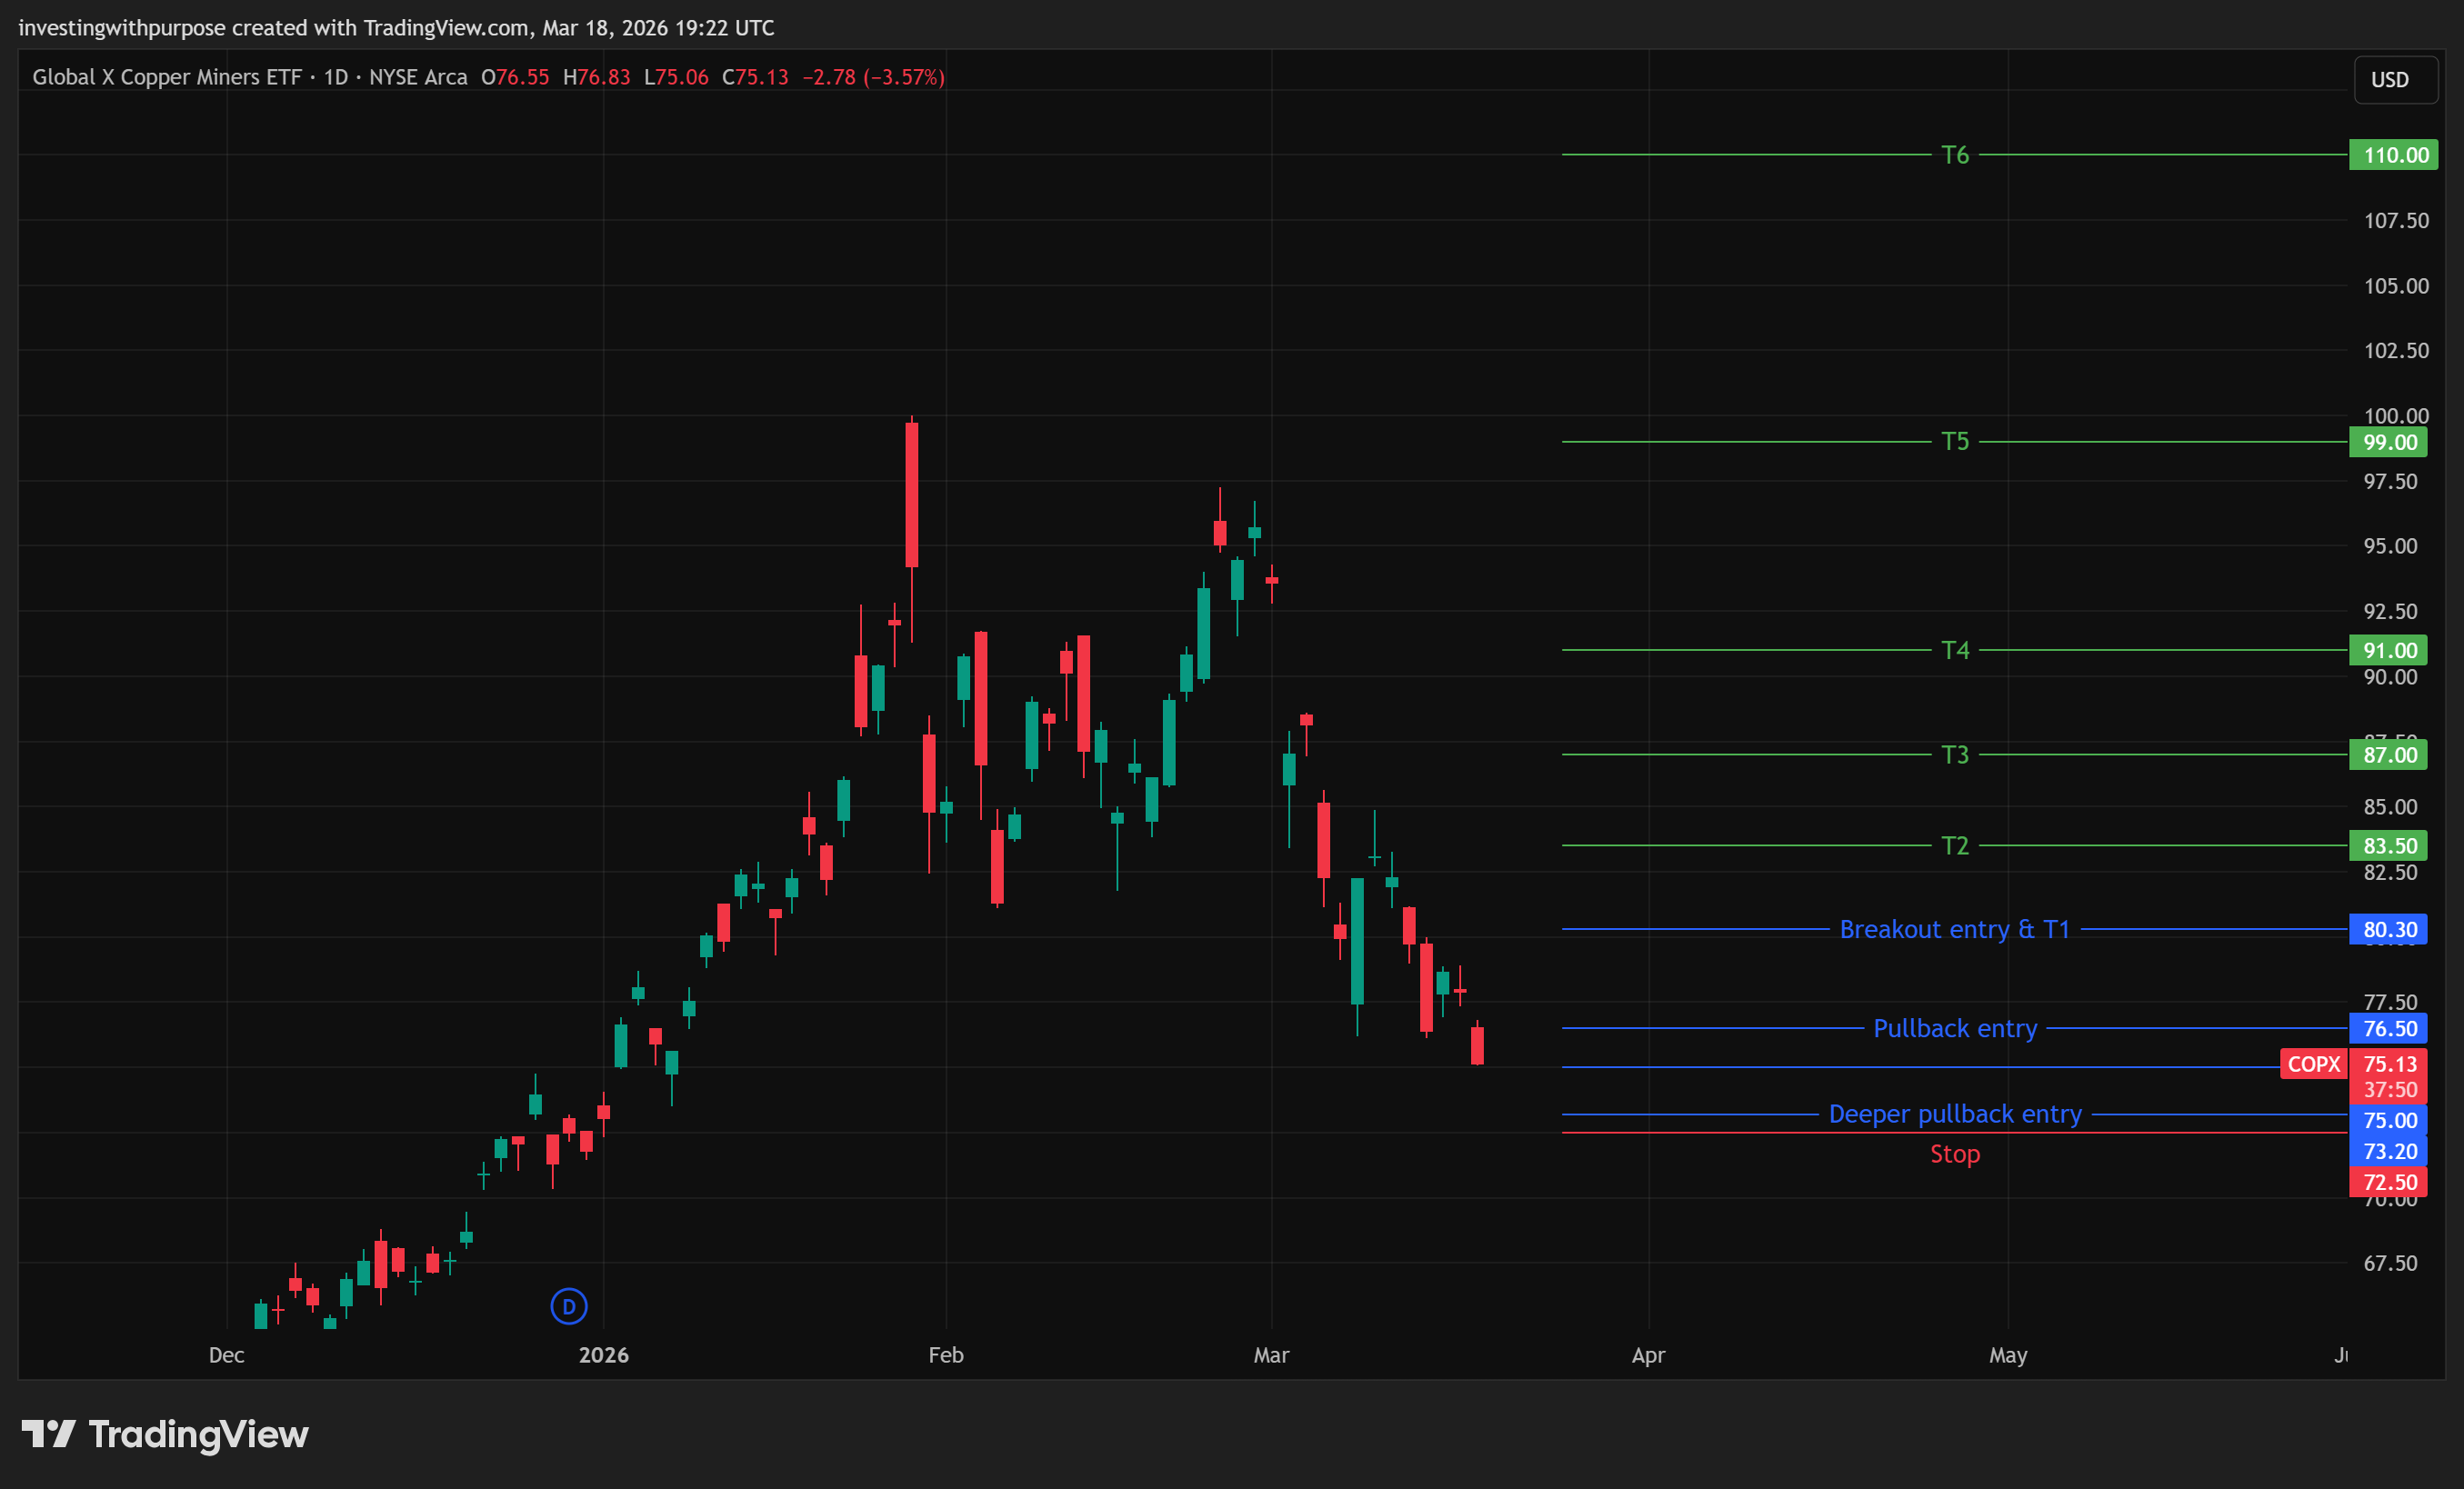
Pullback entries: The best pullback zone is $75 to $76.5, but only if price begins to stabilize there. This area matters because it is where larger trend support and retracement support begin to line up.
Deeper pullback entries: If that zone fails, the next area worth watching is $72.5 to $73.2. This is a more important structural support band for medium-term investors.
Breakout entries:
A move back above $80.3 would be the first sign that the chart is improving. A stronger confirmation comes on a reclaim of $83.5 to $84.9, which would suggest the correction is transitioning into a real repair phase.Invalidation: $72.5 is the key line. If that fails decisively, the correction likely has further to run.
Targets:
Short term: $80 to $83.5
Medium term: $87 to $91
Long term: $99 to $110
Rolling stop logic: Use the structural support zone as the initial risk line. If price reclaims higher resistance and starts forming higher lows, stops can be trailed under those new higher lows.
Position sizing: Keep size smaller when using wider stops around support. Increase size only when the chart improves and the risk can be defined more tightly.
Bottom Line
Copper still has a very attractive long-term story. That part has not changed.
What has changed is the setup. The market became too extended, near-term demand did not fully support the rally, and the chart is now working through that excess. For medium- to long-term investors, this is not the cleanest place to chase strength. It is a setup that still demands patience.
The opportunity remains real. But so does the risk.
The single most important level is $72.5. If that holds and the market starts reclaiming the low 80s, the correction can still turn into a healthy reset within a broader bull trend. If it breaks, the path lower likely stays open.
Right now, copper looks more like a market to prepare for than one to rush into.
This article is for informational and educational purposes only and reflects personal opinion, not individualized investment advice. Nothing here should be interpreted as a recommendation to buy, sell, or hold any security. All investments involve risk, including the potential loss of principal. Market conditions can change quickly, and past performance does not guarantee future results.