

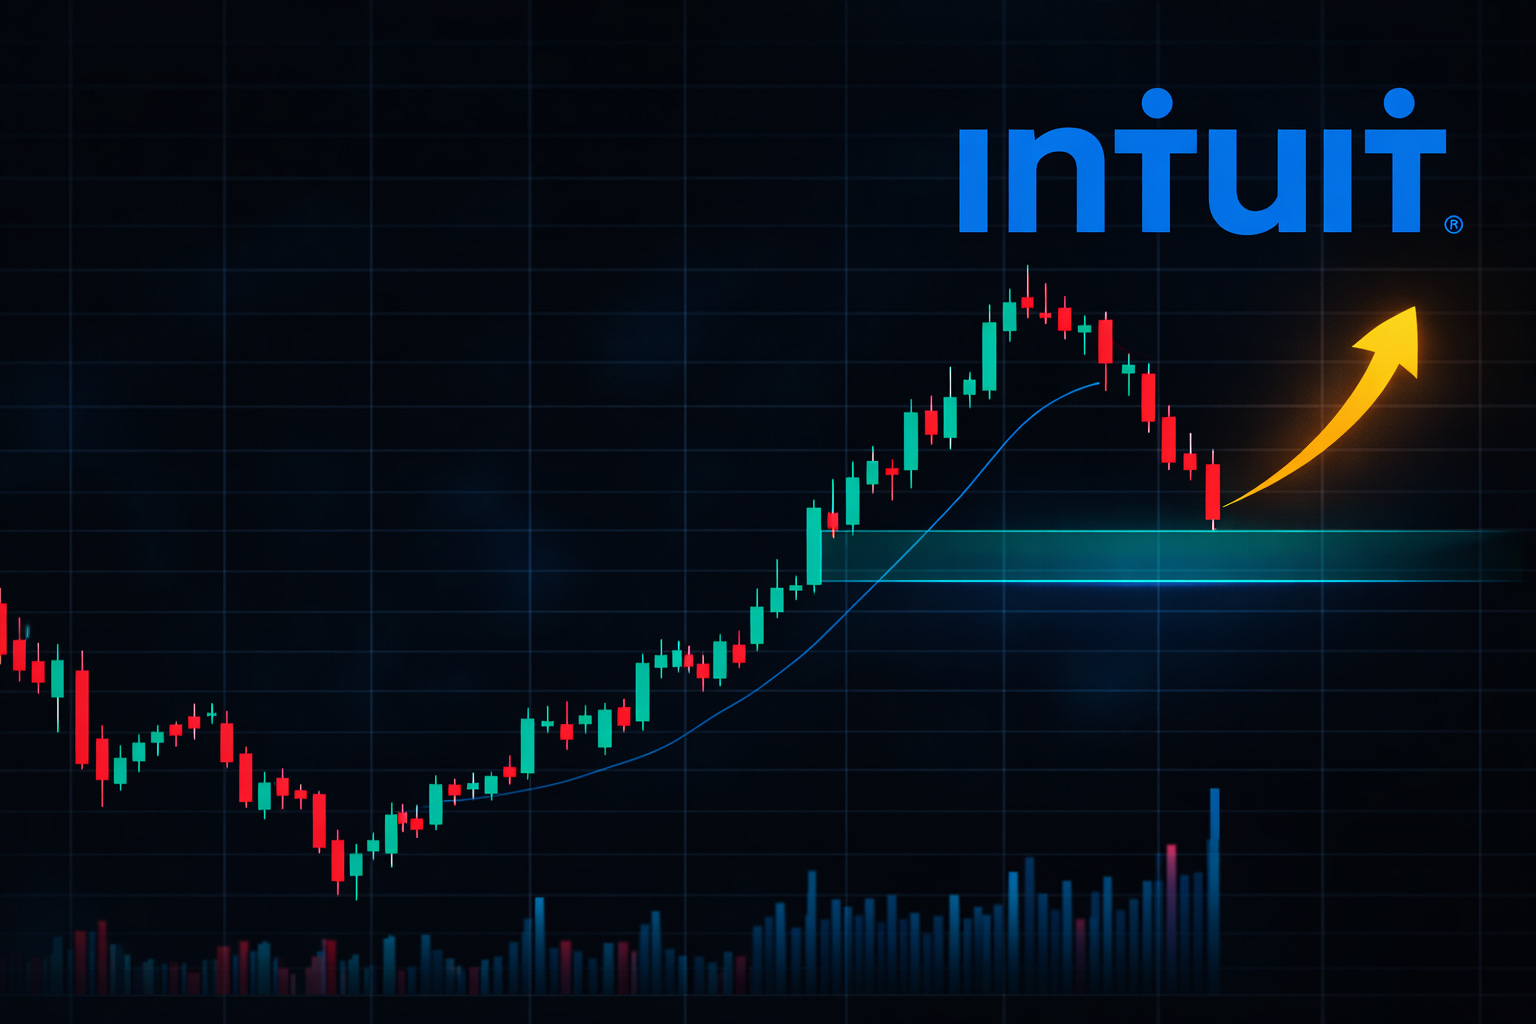
INTUIT Delivered. Now the Next Opportunity Is Forming.
Our original trade worked. Now INTU is consolidating and approaching the next potential entry zone.

On February 27 we published a thesis on Intuit INTU 0.00%↑ arguing that the panic in the stock price was disconnected from the underlying business. At the time the stock had collapsed 57% from its $813 peak to a capitulation low of $349.
INTU rallied sharply from the pullback zone and climbed roughly 25% from the entry area, pushing into the $459 to $485 resistance range that we identified as Target 2.
The framework was simple.
The $349 low was the structural line in the sand.
The $371 to $392 zone was the pullback entry.
A daily close above $420 was the breakout confirmation.
Since then, the setup has played out almost exactly as expected.
That move marked the first meaningful recovery leg after months of relentless selling.
Now the stock is doing what strong recoveries typically do after a fast advance.
It is pulling back and consolidating. The next opportunity may be forming.
The Stock Wall Street Is Panic-Selling While Management Is Panic-Buying

The panic is priced in. The platform is not.
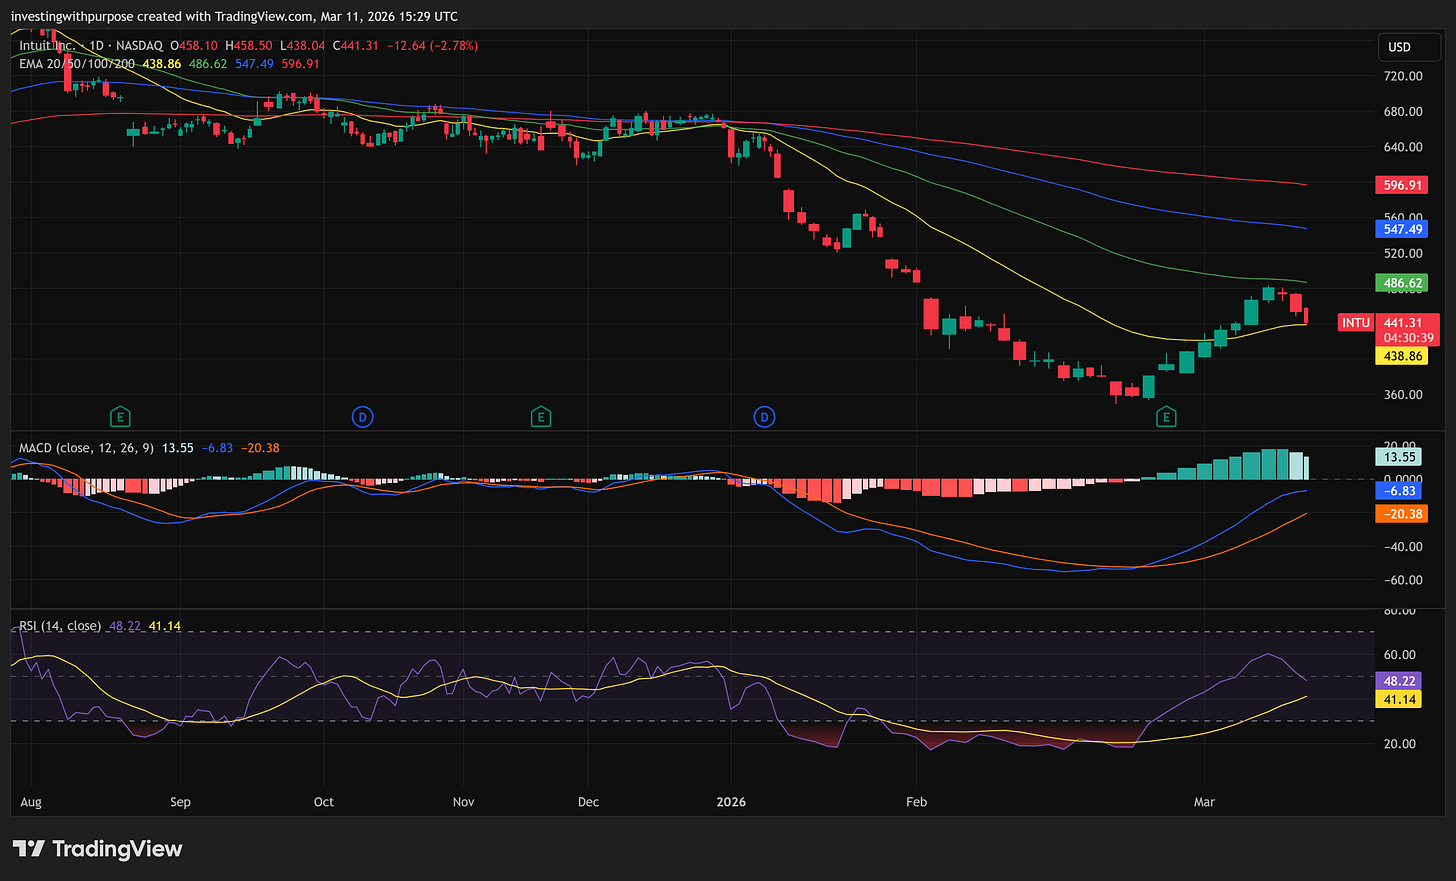
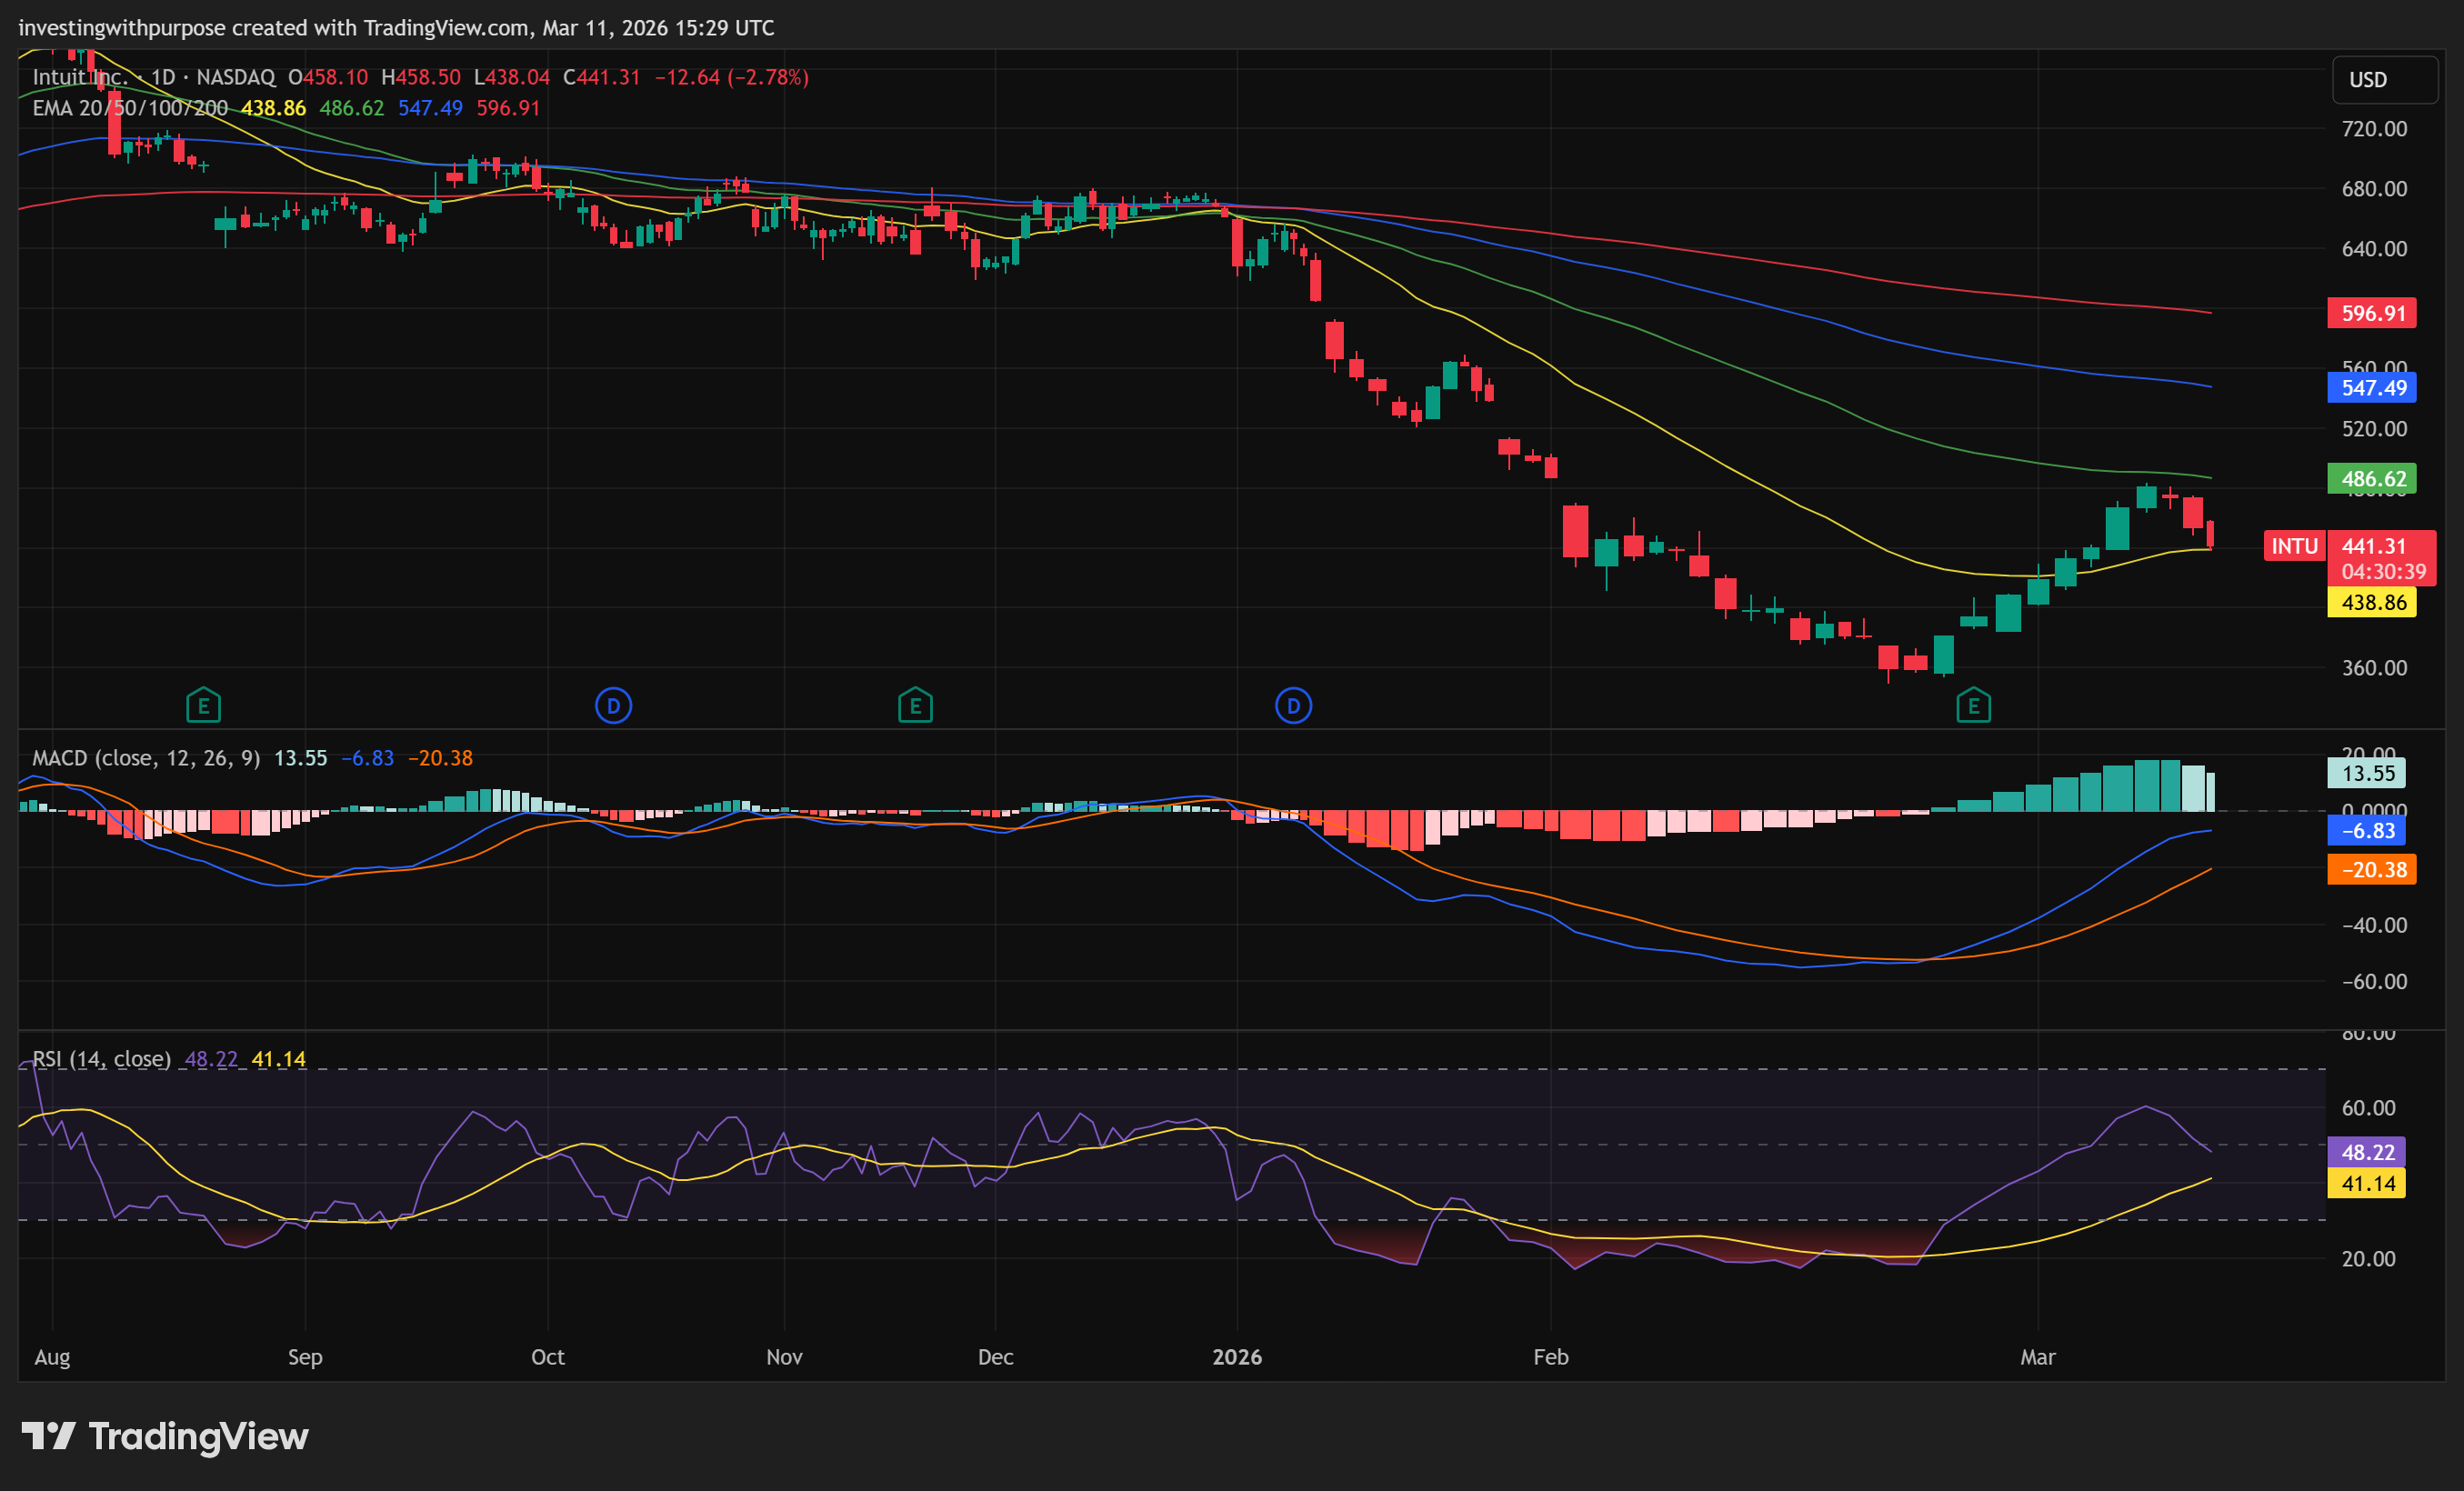
Technical Structure Now
The damage from the 2025 decline is still visible. INTU remains below the major moving averages and the broader trend has not fully repaired itself yet.
But the structure has clearly improved.
For the first time since last summer the stock produced:
A higher low
A higher high
Momentum confirmation
That sequence often marks the beginning of a base formation process rather than the continuation of a pure downtrend.
The recent pullback is occurring directly into a cluster of technical support.
The $420 to $431 zone is now the most important level on the chart.
This region contains multiple signals converging together:
The prior breakout level near $420
The 0.618 Fibonacci retracement of the recent rally near $431
Short term trend support and the Bollinger midline
If buyers defend this zone, the recovery structure remains intact and the next leg higher becomes possible.
Resistance Levels
If momentum returns, the upside levels remain clearly defined.
The first pivot sits near $459, the same area that marked the first recovery high during the previous rally.
Above that, the next resistance cluster appears between $485 and $511, where retracement levels and the declining intermediate moving averages begin to converge.
These zones represent the next checkpoints for the recovery thesis.
Updated Trade Plan
Two setups remain valid depending on how price behaves near support.
Pullback Entry
